9 Best Self-Service Analytics Platforms (2026)
Compare 9 self-service analytics platforms – Holistics, Power BI, Looker, Tableau, ThoughtSpot, and more – with pricing, pros, cons, and evaluation criteria.
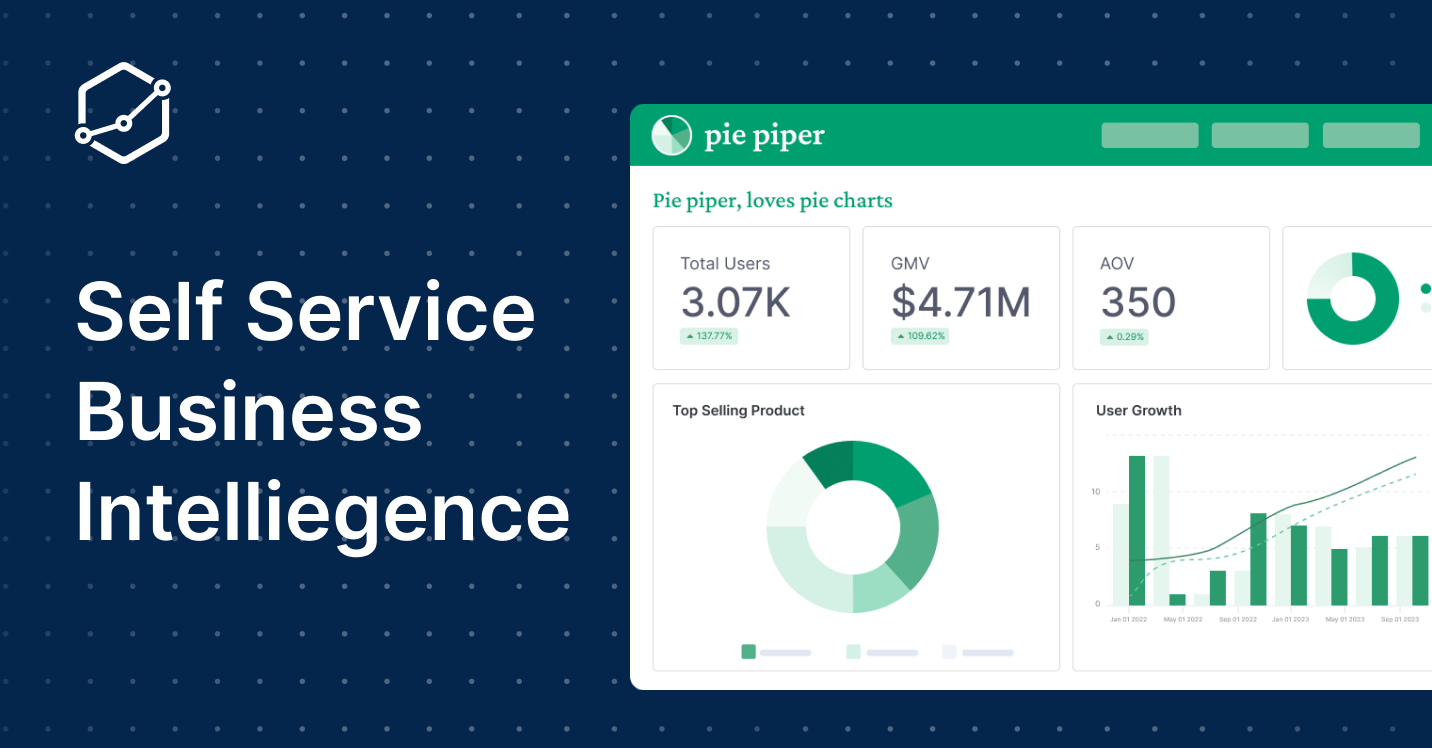
In this article, we'll walk you through:
- What exactly is self-service analytics? Having a good understanding of the concepts helps you navigate the BI space more easily.
- How to evaluate self-service analytics tools? What features should you look for?
- The best self-service analytics tools, in my opinion, with their pros, cons, and pricing.
Quick Comparison
| Tool | Semantic Layer | NL / AI Querying | Version Control | Best For | Pricing |
|---|---|---|---|---|---|
| Holistics | Rich (AQL) | ✅ | ✅ Git | Governed self-service with semantic modeling | From $800/mo |
| Metabase | None | ❌ | ❌ | Small teams, open-source flexibility | Free / $575/mo Pro |
| Looker | Rich (LookML) | ✅ | ✅ Git | Large Google Cloud enterprises | ~$89K/year median |
| ThoughtSpot | Rich (Spotter) | ✅ | ❌ | Non-technical users, search-driven analytics | From $25/user/mo |
| Power BI | Basic (DAX) | ✅ (Copilot) | ❌ | Microsoft ecosystem, low per-user cost | From $10/user/mo |
| Tableau | Thin | ✅ (Tableau AI) | ❌ | Visualization-heavy teams | From $75/user/mo |
| Lightdash | dbt metrics | ❌ | ✅ Git | dbt-native teams | From $800/mo |
| Sigma | None | ✅ | ❌ | Spreadsheet-comfortable users | Enterprise (contact sales) |
For a more detailed, side-by-side comparison, check out our self-service BI tools comparison matrix.
What is self-service analytics?
It shouldn't be a surprise to anyone that self-service in the analytics space is hard to define. Benn Stancil (Mode Founder) has a whole piece where he argues 'self service is a feeling' – which I largely agree with – and Stancil says that what self-service analytics is depends on how the org feels about self-serving data from their tools.
Do they trust it? Do they feel comfortable getting what they need, without emailing an analyst?
This, Stancil continues, depends on the context of the organization (do they trust the numbers in their data systems?), their data maturity (do they feel comfortable with their analytics tool?), the needs of business users (does the CEO set the tone for metrics consumption?)
So, yes, the organizational context matters when you're talking about self-service analytics. A self-service setup that works in one company might not be equivalent self-service in another.
But I think we can get more specific than 'Self-service is a feeling'. Instead, I'm going to invert the question and define self-service analytics by what it's not. Because I think this is more useful.
In a sentence, I think self-service can be thought of as a business outcome that successfully avoids a common organizational failed state. To put this more concretely, I think self-service analytics is a state where the business is sufficiently data-driven, but the data org does not look like an army of English-to-SQL translators.
Imagine this: You are a small company.
You realize you need a data analytics team, so you hire your first analyst and you use Power BI or Tableau, or some other BI analytics tools.
Your analyst churns out reports for management, and all is well for a few months. But eventually your analyst can't keep up with all the requests she's getting from end users, so you hire another. And another. And another. And then your company grows up, creates departments that report to different leaders, and each department hires its own analysts, and now you have an army of analysts in various parts of the company, all writing queries or tuning Excel spreadsheets, just trying to keep up with the business requests your company throws at them.
These analysts are mostly English-to-SQL translators or Excel jockeys.
They're all relatively junior. Some are senior, sure. But there's not much career progression for them overall. And many of them are suitably displeased with their jobs, and a reliable percentage of them churn out every six months or so. You keep hiring new analysts to keep up with business demand and grit your teeth at the management challenge of constantly churning employees.
This is the failed state.
(Note that in this scenario, your company is data-driven. This isn't always a thing! It's more common to be in a company that isn't data-driven, which doesn't have this problem, and will instead have a different set of problems and a different set of failed states. Anyway.)
Every question goes through an analyst
Business users can't get data without filing a request. The data team becomes an army of English-to-SQL translators.
- Analysts burn out on repetitive requests
- No reusable definitions – same metric, different answers
- Hiring more analysts doesn't scale
- Senior analysts leave – no career growth
Users explore governed data directly
The data team builds the foundation once. Business users get answers themselves – with the right guardrails.
- Metrics defined once, reused everywhere
- Business users self-serve follow-up questions
- Analysts focus on modeling, not ad-hoc queries
- Version-controlled, auditable definitions
This is the failed state that self-service analytics is supposed to solve. It is a failed state because it's rather painful to maintain an army of English-to-SQL translators. Ideally, you want a smaller group of data folks that can service a much larger number of data consumers. And the only way you can hit that scale is to have some form of 'self-service', that is, some way that business users can get the data they need, without going through an analyst on Slack or email.
In other words, self-service analytics is valuable as a goal because it increases the operating leverage of your data team. You can serve many more people with fewer analysts. This is an ideal business outcome.
Now: notice that I have not defined what features a self-service analytics platform should have in this context. Notice that I have not talked about tools, or processes, or even org structure. All of these depend on the nature of the company.
Instead, I'm describing self-service analytics by telling you what it is not – it is not this failed state where the company is data-driven, but they've gotten there by just throwing bodies at the problem, and have 100 data analysts spread across six departments writing 100-line SQL queries. Self-service, when seen through the lens of my inverted definition, is how far away you are from that failed state.
Of course, smart readers would recognize that this is simply another way of saying 'In a data-driven company with high demand for data, bad data organizations tend to self-service look the same, but working data organizations look very different from each other'. And indeed, data-driven companies with good self service capabilities all look very different. For instance, in one consumer software company I know, many people in the company's reporting structure are fluent with SQL, so they are able to solve their self-service problems with a combination of a SQL-oriented BI tool, a well-curated data warehouse, and one or two visualization tools. This would not work in a cosmetics company where the majority of their staff aren't SQL-savvy and prefer to have dashboards built for them. Self-service in the first company looks different from self-service in the second.
In other words, self-service analytics is most usefully described as a business outcome, a place that you get to through a combination of tools and processes, and org structure. And the way you get to it is by asking yourself, each step of the way: "Does this move bring us closer or further away from the failed state?"
Self-service analytics is a business outcome
Not a product feature. You get there through three pillars working together.
People
Culture and data literacy across the organization.
- Leadership sets the tone for data-driven decisions
- Business users trust the numbers in the system
- Data team focuses on modeling, not ad-hoc requests
Process
How metrics are defined, governed, and evolved.
- Centralized metric definitions with clear ownership
- Review workflows for new metrics and dashboards
- Usage monitoring to prune and improve
Tool
A BI platform that doesn't get in the way.
- Semantic layer for consistent, governed metrics
- Exploration UI accessible to non-technical users
- Version control and audit trail
↑ Each pillar reinforces the others. Fixing only one doesn't get you to self-service.
In such a scenario, the best thing a tool can do is to not get in your way. The best thing a Business Intelligence tool can do is to give you handles when you want to evolve your org away from the failed state.
Finding a self-service BI tool is the easier part. The truth is that business intelligence problems are socio-technical problems, and you usually have to fix some combination of people (read: culture) and process and tool , all at the same time.
But one problem at a time.
In this article, we'll go into what makes a good self-service BI tool, analyze the best tools in the market, and go into a few success case studies to help get a better picture of what success looks like, and how to achieve it with a combination of People, Process, and Tool.
How To Evaluate Self-Service Analytics Tools
Before going further... Over the years, we've received hundreds of RFPs (Requests for Proposal) from a wide range of companies, from Fortune 500 giants to Series A startups. We've compiled all their evaluation criteria into this template. Feel free to clone and customize it to suit your needs.
Not all self-service analytics platforms are created equal.
Some promise the world but deliver a steep learning curve; others are so user-friendly that you wonder if they're too simplistic. To truly empower users while maintaining data integrity, a self-service analytics tool needs to strike a delicate balance between functionality and ease of use.
Here's a closer look at the key features that make a BI tool self-serviceable:
- User-friendly interface & Ease of Use: The best self-service analytics tools are designed with the non-technical user in mind. A drag-and-drop interface, intuitive dashboards, and simple data visualization options are essential. These features lower the barrier to entry, allowing users with little to no technical background to explore data and generate insights.
- Customizable dashboards: Every business user has different needs, and a one-size-fits-all dashboard simply won't cut it. The ability to explore and customize dashboards allows users to focus on the metrics that matter most to them.
- Collaboration features: Insights are only valuable when shared. Collaboration features–the ability to easily share dashboards to Slack and emails, send alerts, share password-protected shareable links, or create embedded analytics dashboards –are essential. This helps cross-department teams work together, align on strategies, and make informed decisions based on the same set of data.
- Single source of truth and centralized logic: One of the biggest challenges in data-driven decision-making is making sure that everyone in the organization is working with the same definitions and metrics. A self-service analytics tool should allow you to centralize data logic and metrics ensuring that reports generated across different departments are accurate and consistent.
- Variety of visualization options: A robust self-service analytics tool should offer a wide range of visualization options, from basic charts and graphs to more complex visualizations like heat maps, scatter plots, and geographical maps.
- Data Governance and Granular Role Permissions: Sensitive data should be tightly protected and users only have access to the data they need. This helps maintain compliance with data protection regulations and ensures that the right people are making the right decisions with the right data.
- Version Control: When more people build metrics and dashboards, the BI reporting system can become this big chunk of spaghetti logic that nobody dares to touch. Dashboards break out of nowhere. Your self-service BI should allow you to define analytics and dashboard as code and govern them with Git version control.
- Usage Monitoring: A lesser-known but equally important feature of self-service BI tools is usage monitoring. This capability allows the data team to identify under-used dashboards, prune redundant reports, discover data champions, support struggling data novices, and share best practices, improving the overall data proficiency across the entire organization.
What are the best self-service analytics tools?
In the next sections, we'll explore the top self-service analytics tools: Holistics, Metabase, Looker, Thoughtspot, Power BI, Tableau, Lightdash, and Sigma. But if you don't have time to read further, here's a quick summary:
- Holistics and Looker are code-based, semantic-modeling self-service analytics tools. They're ideal for data teams who want everyone in the organization to explore data using curated, governed datasets.
- Metabase, Power BI, and Tableau are visualization-centric tools. They're best suited for businesses heavily invested in board reporting, where the demand for self-service exploration primarily comes from select power users and teams prioritizing polished reports and presentations.
- Thoughtspot and Sigma focus heavily on search-driven and spreadsheet-like analytics experiences. They cater to business users looking for an even simpler self-service experience.
Let's get to the details.
1. Holistics BI
Holistics is a self-service analytics platform that strongly focuses on data governance and centralization to keep metrics consistent across teams. It offers a wide variety of features designed for self-service analytics, governance, and customization.
Key Features
- Semantic modeling: With a code-based semantic layer approach, Holistics allows the data team to define data logic and metrics centrally, ensuring all teams use the same well-defined metrics and dimensions.
- Easy data exploration: Non-technical users can easily filter, sort, and drill down into data within an intuitive drag-and-drop interface. Common analytics functions like Percent of Total or Period-over-Period comparison are all 1-click functions, natively built-in.
- Robust variety of visualizations: Offers a wide range of visualization options, from basic charts to more advanced geographical maps.
- Dashboards as code: Allows users to build dashboards by arranging analytical blocks such as text, charts, and filters on a customizable canvas. Because everything is defined as code, users can also govern dashboards with Git version control and turn these analytics blocks into reusable components for future use.
- Embedded analytics and external analytics: Users can easily send reports to Slack and email, share data securely with password-protected shareable links, and embed dashboards into their own documents/applications.
- AI-assisted Data Exploration: Provides a natural-language interface to query data and create visualizations. AI-generated metrics can be stored, reused, and further extended by users.
Limitations
- No predictive analytics feature: At the moment, Holistics does not support predictive modeling. For instance, you can't deploy machine learning models to forecast propensity to buy based on your data in Holistics.
- User experience (UX): Holistics might seem rough around the edges for some users as the interface can feel less intuitive compared to other BI tools.
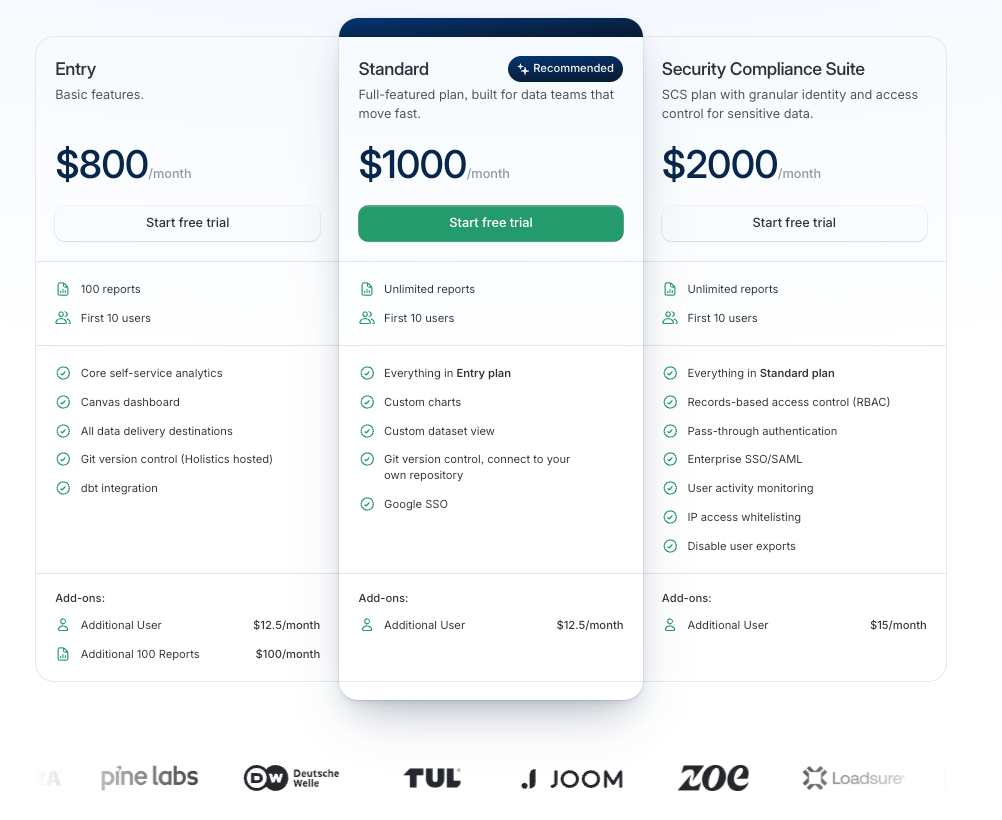
Pricing: Starts at $800/month. Most popular plan is Standard Plan offering core self-service analytics features, and Git version control.
For a more detailed, side-by-side comparison of the most popular self-service BI and analytics tools, check out this comparison matrix.
2. Metabase
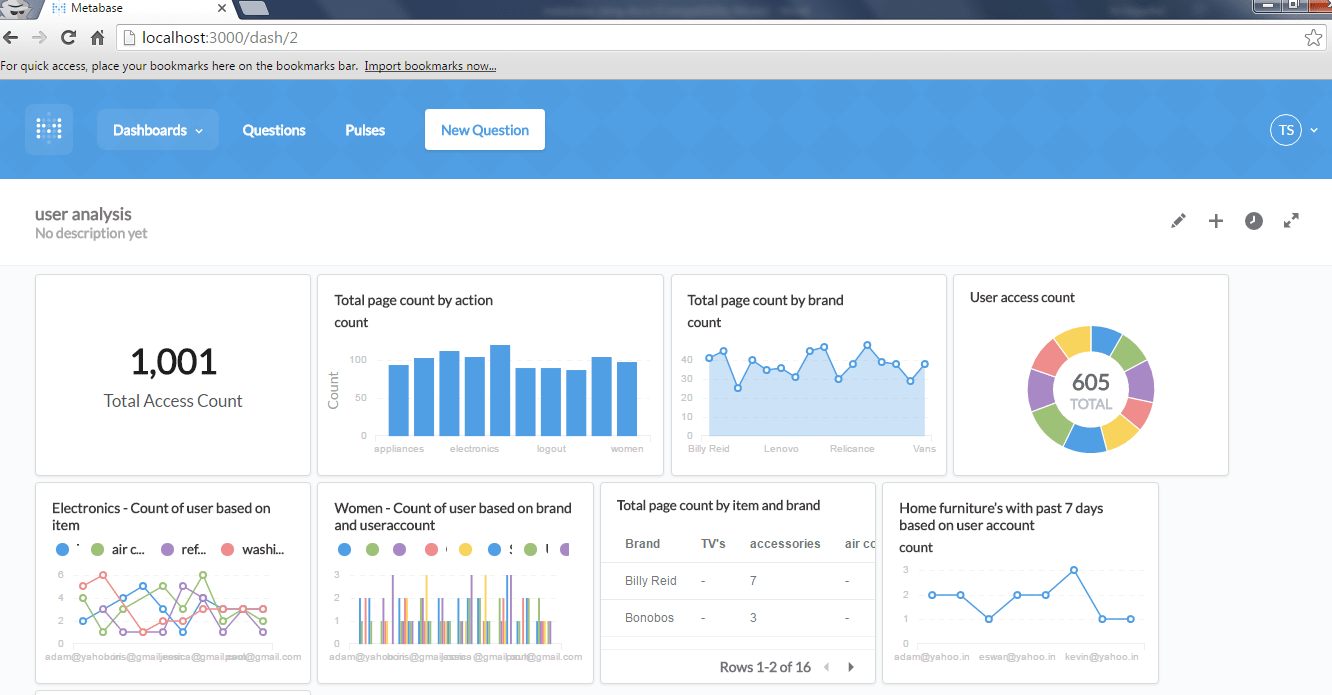
Metabase is an open-source business intelligence tool that helps users answer their data questions using different visualizations.
Key Features
- Ease of use: Metabase's point-and-click interface is designed for non-technical users, making data exploration straightforward without needing SQL.
- Simple query builder: For those with SQL skills, Metabase offers a simple query builder, allowing for deeper data analysis and custom queries.
- Open-source flexibility: As an open-source tool, Metabase offers significant flexibility for customization and integration, tailored to your organization's specific needs.
- Basic visualizations: Metabase covers the essentials with bar charts, line graphs, and more – sufficient for most business needs.
- Question feature: Metabase has this question feature that lets you answer your simple and daily data questions. In "Simple question" mode, you can filter, summarize, and visualize data. If you have a more complex question, you may choose "Custom questions" which gives you a powerful notebook-style editor to create more complex questions that require joins, multiple stages of filtering and aggregating, or custom columns.
Limitations
- Heavily dependent on MySQL for complex analysis: If your query is too complex for the question feature, you need to write your own MySQL script to get your desired results. This is not user-friendly for people with limited SQL knowledge.
- Performance at scale: It works well for smaller datasets but can struggle with performance when scaling up, particularly with complex queries.
- Security and governance: Being open-source, Metabase may require additional setup for enterprise-level security and governance, which could be a hurdle for some organizations.
- Lack of automated data mapping: Unlike its competitors that automatically do the data mapping between database tables and business logic once the data source is integrated, you need to do your data mapping manually in Metabase and this leads to less flexibility and lack of customization.
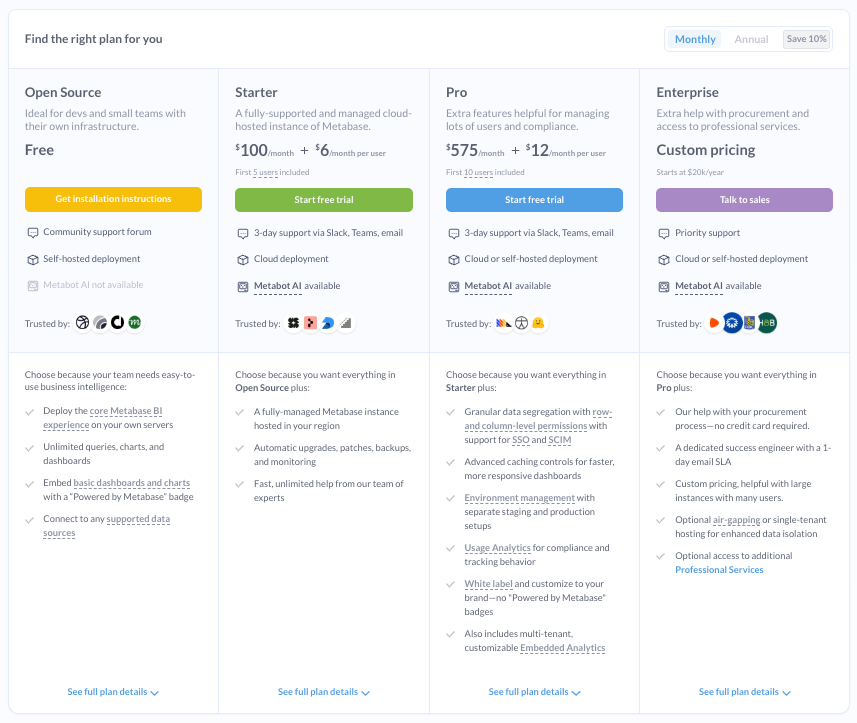
Pricing: Free plan available. Pro plan starts at $575/month, with $12/month per user.
Read more: Metabase Limitations and Its Competitors
3. Looker
Looker is an enterprise cloud-based self-service analytics tool owned by Google that sits on top of your SQL database and helps you model and visualize your data.
Key Features
- Strong data modelling capabilities: Looker has its own data modeling language called LookML. With LookML you can define your dimension, metrics, calculations, and data relationships in a SQL database.
- Predictive analytics: Looker offers various data tools that can help you get the most out of your analysis including ML models that can be deployed in your dataset. For instance, there are BigQuery ML models available within the Looker Marketplace including classification, regression and time series forecasting models.
- Flexible data exploration: Users can create custom reports and dashboards with a drag-and-drop interface, and drill down into data for detailed insights.
- Robust data integration: Looker connects directly to a wide range of databases and cloud warehouses, ensuring real-time data access without the need for extraction. It integrates well with tools like Slack and Google Sheets and other Google Products, making collaboration easier.
Limitations
- Complexity of LookML: LookML is powerful but has a steep learning curve, requiring technical expertise which may increase reliance on data engineers.
- High Cost: Positioned as a premium product, Looker's pricing may be a barrier for smaller organizations. Looker pricing is reported to start at $35K/year.
- Declining support quality post-Google acquisition: A commonly cited user pain point is that customer support responsiveness and overall support experience has declined over the year following the Google acquisition, with users often mentioning slower turnaround times and more fragmented troubleshooting/escalation paths.
Pricing: According to Vendr, a procurement platform, median buyer pays $89K per year for Looker.
Related reading: The best Looker alternatives for scaling data teams
4. ThoughtSpot
ThoughtSpot is well-known for its focus on AI-powered, search-driven analytics, making data exploration easy even for non-technical users. Here's why it stands out as a self-service analytics platform.
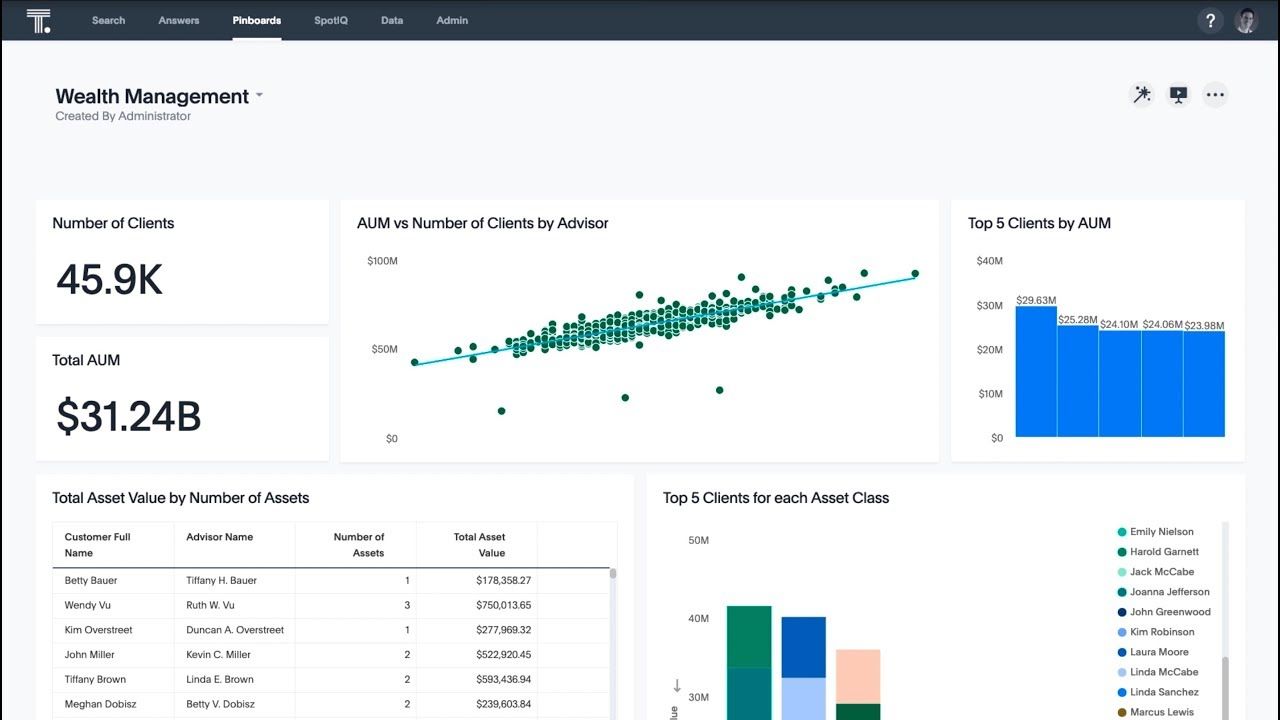 Thoughtspot demo
Key Features
- Search-driven analytics: Type in a question in plain English, and ThoughtSpot delivers instant insights. This makes it super accessible, even for those without a tech background.
- AI-powered insights: The platform uses AI to automatically highlight trends, anomalies, and hidden opportunities you might not have noticed.
- In-memory computing: This feature speeds up query processing, making it great for organizations that need fast decision-making.
Limitations
- Complex setup and maintenance: ThoughtSpot is easy for users but can be tricky to set up and maintain, especially in larger, complex environments.
- High cost: It's a premium product with pricing to match, which might be a barrier for smaller businesses.
- Limited advanced customization: ThoughtSpot may not offer the deep customization options for reports and dashboards that other BI tools do.
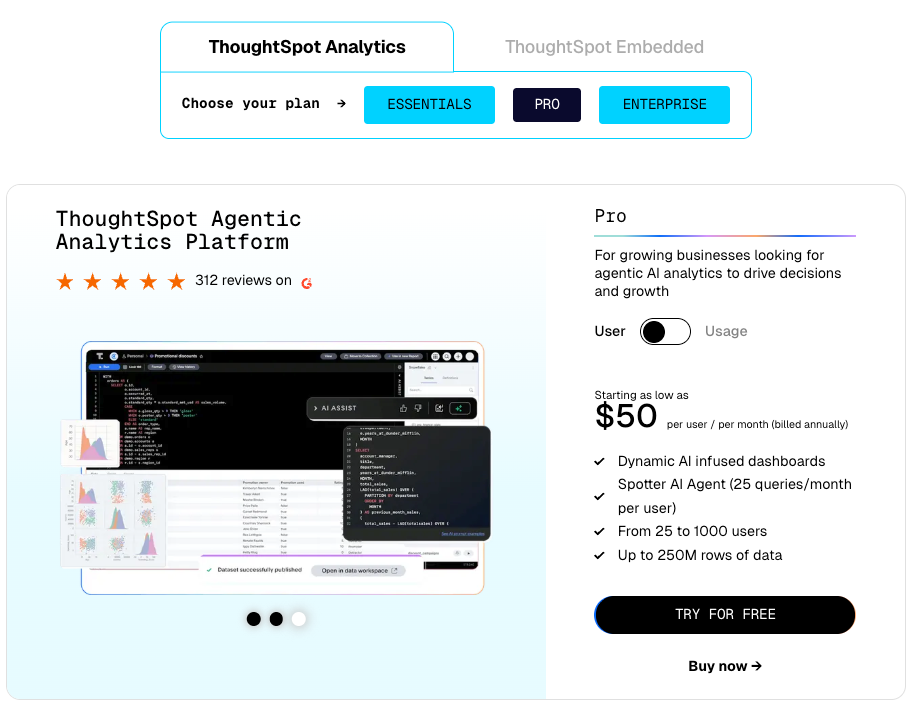
Pricing: Starts at $25 per user/month for Essential Plan.
5. Power BI
Power BI is Microsoft's analytics platform and the most widely used BI tool in the world. Its deep integration with the Microsoft ecosystem – Excel, Teams, SharePoint, Azure – makes it the default choice for organizations already running on Microsoft infrastructure.
Key Features
- Excel familiarity: Power BI's interface builds on concepts familiar to any Excel user. Pivot tables, calculated columns, and conditional formatting translate naturally, giving business users a shorter ramp-up time than most BI tools.
- Low per-user cost: At $10/user/month for Pro, Power BI has the lowest entry price of any major BI platform. This makes broad self-service rollouts financially viable in a way that $75–$115/user tools do not.
- Microsoft ecosystem integration: Native connectors to Azure, SQL Server, Dynamics 365, SharePoint, and Teams. Reports embed directly into the apps your organization already uses.
- Copilot AI: Power BI Copilot (requires Fabric capacity) generates DAX queries, summarizes reports, and answers natural-language questions grounded in your data model.
- Large community and resources: The largest BI community in the world, with extensive documentation, forums, and third-party training. Finding answers to Power BI problems is rarely difficult.
Limitations
- DAX complexity: DAX (Data Analysis Expressions) is Power BI's formula language. It is notoriously difficult to learn and debug. Business users who need anything beyond basic measures quickly hit a wall and need help from a DAX expert – which undermines the self-service promise.
- Governance challenges at scale: Power BI makes it easy for anyone to publish reports, but offers limited controls over who publishes what and where. Without disciplined workspace management, organizations end up with hundreds of ungoverned reports with conflicting metrics. There is no Git-based version control.
- Thin semantic layer: Power BI's semantic model (formerly "dataset") defines measures in DAX, but lacks the composable, multi-hop modeling capabilities of tools like Holistics (AQL) or Looker (LookML). Complex analytical patterns – period-over-period comparisons, nested aggregations, cross-grain ratios – often require workarounds.
- Fabric dependency for AI features: Copilot and other advanced AI features require Microsoft Fabric capacity (F2 tier or higher), which adds significant cost beyond the $10/user Pro license.
Pricing: Pro at $10/user/month. Premium Per User at $20/user/month. Fabric capacity (for Copilot and enterprise features) starts at ~$260/month for F2 tier.
6. Tableau
Tableau is a powerhouse in BI, known for its stellar data visualization and user-friendly design.
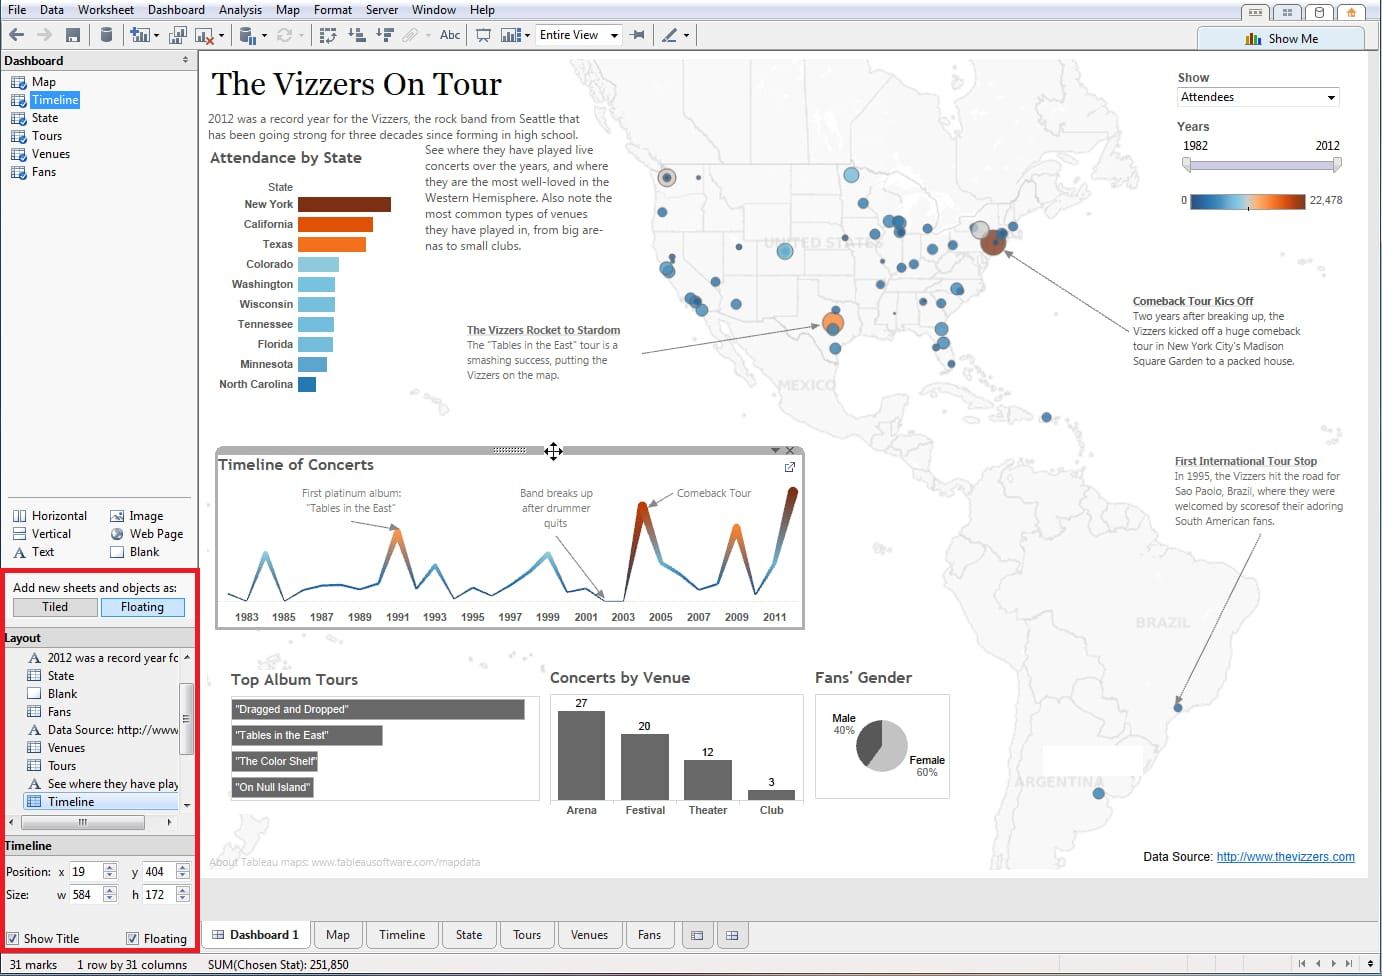 Tableau Public dashboards
Key Features
- Excellent data visualization: Tableau excels at creating a wide range of visualizations, from simple charts to complex interactive dashboards, all through an easy drag-and-drop interface.
- Real-Time Analytics: Tableau supports live data connections, ensuring your insights are always up-to-date, which is critical for agile decision-making.
- Collaboration features: Share your insights easily with Tableau Server or Tableau Online, fostering a data-driven culture across teams.
Limitations
- High learning curve for non-technical users: Unlike other BI tools such as Holistics or Looker that allow non-technical users to explore data and generate insights, the majority of Tableau users are experienced analysts or developers as setting up data models and generating insights sometimes need programming knowledge such as SQL, R, and Python. Business users can self-serve with Tableau, but it often involves a lot more training.
- Lacking built-in self-service BI features: Tableau may not have built-in support for certain features that are needed for self-service exploration, such as fiscal calendars or relative date range defaults on the date slider.
- Difficult to embed into organization's products: You can embed Tableau into external applications such as internal knowledge bases, CRMs, and blog posts. However, seamlessly integrating Tableau can be a real challenge for an organization from both financial and technical perspectives.
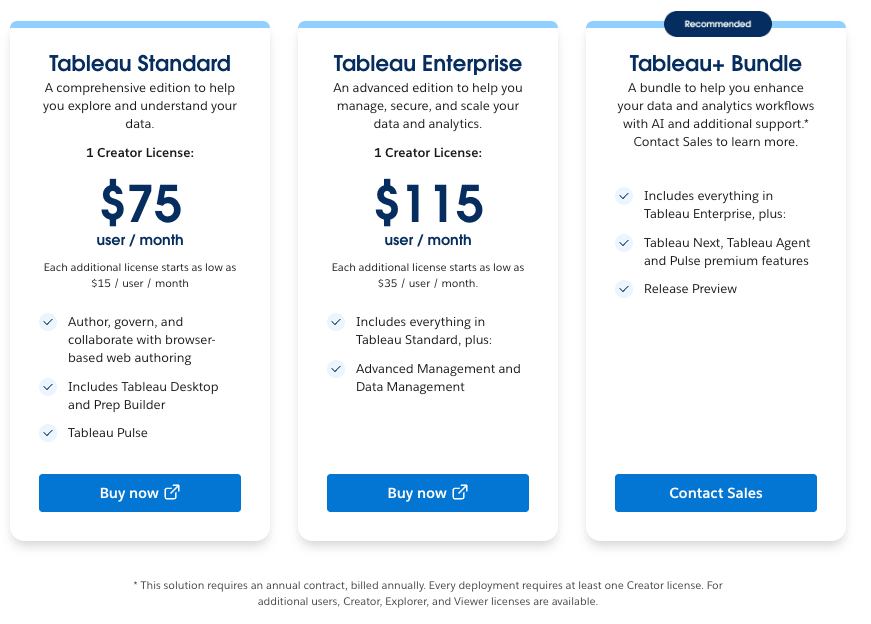
Pricing: Starts at $75 per user/month for a Creator license. In a self-service setup, if most (or all) users need Creator access, costs can balloon quickly as you scale.
Related articles: Best Embedded BI Tools: A Comparison Matrix
7. Lightdash
Lightdash is a fresh player in the BI scene, built specifically for teams using dbt (data build tool) for data transformations.
It's a developer-friendly platform that turns your existing dbt models into customizable dashboards and reports. Here's what makes Lightdash tick as a self-service BI:
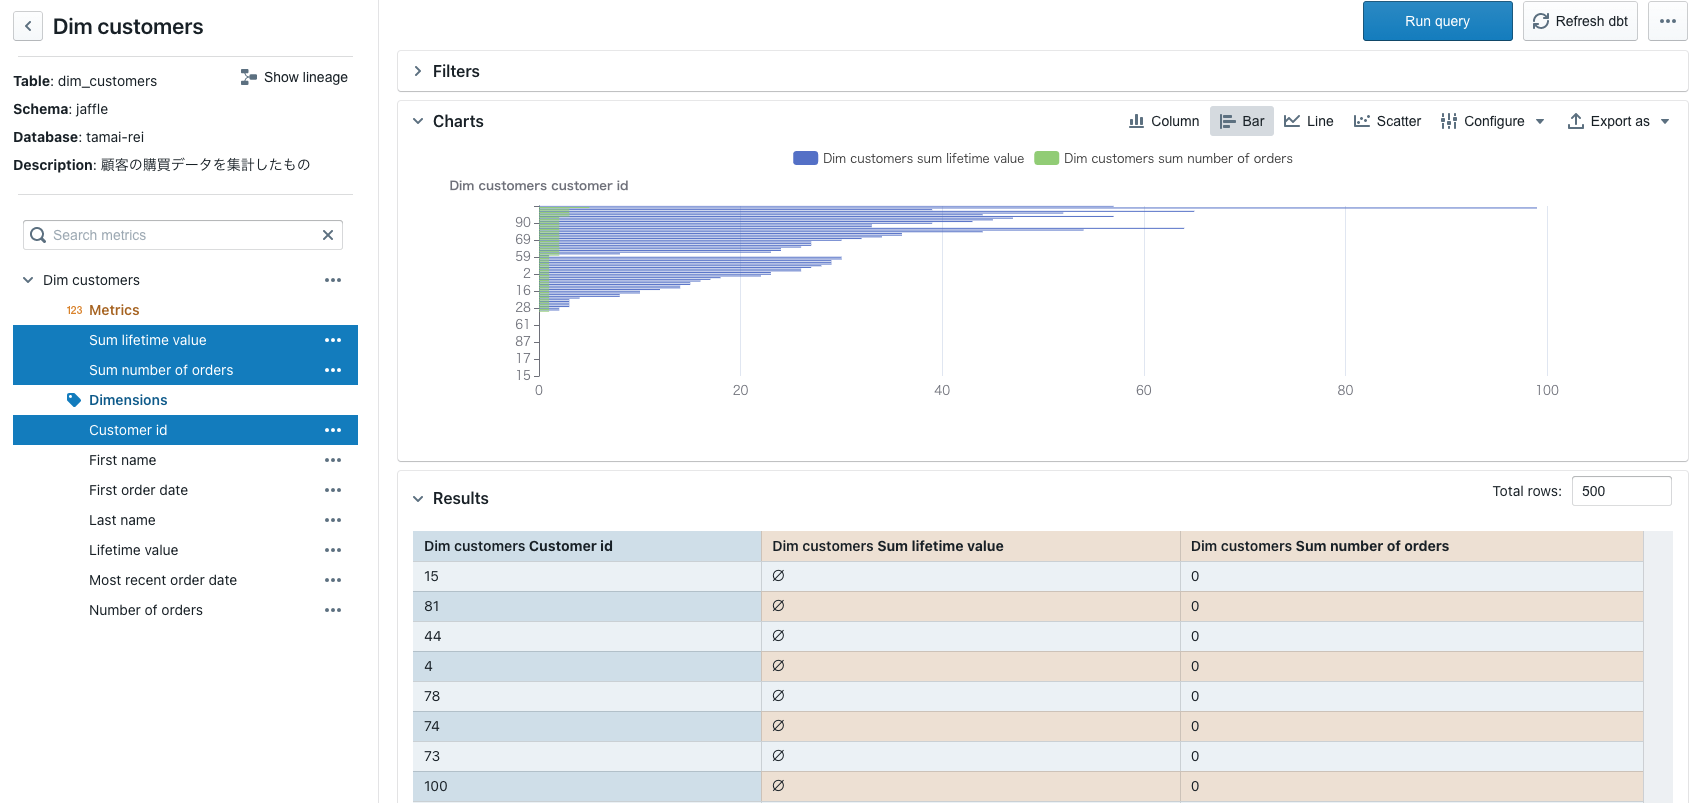 Lightdash Dashboard
Key Features
- Seamless dbt integration: Built with dbt users in mind, Lightdash integrates directly with your dbt models, avoiding duplicate efforts and keeping your data consistent.
- Developer-centric: Ideal for teams comfortable with SQL and coding, Lightdash lets developers craft and tweak dashboards straight from dbt models.
- Open-Source Flexibility: As an open-source tool, Lightdash gives you plenty of room to customize, integrate, and even contribute to its development.
Limitations
- Product immaturity: Since Lightdash is new to the market and still in early development, its visualization options are quite limited in comparison to other BI tools.
- Steep learning curve: Geared towards technical users, non-developers may struggle without extra training.
- Performance Issues: Still evolving, Lightdash may face performance hiccups with large datasets or complex visualizations.
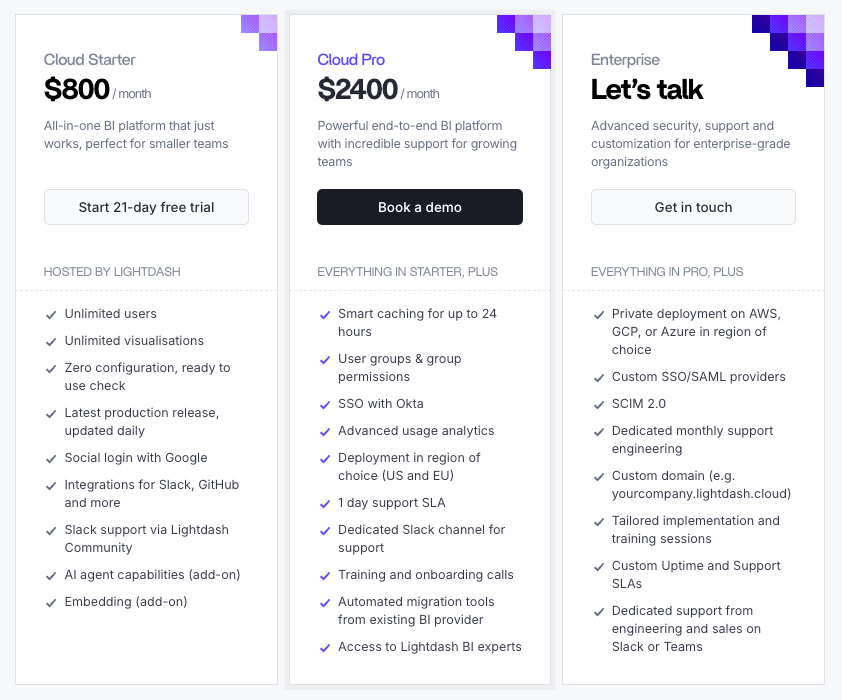
Pricing: Starts at $800/month.
Learn more: How Lightdash Could Be Better
8. Sigma Computing
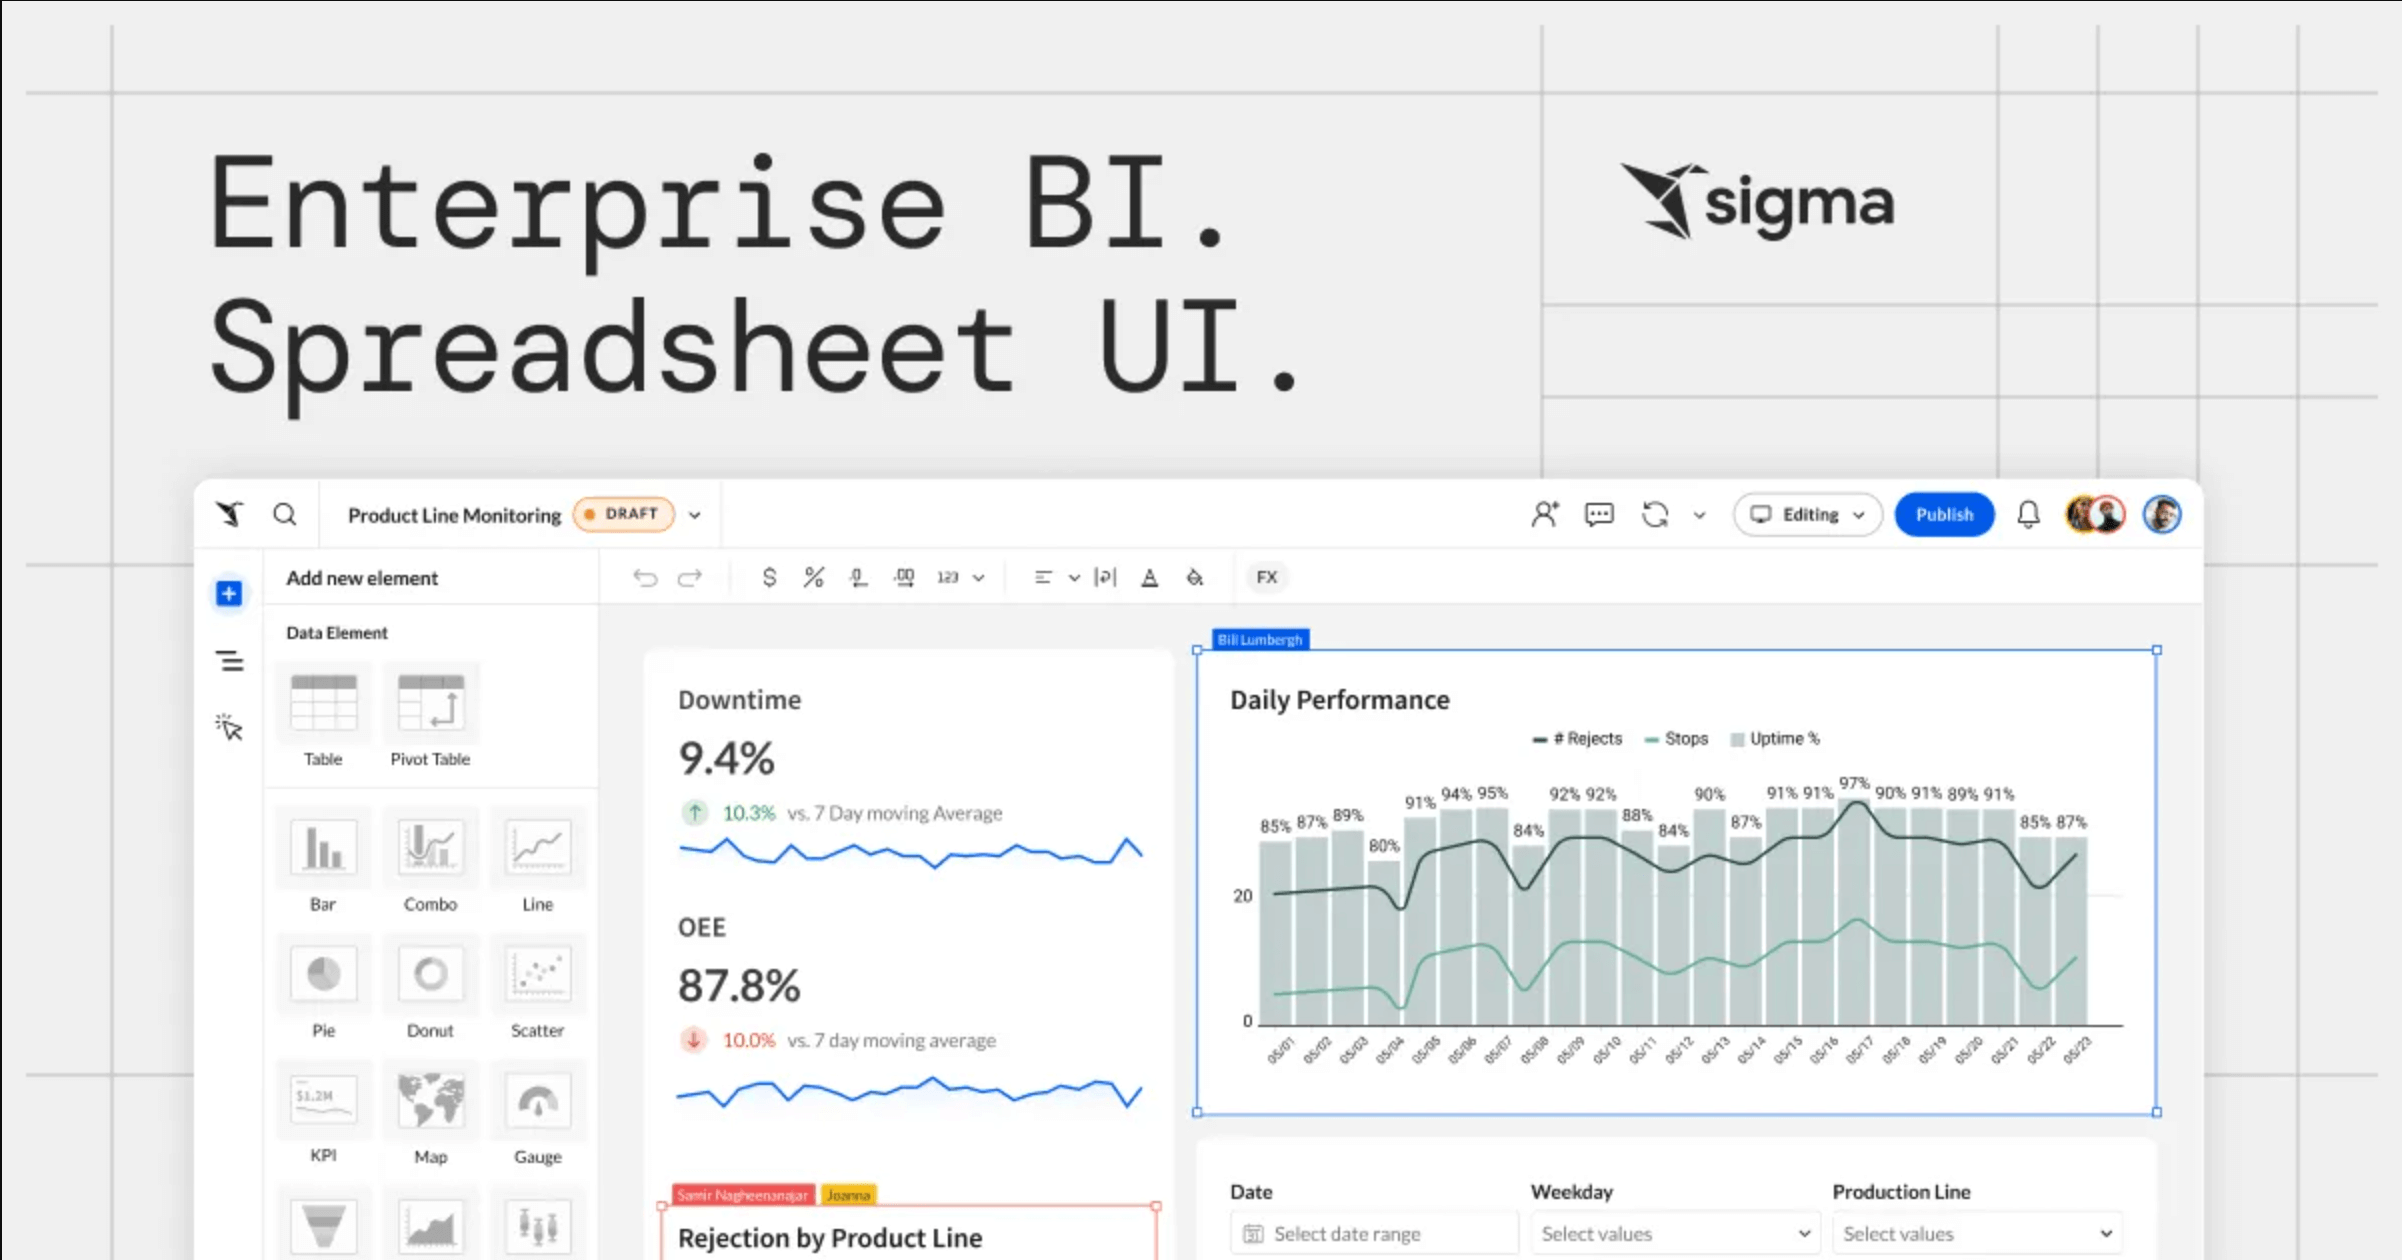
Sigma Computing is designed to make cloud data warehouses accessible to everyone, offering a spreadsheet-like interface that's intuitive for users without SQL skills.
Key Features
- Spreadsheet-Like Interface: Feels familiar to Excel users, making it easy to create reports and analyze data without needing to learn SQL.
- Collaboration and Governance: Multiple users can work on the same datasets, with robust data governance features to keep everything secure and compliant.
- Scalability: Built to grow with your data, Sigma handles increasing data volumes and complexity without a hitch.
Limitations
- Premium Pricing: Sigma is a premium product, which might be pricey for smaller businesses or those on a budget.
- Customization Limits: May not offer as much customization for specialized reports or niche visualizations as other tools.
Pricing: Sigma operates on a subscription model, with pricing scaling based on users and features. It's generally on the higher end, suited for mid-sized to large enterprises.
If you are evaluating tools, we maintain a fact-based self-service BI tools comparison matrix covering semantic layers, exploration interfaces, governance, and pricing.
According to Vendr, median buyers pays $60,500 per year for Sisense, based on data from 112 purchases.
How AI Is Changing Self-Service Analytics
The promise of self-service analytics has always been the same: let business users get the data they need without going through an analyst. For two decades, the industry tried to deliver on that promise with drag-and-drop chart builders, dashboard templates, and point-and-click query interfaces. These tools helped, but they never fully solved the problem. Business users still hit walls when they needed to ask a follow-up question the dashboard wasn't designed for.
AI – specifically natural language querying – is changing the interface. Instead of learning how to navigate a BI tool, business users can now type a question in plain English and get an answer. This is a genuine step-change in accessibility. Tools like Holistics AI, ThoughtSpot Spotter, and Power BI Copilot are leading this shift.
But AI also makes self-service analytics harder without governance, not easier. Here's why:
The semantic layer is the AI differentiator. When a business user asks "show me revenue by region," the AI needs to know what "revenue" means in your organization. Is it gross revenue? Net revenue? ARR? Without a centralized semantic layer that defines these terms once, the AI guesses – and different users get different answers to the same question. The tools with the strongest semantic foundations (Holistics, Looker) produce the most reliable AI-generated answers. Tools without one (Metabase, raw ChatGPT) produce plausible-looking answers that may be silently wrong.
AI scales both insight and error. In a traditional self-service setup, a wrong metric definition affects one dashboard. With AI-powered self-service, a wrong definition (or no definition at all) affects every natural-language question that touches that metric. AI amplifies whatever foundation it sits on – governed or ungoverned.
The new self-service stack. The most effective self-service analytics setups in 2026 combine three layers: a governed semantic layer (the foundation), AI-powered natural-language querying (the interface), and version-controlled analytics-as-code (the governance). This is the architecture that tools like Holistics are built around – and it's why AI analytics platforms with semantic depth are pulling ahead of tools that bolted AI onto report-centric architectures.
For a deep comparison of how 13 AI analytics platforms stack up on semantic depth, governance, and reliability, see our AI Analytics Platforms guide.
Frequently Asked Questions
What is self-service analytics?
Self-service analytics is a business outcome where non-technical users can access, explore, and analyze data without depending on an analyst for every question. It increases the operating leverage of the data team – you can serve many more people with fewer analysts. The way you get there is through a combination of tools (a BI platform with governed data access), processes (metric definitions, data quality checks), and culture (trust in the numbers).
What are the benefits of self-service analytics?
The primary benefit is operational leverage: a smaller data team can serve a much larger number of business users. Secondary benefits include faster time-to-insight (no waiting for an analyst to queue your request), better data literacy across the organization, more consistent decision-making when everyone works from the same governed metrics, and reduced analyst burnout from repetitive ad-hoc requests.
What is the best self-service analytics tool?
It depends on your constraints. For governed self-service with a semantic layer and version control, Holistics and Looker are the strongest options. For organizations in the Microsoft ecosystem on a budget, Power BI offers the lowest per-user cost. For non-technical users who want search-driven analytics, ThoughtSpot has the best natural-language interface. For teams already using dbt, Lightdash integrates directly with your existing models.
Is Power BI a self-service analytics tool?
Yes – Power BI is designed for self-service analytics and is the most widely used BI tool in the world. Its Excel-familiar interface and low per-user cost ($10/month for Pro) make broad rollouts feasible. The main limitation is governance at scale: DAX is difficult for business users to learn, and without Git-based version control or a rich semantic layer, organizations often end up with hundreds of ungoverned reports with conflicting metric definitions.
What does Gartner say about self-service analytics?
Gartner has consistently positioned self-service analytics as a critical capability in their Magic Quadrant for Analytics and Business Intelligence Platforms. They emphasize that successful self-service requires a balance between user autonomy and IT governance – what Gartner calls "governed self-service." Their research shows that organizations achieve the best outcomes when business users can explore data freely within guardrails set by the data team, rather than having unrestricted access or being fully dependent on analysts.

Data Engineer turned Product; writes SQL for a living.