The Better Lightdash
If you want a BI tool that is architecturally similar to Looker, but more affordable and well-integrated with dbt, go for Lightdash.
If you want a BI tool that is architecturally similar to Looker, but more affordable, well-integrated with dbt, and mature in functionalities, go for Holistics.
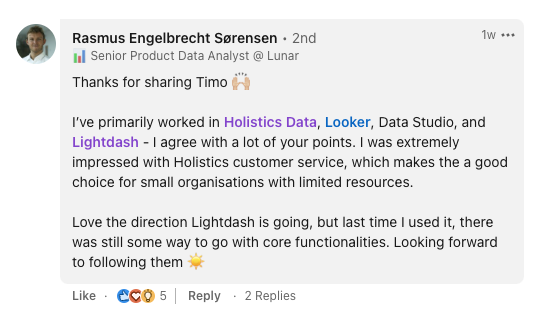
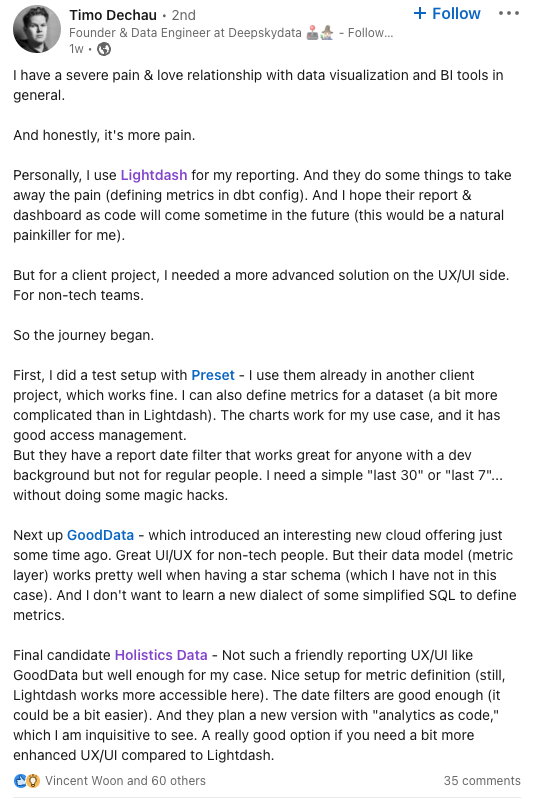
Don't just take our word for it - here's what the analytics community said


How Holistics Work?
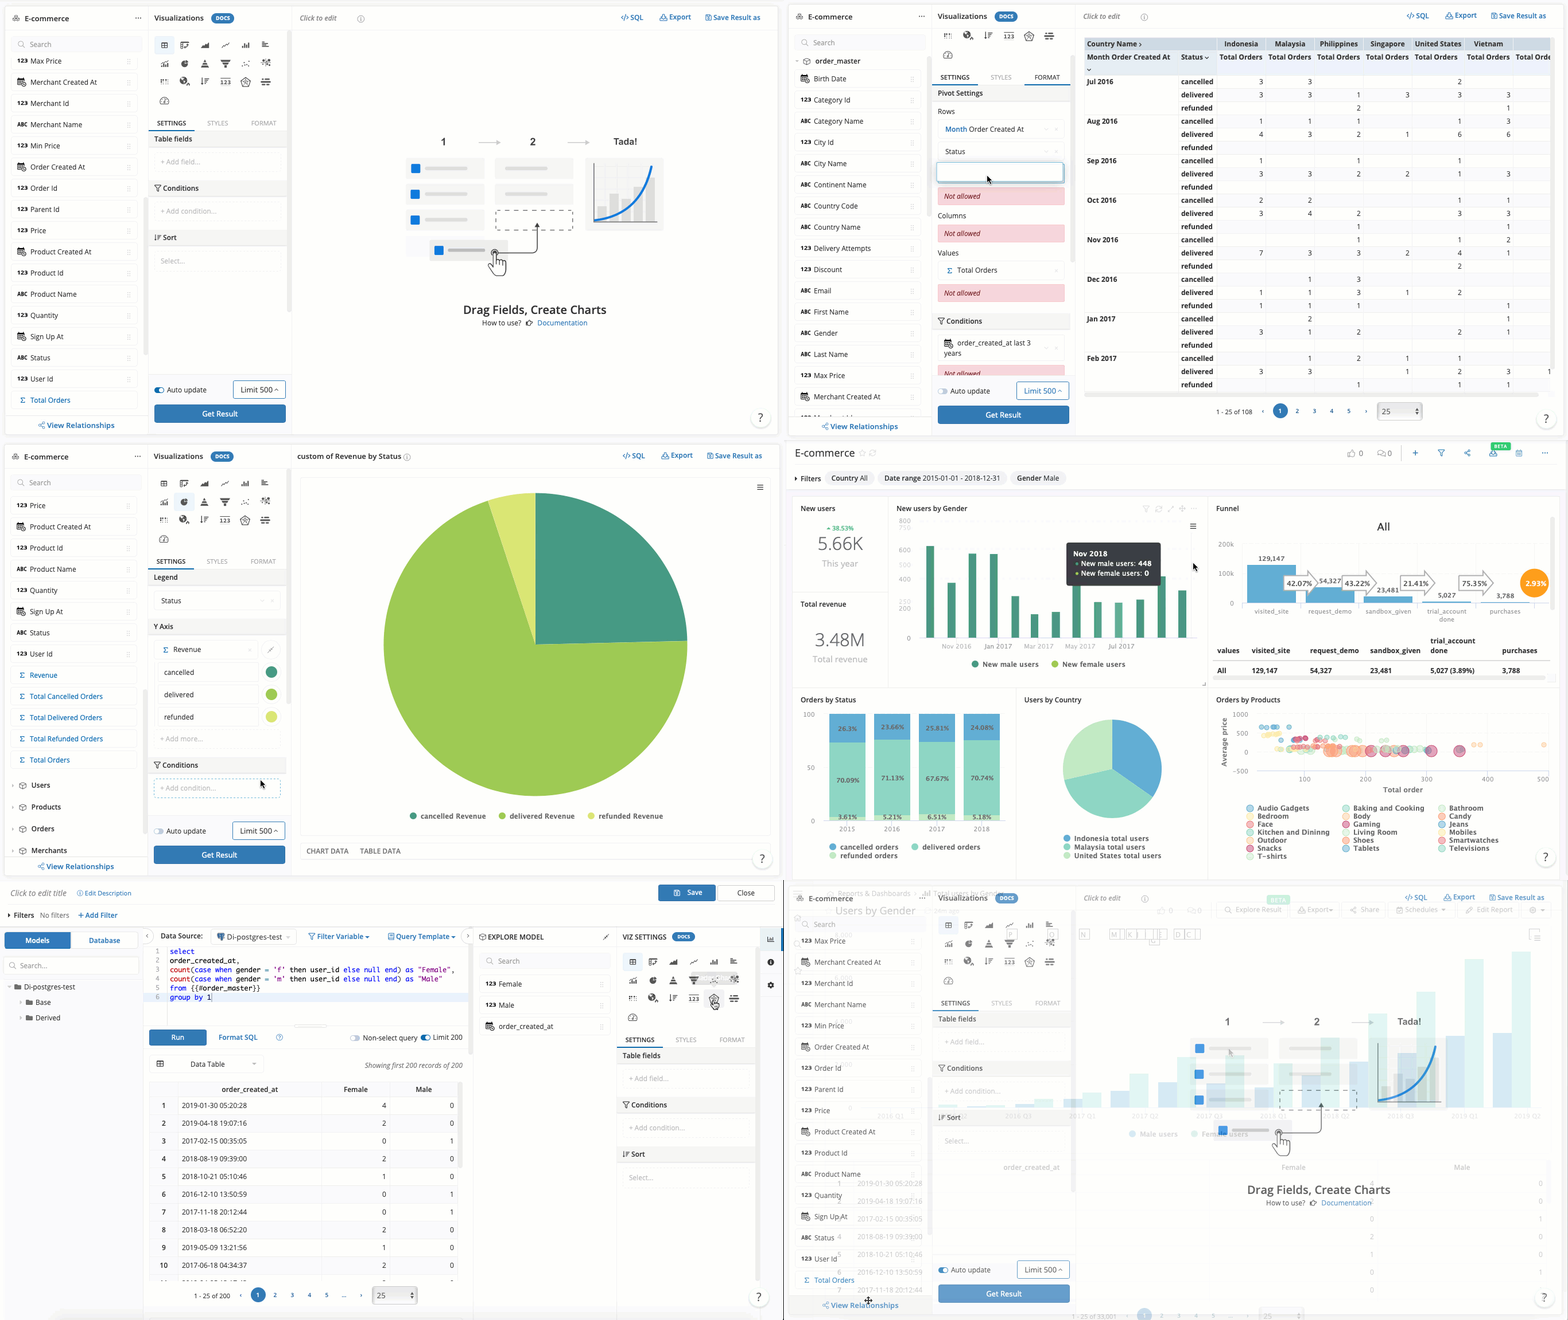
With Holistics, analysts define and maintain metrics definition in a central semantic layer. These metrics are exposed to business users in simple drag-and-drop interface. This allows everyone to analyze and explore data on their own without relying on data analysts.

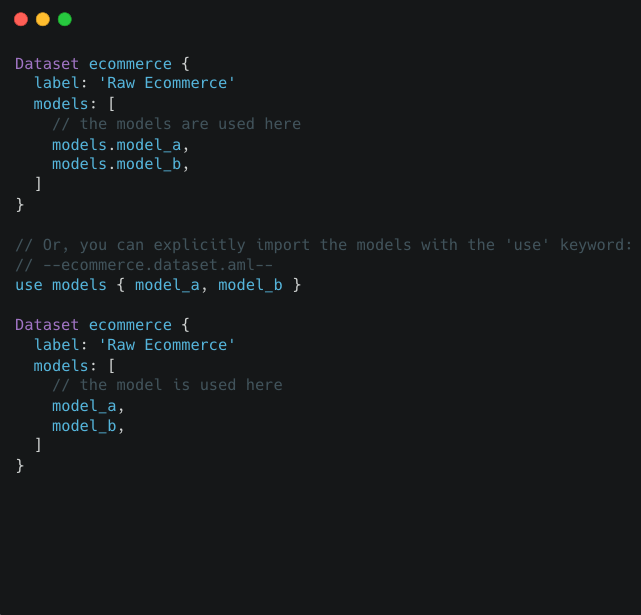
At the heart of Holistics is AMQL (Analytics Model & Query Language). AMQL enables analysts to define reusable analytics logic using code, an experience familiar to most developers. Your entire analytics pipeline can be serialized into code and checked into Git version control.

Holistics’ key functionalities include:
- Semantic Modeling Layer: Analysts define dimensions and measures of business logic in a central semantic layer. These logic can be reused in multiple places. Because logic is defined as code, analysts can use their favorite IDE to do "analytics programming".
- dbt integration: Holistics integrate deeply with dbt, allowing metadata from dbt to be surfaced to BI layer.
- Git Version Control: Through Git version controls: pull requests, protected branches, and merging into masters. Know who changes what when.
Self-Service Analytics layer: Analysts prepare curated datasets and share them with non-technical users for self-service exploration. Because analytic logic is carefully maintained and curated, business users can feel trusted with the data.
Some of Holistics’ self-service functionalities are:
- Native Period-over-Period Comparison.
- Custom Charts and a wide variety of visualization options.
- Cross-Filtering and Drill-through.
- Custom Alerts.
- Embedded Analytics and White Labeling.
- Custom Alerts and Push Notifications.
- Sharing reports via Slack, Emails, Shareable Links.
- API available.
Lightdash vs Holistics: Side-by-Side Comparison
| Aspect | Lightdash | Holistics |
|---|---|---|
| General | ||
| High-level Approach | Take a similar approach: 1. Analysts define reusable metrics using code (DSL) and check in to Git version control. 2. Business users to explore data with simple drag-and-drop interfaces. | |
| Deployment | Cloud-hosted or self-hosted | Cloud hosted |
| Compliance | Not Available. | GDPR; SOC2 Type II; |
| Modeling Layer | ||
| Central Modeling Layer to define Business Logic | Yes, plain YML. | Yes. With AMQL |
| GUI to model data | No. Only code-based interface. | Yes. Dual interface (both code-based and GUI-based). |
| Developer Experience | ||
| Code-based approach | Yes (YML) | Yes (AML) |
| Version Control with Git | Yes | Yes |
| API | No | Yes |
| Reporting & Visualization | ||
| Self-service Exploration | Yes | Yes |
| Visualizations | Limited Visualization | Rich visualization |
| Custom Charts | No | Yes |
| Native Date Comparison | No | Native support with Period-over-Period Comparison |
| Embededed Analytics | No | Yes |
| Sharing Reports Via Slack | No | Yes |
| Pivot Table | Yes | More advanced, with subgroup calculation |
What's happening in the BI world?
Join 30k+ people to get insights from BI practitioners around the globe. In your inbox. Every week. Learn more
No spam, ever. We respect your email privacy. Unsubscribe anytime.
