10 Best Semantic Layers for AI & BI: A Complete 2026 Guide
The best semantic layer tools for AI and BI in 2026, compared: BI-native, standalone, and warehouse-native. Learn what a semantic layer is, how the tools differ, and how to evaluate them beyond the demo – including what the semantic ceiling and semantic leakage mean for AI analytics and embedded analytics.

Key takeaways
- A semantic layer is the governed definition of your metrics, dimensions, and logic that sits between the warehouse and every consumer – dashboards, APIs, embedded analytics, and now AI agents.
- In 2026 the deciding factor is expressiveness, not whether a tool has "a semantic layer." The range of questions a layer can answer natively – its semantic ceiling – is the ceiling of your self-service and your AI analytics.
- Whatever the layer can't express leaks into derived tables, dashboard formulas, and raw SQL – where AI reintroduces the exact drift the layer was meant to remove.
- Tools fall into three architectures: BI-native (Holistics, Looker, Power BI, ThoughtSpot), standalone/headless (dbt Semantic Layer, Cube, AtScale), and warehouse-native (Snowflake, Databricks).
- For teams that want a governed semantic layer tied directly to AI and embedded analytics, Holistics is the strongest overall choice – a code-defined, high-expressiveness layer that the same platform serves to dashboards, embedded apps, and AI agents, and that stays open over an API.
TL;DR: Don't evaluate the AI chat box – evaluate the layer underneath it. Test each tool with your hardest real question (a cohort + period-comparison + cross-grain ratio in one breath). Whatever it can't answer natively is what your data team pays for over the next five years.
Every BI vendor in 2026 demos the same AI chat. "Show revenue by region." "Top 10 products by sales." A look-up question on a single fact table will impress any modern LLM, on any platform. It says almost nothing about whether the underlying system can answer the questions your business asks day to day.
The demo trap
"Chat to dashboard" shows the LLM's ability. It does not prove the analytics system.
Simple metric plus dimension combinations. Any LLM with a schema gets this.
"Of customers who signed up in January, what was 30-day conversion vs. April's cohort, and how does ARPU compare for the two groups?"
Four operators stacked into one breath.
The real differentiator is the semantic layer underneath, and not all semantic layers are equal. The differences show up the moment you move past demos and into the daily reality of nested aggregations, period-over-period comparisons, cross-grain ratios, and multi-step calculations, the questions that actually fill the analyst queue.
This guide covers the full landscape of semantic layer tools in 2026: standalone, BI-native, and warehouse-native. We'll explain what separates a primitive configuration layer from a programmable one, introduce the concepts of the semantic ceiling and semantic leakage, and help you decide which architecture fits your team.
If you're specifically evaluating BI tools with semantic layers, see our fact-based BI comparison with evaluation matrix.
What Is a Semantic Layer?
A semantic layer is a centralized definition of business metrics, dimensions, and logic that sits between the data warehouse and every downstream consumer: dashboards, AI agents, APIs, notebooks, and embedded analytics.
Instead of writing "monthly revenue" logic in five different SQL queries, you define it once in the semantic layer and use it consistently everywhere. A data catalog is a dictionary: it tells you what words exist, customer, subscription, churn. The semantic layer is the grammar. It encodes how definitions combine, which metrics are canonical, and how "revenue by quarter" is supposed to work across every dashboard, report, and now, every AI prompt.
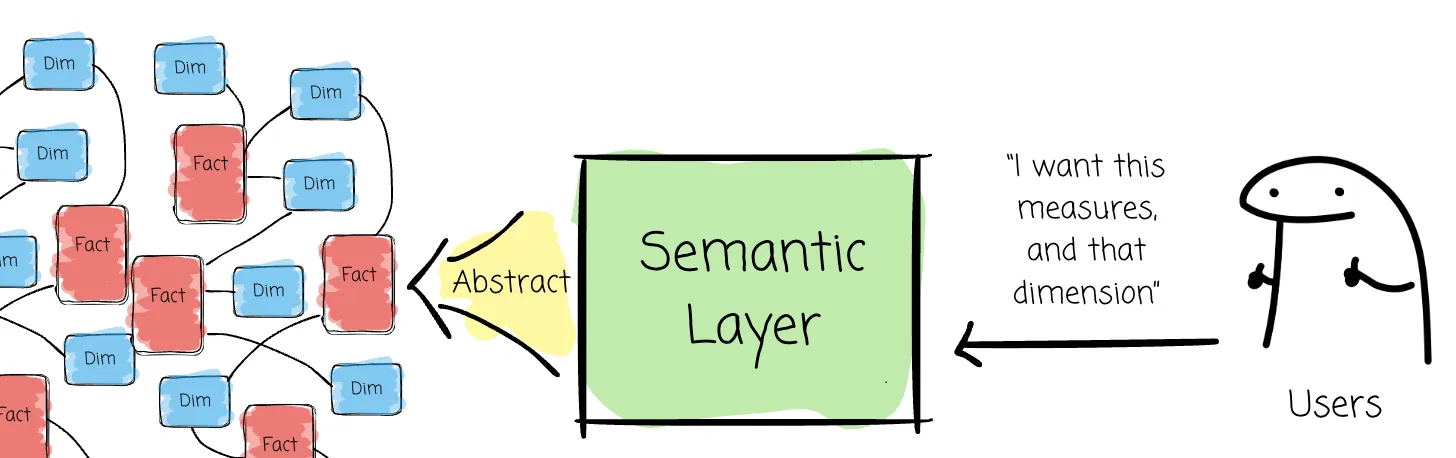 The semantic layer sits between the warehouse and every consumer: dashboards, AI, APIs. Source: vutr.substack.com
Why semantic layers matter more in 2026
Semantic layers are having their second renaissance, not because analysts suddenly became more principled, but because AI made the cost of ambiguity impossible to ignore.
This is not a new conviction for us. We have been advocating for this layer for six years, starting with our Analytics Setup Guidebook in 2020. Back then, we described the analyst as a "data translator" who keeps the mapping between business logic and data logic in their head. That works for a small team, but it does not scale. If every question depends on Daniel the analyst remembering which table stores closed deals, which column means payment received, and which filter defines a valid booking, self-service is just a promise.
The argument in the guidebook was that this mapping knowledge has to move out of an analyst's head and into an explicit modeling layer. Business users should be able to work with business concepts, while the layer handles the translation into correct data logic. That is the root of self-service analytics: not letting everyone write SQL, but giving everyone a governed interface to the same definitions, relationships, and calculations.
The semantic layer sits between the warehouse and every consumer: dashboards, AI, APIs. Source: vutr.substack.com
We extended the same argument in a 2023 dbt Singapore meetup talk on the ideal semantic layer. The talk started from metrics-centric thinking: metrics should be first-class objects that compose, parameterize, and travel across dimensions at query time. The AI implication was already clear. If an LLM has to generate raw SQL over raw tables, it has to guess. If it can express intent against a semantic layer, the hard parts, joins, grains, metric definitions, and governance, stay deterministic.
LLMs are impressive, but left alone they are probabilistic guessers. They autocomplete intent, infer joins, hallucinate filters. That's fine for flashy demos but disastrous for any serious decision-making.
A mature semantic layer turns AI from a guesser into a deterministic partner. Instead of asking an LLM to reason over raw tables, you give it the grammar, metrics, dimensions, relationships, that are already agreed upon. The model is grounded in it.
Without a semantic layer, AI must generate SQL from scratch, guessing which tables to query, how to join them, and how to calculate the metric. "Revenue" might mean gross revenue in one query and net revenue in the next. Two users asking the same question get different numbers.
With a semantic layer, AI expresses intent. The layer compiles it to correct SQL deterministically. Same definitions everyone in the company uses. No guessing, no drift.
The actual mechanism
The semantic layer is what makes AI analytics reliable.
If the AI gets user intent right, it hands that intent to the semantic layer. The layer deterministically generates accurate SQL, without guessing or drift.
LLM owns intent and execution.
- Joins, GROUP BYs, and CTEs invented per query
- Metric logic reinvented every prompt
- No deterministic guarantee the SQL is correct
- No governance because access control sits outside the prompt
LLM owns intent. Semantic layer owns execution.
- Metrics, dimensions, and joins defined once
- SQL is generated deterministically
- Same definitions everyone in the company uses
- Access control enforced at the semantic layer
The semantic layer and embedded analytics
The stakes rise again when analytics is embedded in a product. Every customer-facing dashboard and in-app metric has to agree, across tenants, with row-level security enforced so each customer sees only their own data. Re-implementing metric logic per embedded surface is where definitions fork and trust breaks – the same semantic leakage, now in front of customers.
A BI-native semantic layer that also powers embedding lets you define a metric and its access rules once and serve them to internal dashboards, customer-facing embeds, and AI agents from one governed model (see how this works in Holistics embedded analytics). That single-definition guarantee is why teams shipping both internal BI and embedded analytics lean toward a governed, BI-native layer rather than bolting a headless layer onto a separate embedding tool and running two governance surfaces.
Not All Semantic Layers Are Equal
This is the thesis that should change how you evaluate tools.
Every tool in this guide has something it calls a "semantic layer." But the range of questions each layer can answer natively varies widely, and that difference compounds as AI becomes the primary analytics interface.
The semantic ceiling
Most conventional semantic layers handle the OLAP basics: lookup, slice-and-dice, filter/group, top-N. These resonate with end users familiar with pivot tables, and this is what most vendors show in demos.
But there is a non-trivial class of questions that conventional semantic layers cannot answer natively:
| Question type | Example | Why it's hard |
|---|---|---|
| Nested aggregation | "Average order value by category, then rank categories" | Requires aggregating, then aggregating the result; most layers only support one level |
| Period-over-period | "Revenue this month vs. last month, by region" | Requires comparing the same metric at two different time grains |
| Cross-grain ratios | "Each region's % of total revenue" | The denominator (total) is at a different granularity than the numerator (per-region) |
| Running totals | "Cumulative revenue over time" | Requires window-function equivalents that live inside the semantic layer |
| Multi-step calculations | "Filter → aggregate → compare → rank in one metric" | Requires chaining operations that most layers only support as separate steps |
| Cohort analysis | "Of Jan signups, how many bought within 7 days?" | Requires parameterized time windows with cross-model joins |
The picture
Your semantic layer sets your self-service ceiling.
↑ Above the ceiling · pulls an analyst back in
Nested aggregation
"Average revenue per active user."
Period over period
"MTD vs. previous MTD" or "YoY %."
Cohort analysis
"Of Jan signups, how many bought within 7 days?"
Cross-grain ratios
"Conversion rate" across different grains.
Cross-model metrics
"Revenue spanning orders plus products."
Parameterized metrics
"N-day conversion" for N = 7, 14, 30, 90.
Where conventional SQL semantic layers stop.
Every question above this line is a ticket back to the data team, and the same ceiling your AI agent inherits the moment you ship it.
Look-up
"Revenue last month."
Slice and dice
"Revenue by region by month."
Filter / group
"Active users by tier in APAC."
Top-N
"Top 10 products by sales."
↓ Below the ceiling · handled by any semantic layer
When a semantic layer hits this ceiling, three things happen:
- Data teams build derived tables, pre-computing metrics in dbt or LookML derived tables and bypassing the semantic layer entirely
- End users run calculations at the dashboard level, using table calculations, spreadsheet exports, and dashboard formulas instead of the governed layer
- Requests go back to analysts, the question becomes a ticket in the analyst queue, undoing the promise of self-service
The ceiling of your semantic layer is the ceiling of your AI analytics. If the layer cannot express a question natively, AI either falls back to raw SQL (reintroducing hallucination risks) or simply returns nothing.
Semantic leakage
Semantic leakage is what happens when business logic escapes the governed semantic layer into ungoverned locations:
- Upstream into dbt models, derived tables, and near-duplicate transformations
- Downstream into dashboard formulas, table calculations, spreadsheets, and custom report code
- Side-channel into analyst memory and ad-hoc Slack clarifications
A name for the failure mode
Semantic leakage is the moment the answer leaves governed definitions.
YES →
NO → leaks back to raw SQL
Semantic leakageOver time, metric definitions fork across these locations. Trust erodes. The semantic layer loses its authority as the single source of truth.
After the leak
Vendors hide it. Data teams carry it.
Workbook-level calculations
Excel-like formulas written inside the workbook, often sold as easy to promote later.
Cost: formulas get re-authored as semantic metrics, while analysts ship variants of the same definition.
Pre-built derived tables
The team writes one denormalized model per question shape because the semantic layer cannot.
Cost: warehouse tables proliferate, and refactors must traverse almost-identical logic.
Ad-hoc SQL / SQL Runner
An analyst writes raw SQL for anything the semantic model cannot express natively.
Cost: lineage disappears, each query reinvents the metric, and drift accumulates.
In the age of AI, semantic leakage compounds the problem. As end users ask increasingly sophisticated questions through AI interfaces, they will inevitably hit questions that the semantic layer can't answer natively. When that happens, AI falls back to text-to-SQL from scratch, reintroducing the hallucination and inconsistency the semantic layer was supposed to eliminate.
The consequence
AI lowers the cost of asking. Your data team pays it back.
When semantic leakage meets AI
Stakeholders ask
? ? ? ? ? ? ?
AI writes SQL
∅ Where peer review used to be
No reviewer in the loop
Ships to dashboard
"Who confirms any of this is correct?"
Without a semantic layer that AI itself uses, there is no verifier. Confident-sounding answers ship with no audit trail.
Semantic leakage doesn't show up in the PoC. The vendor's job is to make sure it doesn't. The data team's job, for the next five years, is to keep it invisible to the rest of the org. This is why evaluating the expressiveness of the semantic layer matters more than any demo.
For a detailed visual walkthrough of the ceiling and leakage concepts, see Not all semantic layers are equal.
Semantic Layer Comparison Matrix (2026)
The prose profiles below go deeper, but here is the landscape at a glance. "Ceiling" is how far the layer answers complex questions (nested aggregation, period-over-period, cross-grain ratios, cohorts) natively, before logic leaks into workarounds.
| Tool | Category | Metric expressiveness (ceiling) | Governance | AI readiness | Interoperability | Best for |
|---|---|---|---|---|---|---|
| Holistics | BI-native | Highest – AQL composes nested aggregation, period-over-period, cross-grain, cohorts natively | Code-defined, typed, versioned in Git | Strong – AI + MCP server generate governed AQL, not raw SQL | Open API / MCP; serves dashboards, embedded, agents | Teams wanting a governed BI-native layer tied directly to AI and embedded analytics |
| Looker | BI-native | High for standard cases; cumulative/nested often need derived tables | Strong (LookML, Git) | Moderate – depends on downstream generating LookML | LookML mostly consumed inside Looker/Studio | Existing Google Cloud / Looker shops |
| dbt Semantic Layer | Standalone (headless) | Moderate – YAML metrics; complex composition gets verbose | Inherits dbt project governance | Moderate – API exists; expressiveness caps AI | Broad – API to many BI tools | Stacks already centered on dbt transformations |
| Cube | Standalone (headless) | Moderate – multi-step often needs pre-computation | Config-based | Moderate – serves agents via API | Broad – REST/GraphQL/SQL APIs | Serving one definition to many apps/tools |
| AtScale | Standalone (headless) | Moderate, OLAP-oriented | Enterprise-grade | Limited | Connects to existing BI (Tableau, Excel, Power BI) | Heavy existing BI investment, no migration |
| Power BI | BI-native | High within DAX/VertiPaq patterns; proprietary engine | Strong in MS ecosystem | Moderate (Copilot within MS stack) | Best inside Microsoft ecosystem | Microsoft-first organizations |
| ThoughtSpot | BI-native | Standard OLAP; constrained for multi-step composition | Good | Search-native; ceiling caps hard questions | Consumed mainly in ThoughtSpot | Search-driven business-user analytics |
| Snowflake / Databricks | Warehouse-native | Early-stage, limited expressiveness | Warehouse-level | Emerging | Any connected tool can consume | Minimal disruption, warehouse-centric teams |
We build Holistics, so treat its placement as a disclosed view, not a neutral ranking – and judge every tool here on the same test: can it answer your hardest question natively, keep one definition of every metric, and let any tool or agent query it?
Three Types of Semantic Layer Tools
The semantic layer market divides into three architectural philosophies. Each makes different trade-offs between integration breadth, user experience, and expressiveness.
1. BI-native semantic layers (bundled)
These tools integrate the semantic layer directly into the BI platform. The model and the consumption surface live in the same system.
Holistics takes a programmable approach with AML (Analytics Modeling Language) for defining models and AQL (Analytics Query Language) for composable, multi-step metric calculations. AQL operates at a higher abstraction than SQL, handling nested aggregations, period-over-period, cross-grain ratios, and running totals natively. Because it's typed, invalid field references and semantic issues are caught as you type, not at runtime. The core shift is from table-centric modeling to metrics-centric thinking: metrics are first-class objects that can reference other metrics, be parameterized, and compose into arbitrary depth.
The semantic layer, how it is built
AQL + AML. Two real languages, not config files.
Holistics's semantic layer is built on two purpose-built languages: a composable query language and a native development language, both compiled down to standard SQL.
AQL · Analytics Query Language
Metrics as first-class objects. Named, stored, modified, and combined like variables.
metric arpu = revenue / usersHigh-level analytics functions. Time intelligence, cohort, nested aggregation, and level-of-detail are primitives.
revenue | relative_period(year, -1)Composable operations. Pipe chains build unlimited complexity from simple primitives.
revenue | where(...) | by(country) | of_all()AML · Analytics Modeling Language
Programmable constructs. The same building blocks programmers use to keep code DRY, without YAML config or Jinja-templated SQL.
Type-safe IDE with a live feedback loop. Errors are caught as you type. The same type system guardrails AI from misreading the semantic layer.
Native dialect SQL · the shared substrate
One semantic layer. One compiled SQL output. Every warehouse.
Snowflake · BigQuery · Postgres · Redshift · Databricks. Analysts can still read, debug, and explain the generated SQL.
Looker pioneered code-based semantic modeling with LookML. SQL-based metric definitions give explicit control over generated SQL, with "symmetric aggregates" handling many-to-many joins. The language is YAML-based, powerful for standard use cases, but lacks the functions, variables, and code reuse of a full programming language. Complex metrics like cumulative sums often require building manual derived tables.
Power BI uses DAX (Data Analysis Expressions) inside a tabular semantic model. DAX is powerful for certain patterns (time intelligence, calculated columns) but operates within a proprietary in-memory engine. The model is GUI-configured in Power BI Desktop, and complex logic often requires understanding both DAX and the VertiPaq engine's behavior.
ThoughtSpot centers on search-driven analytics with TML (ThoughtSpot Modeling Language) for semantic definitions. Its strength is the search interface for business users; its semantic layer handles standard OLAP patterns well but is more constrained for multi-step metric composition.
For a side-by-side evaluation of these tools across metric expressiveness, governance, AI readiness, and self-service, see the BI Tools with Semantic Layers comparison matrix.
2. Standalone semantic layers (headless)
Standalone layers sit between the warehouse and multiple downstream consumers, exposed primarily through APIs.
dbt Semantic Layer (MetricFlow) extends dbt's transformation layer into a full metric definition system. You define metrics in YAML alongside your dbt models, and MetricFlow compiles them to SQL at query time. Because dbt already owns the transformation layer in many stacks, the semantic layer inherits that context. The trade-off: metric definitions live in YAML configuration files, which can become verbose for complex composition. MetricFlow supports derived metrics (metrics referencing other metrics) but the language lacks the programming constructs (functions, variables, modules) of a full-blown modeling language.
Cube provides a headless semantic layer with its own query engine. Its "Views" feature lets teams compose virtual tables from multiple data sources, exposed through REST, GraphQL, and SQL APIs. Cube's strength is integration breadth: it serves BI tools, notebooks, applications, and AI agents from one definition layer. The modeling language (YAML or JavaScript) supports basic metric composition but, like dbt, complex multi-step calculations often require pre-computation.
AtScale takes an enterprise-oriented approach, providing a virtual semantic layer that connects to existing BI tools (Tableau, Power BI, Excel) without requiring migration. It translates OLAP-style queries into optimized warehouse SQL. Best suited for organizations with heavy existing BI investments that want consistent definitions without replacing their tools.
3. Warehouse-native semantic layers
A newer category where the warehouse itself provides semantic modeling capabilities.
Databricks Unity Catalog and Snowflake are both building semantic capabilities into their platforms. The promise: define metrics once at the warehouse level, consume them in any connected tool. The reality in 2026: these are early-stage, with limited expressiveness compared to dedicated semantic layer tools.
The trade-off with warehouse-native layers is that they optimize for breadth (any connected tool can consume the definitions) at the cost of depth (the semantic modeling language is typically simpler than what dedicated tools offer).
How to Choose: The Decision Framework
Choosing a semantic layer architecture comes down to three questions:
Where do you want meaning to live?
Choose BI-native when your team primarily consumes analytics through dashboards and self-service exploration. The semantic layer and the consumption surface are the same system, so definitions stay current because people interact with them daily. Feedback loops are tighter: business users can inspect how AI arrived at a number, validate filters, and refine definitions in place.
Choose standalone when consistency across many tools matters more than UI-level collaboration. If your stack includes multiple BI tools, notebooks, reverse ETL, and embedded analytics, a standalone layer ensures "revenue" means the same thing everywhere.
Choose warehouse-native when you have heavy existing BI investments and want consistent definitions without replacing tools or adding middleware. Best for organizations optimizing for minimal disruption.
How complex are your metrics?
This is where the semantic ceiling becomes the deciding factor.
If your business mostly asks lookup and slice-and-dice questions, any semantic layer handles it. If your analysts spend time building derived tables for nested aggregations, period-over-period, or cross-grain ratios, you need a layer that handles these natively. Otherwise, you're just moving the bottleneck.
Test with your own questions, not the vendor's demo. Ask: "Of customers who signed up in January, what was 30-day conversion vs. April's cohort, and how does ARPU compare for the two groups?" That single question stacks cohort analysis, period comparison, nested aggregation, and a cross-grain ratio. If the tool can't answer it natively, everything above that ceiling leaks.
How important is AI readiness?
The expressiveness of the semantic layer directly determines how many questions AI can answer reliably. A layer that handles only lookup queries means AI falls back to raw text-to-SQL for anything harder, reintroducing the exact problems the semantic layer was supposed to solve.
The tools with the highest ceilings, where AI can compose governed metrics for complex questions without escaping to raw SQL, provide the most reliable AI analytics experience. This is where programmable semantic layers differ most from conventional ones.
How to Implement a Semantic Layer: A 30-Day Pilot
You don't roll out a semantic layer by modeling the whole warehouse. You prove it against the questions your business actually asks.
- Collect 15–30 real questions. Pull them from the analyst queue, recent dashboards, and the Slack threads where people ask "why is this number different?" Include the hard ones – cohorts, period-over-period, cross-grain ratios.
- Model the core entities and metrics behind them. Define the base metrics once (revenue, active users, conversion) and the relationships between models, rather than one table per question shape.
- Answer every question through the layer – no workarounds. If a question forces a derived table, a dashboard formula, or raw SQL, mark it: that's your semantic ceiling showing, and it's exactly what will leak later.
- Point AI at the same layer. Have your AI interface express intent against the governed metrics and confirm it composes them instead of falling back to text-to-SQL.
- Wire up governance. Row-level security, permissions, and versioning at the layer – not in each dashboard.
- Measure the ceiling, then decide. Count how many of your 30 questions were answered natively vs. needed a workaround. That ratio, not the demo, is your real evaluation.
The Metrics-Centric Paradigm Shift
Underneath the tool comparisons, there's a deeper shift happening in how data teams think about analytics.
Traditional data modeling is table-centric: you define models, reuse them, and track dependencies between models using a lineage graph. Tables are the atomic unit of work. When you want a new metric, you create new tables, joining, filtering, aggregating, until you arrive at the number. A slight variation (7-day activation instead of same-day activation) requires duplicating most of the pipeline with minor logic changes.
The alternative is metrics-centric thinking. Instead of treating tables as the source of truth and metrics as derived outputs, you elevate metrics to first-class, independent concepts. Define a base metric once. Layer additional logic on top: filters, time windows, moving averages. When the base metric changes, all derived metrics update automatically.
This shift is like moving from Assembly to C, or from C to Python. You go up the abstraction levels, getting closer to the business logic and leaving the technical plumbing behind.
What composable means
Composable metrics, in code.
One AML snippet can express cross-model metrics, multi-step composition, and a nested top-N without CTE sprawl, derived tables, or string-interpolated SQL.
metric revenue =
  sum(order_items, products.price * order_items.quantity)
metric user_count = users | count(users.id)

metric top_countries = top(3, countries.name, by: user_count)
metric total_revenue = top_countries | sum(revenue)
metric avg_revenue = top_countries | avg(revenue)

explore {
  dimensions { continent: countries.continent_name }
  measures { top_countries, avg_revenue, total_revenue }
}
revenue reaches across order_items and products through relationships. Defined once, reused everywhere.
total_revenue and avg_revenue compose revenue and top_countries. No copy-paste, no drift.
"Top countries by user count, then revenue within those" becomes one named metric pipeline.
The practical benefits:
- Less mental effort to write, you focus on the aggregation you want, not on which tables to join
- More intuitive,
num_same_day_activationis defined as "number of users where activate_date is sign_up_date." Sounds like everyday English. - Minimizes duplication, metric variants reference a shared base instead of copying logic
- Greater flexibility, dimensions can be combined at query time instead of development time
For the full worked example of metrics-centric modeling (including parameterized metrics and the same-day activation case study), see How Would an Ideal Semantic Layer Look Like?.
How to Evaluate Semantic Layer Tools
Don't test the chat box. Test the layer underneath. Here are the questions that separate a PoC that will age well from one that will cost your team for years:
Receipts
Every question above the ceiling needs a native primitive.
Each primitive below is one less place where semantic leakage can happen.
Nested aggregation
group() | aggregate() | aggregate()
"Average monthly signups across years." Aggregate of aggregate, one governed metric.
Period over period
previous() · relative_period()
period_to_date()
Same period last year, YoY %, MTD vs. previous MTD. Reusable everywhere.
Cohort analysis
with_relationships()
filter(cohort_dim)
Segment a population by signup window, then track behavior at the cohort grain.
Cross-grain and cross-model
relationship()
with_relationships()
Numerator and denominator at different grains. Auto-composed across models.
Parameterized metrics
metric args · dataset fields
N-day conversion for N = 7, 14, 30, 90. One metric, query-time parameter.
Multi-step composition
pipe | · metric-of-metric
Compose group, filter, and aggregate as named steps. No monolithic CTE.
Test the layer, not the demo:
- Can it express "average order value by region, then rank regions by that average"? (nested aggregation)
- Can it calculate "month-over-month revenue growth by segment" without a pre-built derived table? (period-over-period)
- Can it answer "each region's share of total revenue" in a single metric? (cross-grain ratio)
- Can it define "N-day activation rate" once and parameterize N? (composable, parameterized metrics)
Find the leakage:
- When the semantic layer can't answer a question natively, where does the logic go?
- How many derived tables / dbt models exist solely to work around semantic layer limitations?
- How many table calculations or workbook-level formulas duplicate metric logic?
- Can a new analyst find all metric definitions in one place, or must they check dashboards, transformations, and Slack threads?
- If AI generates a wrong answer, can a business user trace it to a governed definition, or is it raw SQL?
For a tool-by-tool comparison across these dimensions, see the BI Tools with Semantic Layers evaluation matrix.
Is Holistics a semantic layer?
You might have already heard this argument somewhere: a "true" semantic layer is a standalone, headless component that serves metrics to external tools and agents (think dbt Semantic Layer or Cube), and anything else, Holistics included, is just "a BI tool with built-in modeling", category-adjacent, and using it in place of a real semantic layer creates integration debt.
We build Holistics, so treat this as a disclosed answer rather than a neutral one. We don't think it's a fair argument. The critique defines "semantic layer" as "headless metrics API", then rules that everything not built that way is not the real thing. That is circular. A semantic layer should be defined by what it does: a centralized, governed definition of metrics and dimensions that guarantees the same question returns the same number everywhere. Headless delivery is one architecture for that job, not the definition of the job. By the same logic Looker's LookML would not qualify, and no one seriously argues that.
And the definition also goes both ways. A headless layer cannot answer a business question or govern an experience on its own. We can't talk about semantic layer, without talking about the consumption endpoint of the semantic layer. It is metric plumbing that still needs a downstream BI tool, notebook, or app to produce anything a person sees. Bolt one onto a separate BI tool and you now run two governance surfaces and inherit the gap between what the layer can express and what the downstream tool can actually render. That seam is exactly where semantic leakage lives.
The more important thing is that Holistics semantic layer is open.
Your Holistics semantic layer is queryable over an API. You can request a dataset's dimensions and metrics from outside Holistics and get results back as JSON, so the same governed metrics behind your dashboards can power Jupyter and Python, terminal scripts, internal services, and automation workflows. If a tool can make an HTTP request, it can query your dataset. That delivers the properties the critique reserves for "true" semantic layers:
- No vendor lock-in. Metric definitions are accessible via API, not trapped inside a proprietary UI. You invest in the semantic layer knowing it stays portable.
- Single source of truth. Define a metric once and query it everywhere, instead of rebuilding the same logic in each tool and watching the numbers drift ("why is revenue different here?").
- Portable and expressive at once. The JSON you get back is computed by AQL, so external consumers receive nested aggregations and cross-grain ratios, not a lowest-common-denominator subset. Holistics also exposes an MCP Server, so AI agents query the governed layer and generate AQL rather than raw SQL.
So the "trapped in a proprietary tool" and "does not serve external tools or agents" claims do not hold.
So, is Holistics a semantic layer? Yes. It is a governed, code-defined layer of composable metrics that is expressive enough to answer questions most layers push into workarounds, and open enough to serve those metrics over an API to whatever consumes them. The more useful question is not "which category is this", but "does this layer answer my hardest questions natively, keep one definition of every metric, and let any tool or agent query it".
Judge Holistics, and every tool in this guide, on that.

Data Engineer turned Product; writes SQL for a living.