33 Best Open Source Data Analytics Tools for Your Entire Stack
The open source tools for every layer of an analytics stack (ingestion, storage, modeling, semantic layer, BI and notebooks), with licenses, GitHub activity and 3 reference stacks by team stage.
A team can now run every part of its analytics stack on open source software, from the scripts that pull data out of Stripe and Postgres to the dashboards the sales team opens on Monday morning, and plenty of teams do exactly that. The hard part is rarely finding a good tool, because almost every layer has two or three mature projects with active communities. The hard part is knowing which layers you need right now, which ones can wait a year, and which "open source" licenses come with conditions you only discover when legal reads them.
This guide walks through the open source data analytics tools we think are worth evaluating in 2026, organized by the job each one does in the stack. For each layer you'll find the main options, their licenses and GitHub activity, and the signal that usually tells a team the layer is worth adding. After the layers, three reference stacks show how the pieces fit together for a solo analyst, a growing data team and a team whose analysts work with coding agents.
The quick answer: a sensible starting stack
Most small teams can start with five open source tools and add the rest only when a specific problem shows up:
- dlt (or Airbyte) loads data from your apps and databases.
- PostgreSQL or DuckDB stores the data and runs the queries.
- dbt Core turns raw tables into clean, tested models.
- Metabase or Evidence puts the results in front of people as dashboards or reports.
- Jupyter or marimo handles the one-off analysis that doesn't belong in a dashboard.
Orchestration, a semantic layer, a distributed query engine and a data catalog all have strong open source options, and each section below explains the signal that tells you it's time to add one.
The open source analytics stack at a glance
An analytics stack has eight layers, although few teams need all eight at once. The table lists the job of each layer, the open source tools we'd shortlist and the point at which the layer usually becomes worth the maintenance it adds.
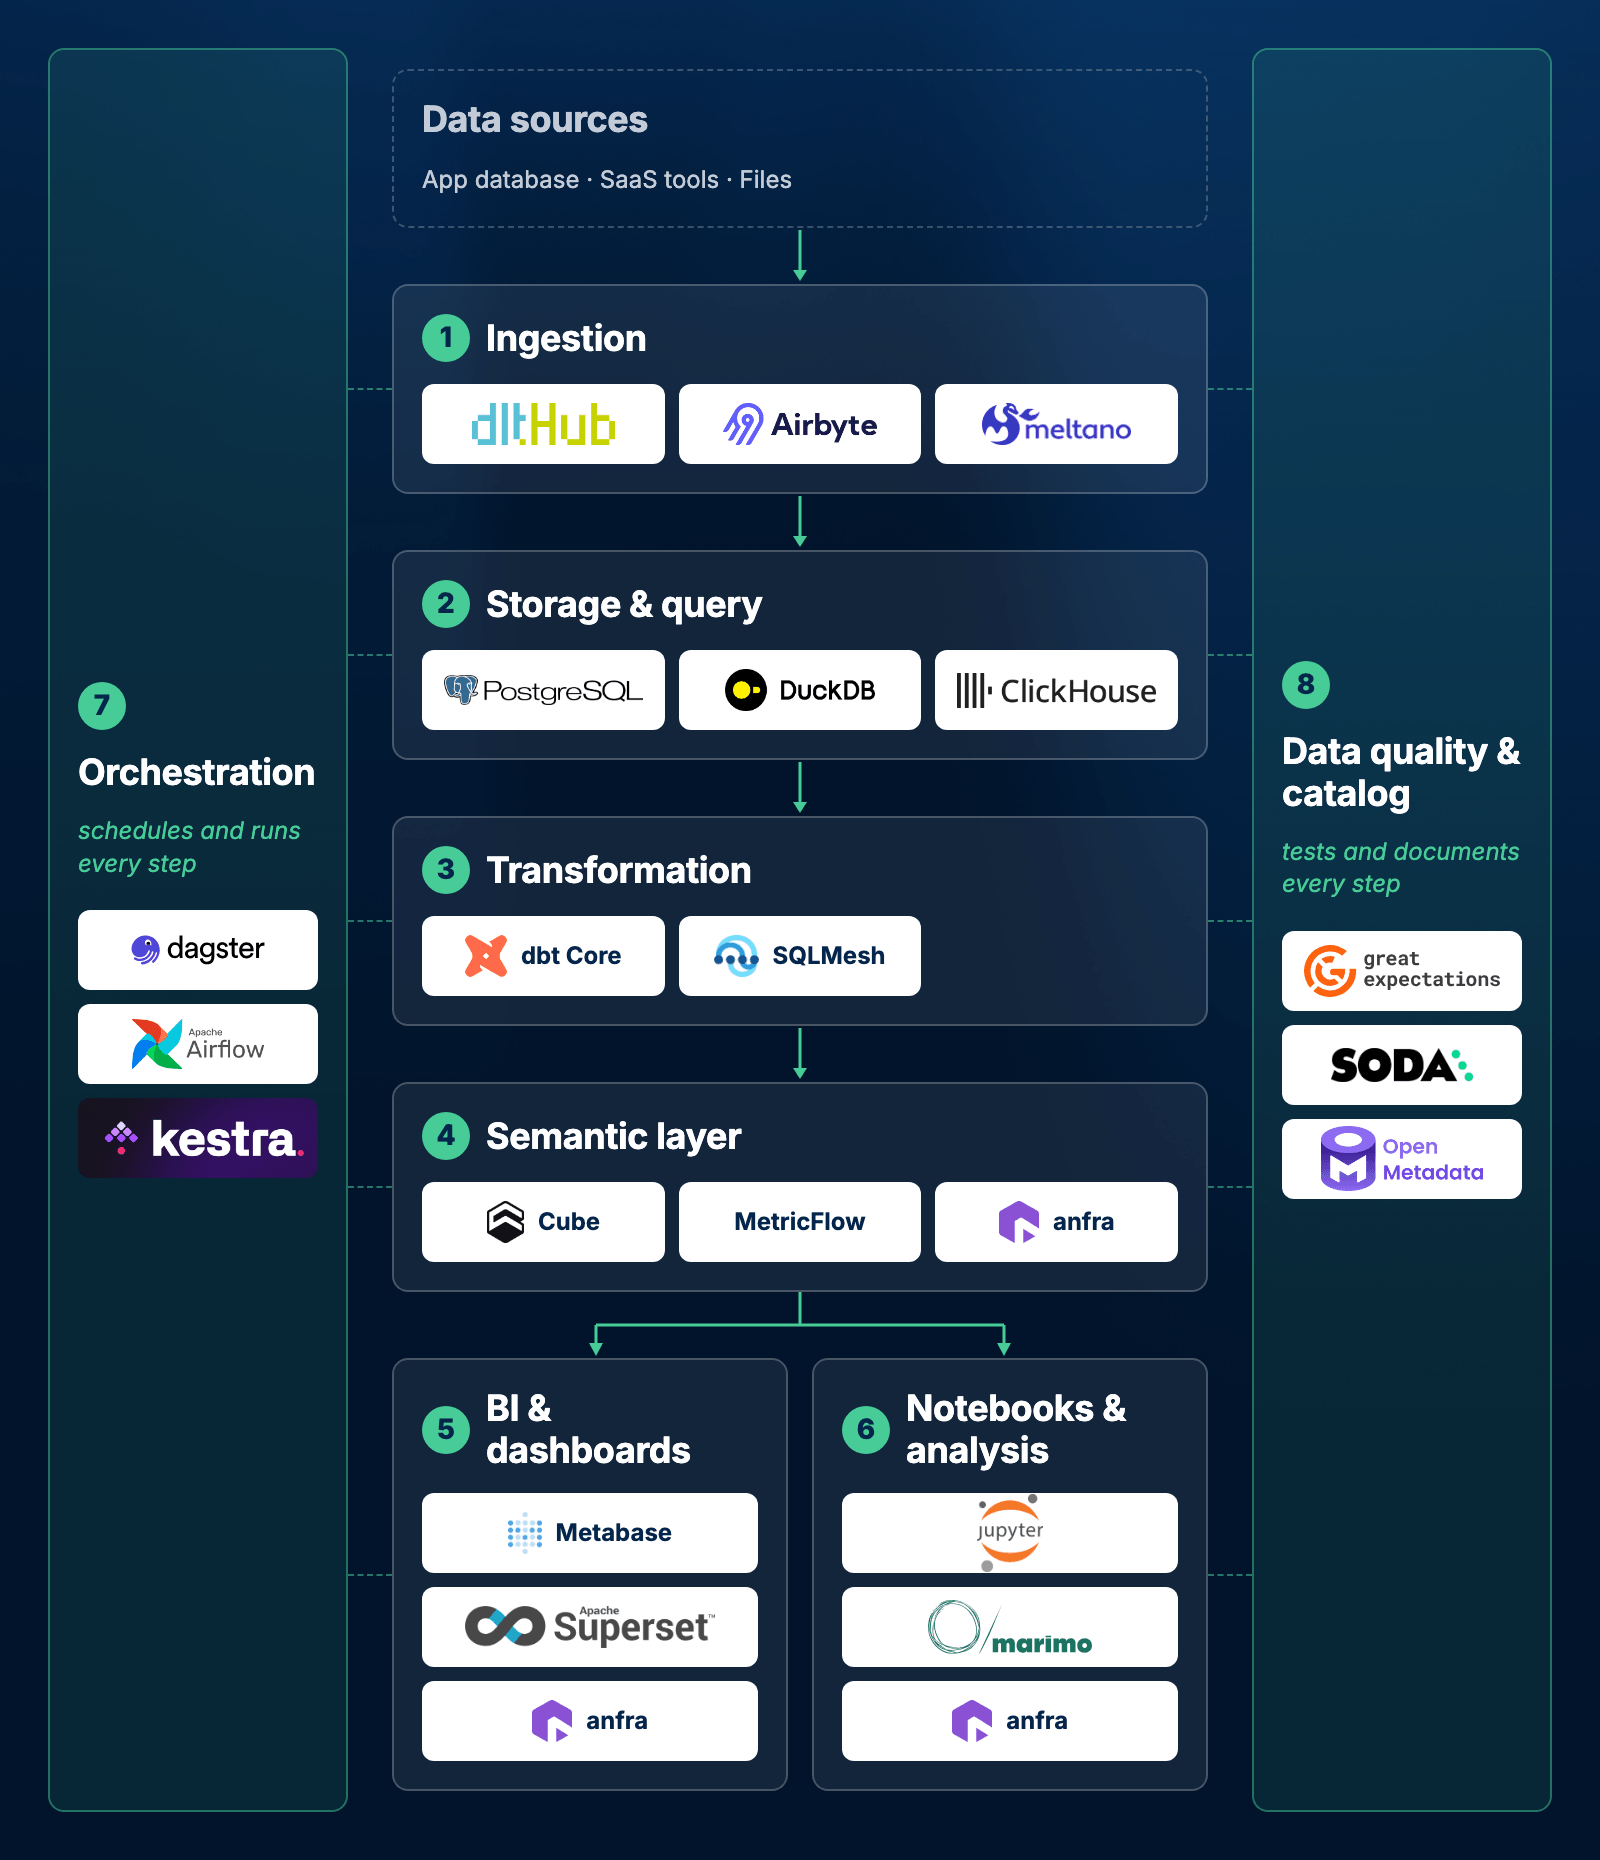 The open source analytics stack, with the main tools for each layer.
| Layer | Job | Open source tools to shortlist | Typical license | Add it when |
|---|---|---|---|---|
| Ingestion | Copies data from apps, APIs and databases into one place | dlt, Airbyte, Meltano | Apache 2.0, ELv2, MIT | You have more than one or two sources and someone is maintaining copy scripts by hand |
| Storage and query | Stores data and runs analytical queries | PostgreSQL, DuckDB, ClickHouse, Trino, Apache Spark, Apache Iceberg, Delta Lake | PostgreSQL License, MIT, Apache 2.0 | Day one (every stack needs somewhere to query) |
| Transformation and modeling | Turns raw tables into tested, documented models | dbt Core, SQLMesh | Apache 2.0 | Two people have written the same SQL logic twice |
| Orchestration | Runs jobs in the right order on a schedule and retries failures | Dagster, Apache Airflow, Kestra | Apache 2.0 | Cron can no longer express your dependencies, or a failed job goes unnoticed for a day |
| Semantic layer | Defines metrics once so every tool and agent computes them the same way | Cube, MetricFlow, anfra (AMQL) | Apache 2.0 | More than one tool, team or agent reads the same metrics |
| BI and visualization | Dashboards, reports and self-service questions | Metabase, Apache Superset, Lightdash, Evidence, Grafana, anfra | Mixed (AGPL, Apache 2.0, MIT) | Day one, in some form |
| Notebooks and analysis | Ad hoc analysis, statistics and modeling | Python (pandas, Polars), R, JupyterLab, marimo, KNIME, Orange | BSD, MIT, Apache 2.0, GPL | Day one for analysts; KNIME or Orange for analysts who don't code |
| Data quality and catalog | Tests data, documents tables and tracks lineage | Great Expectations, Soda Core, OpenMetadata | Apache 2.0, ELv2 | People start asking which table to trust, or a bad load reaches a dashboard |
1. Ingestion layer: Best open-source ingestion tools
The ingestion layer copies data out of the systems where it's created (your production database, Stripe, HubSpot, Google Ads, a folder of CSV files) and lands it in your warehouse or database, where it can be queried alongside everything else. In our experience, one or two sources can run on a scheduled script without much trouble, while a third or fourth source is usually the point where hand-written copy jobs start to fail without anyone noticing, and a dedicated ingestion tool becomes the cheaper option.
dlt
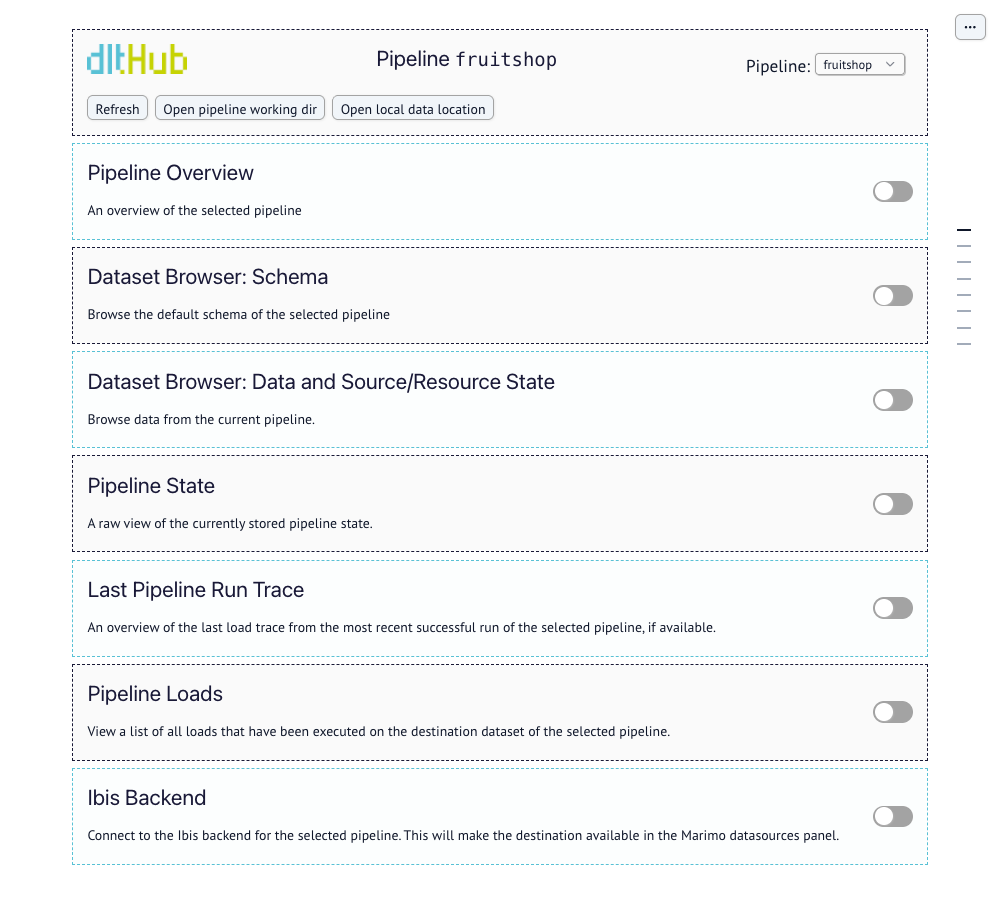 The dlt pipeline dashboard, which shows a pipeline's schema, loads and state. Source: dlt documentation.
dlt is a Python library rather than a service, so a pipeline is an ordinary Python script that runs anywhere Python runs, from a laptop to an Airflow task.
dlt (Apache 2.0) handles schema inference, incremental loading and schema changes for you, and it suits teams that are comfortable writing a little code and would rather keep pipelines in their own repository than operate another server.
Airbyte
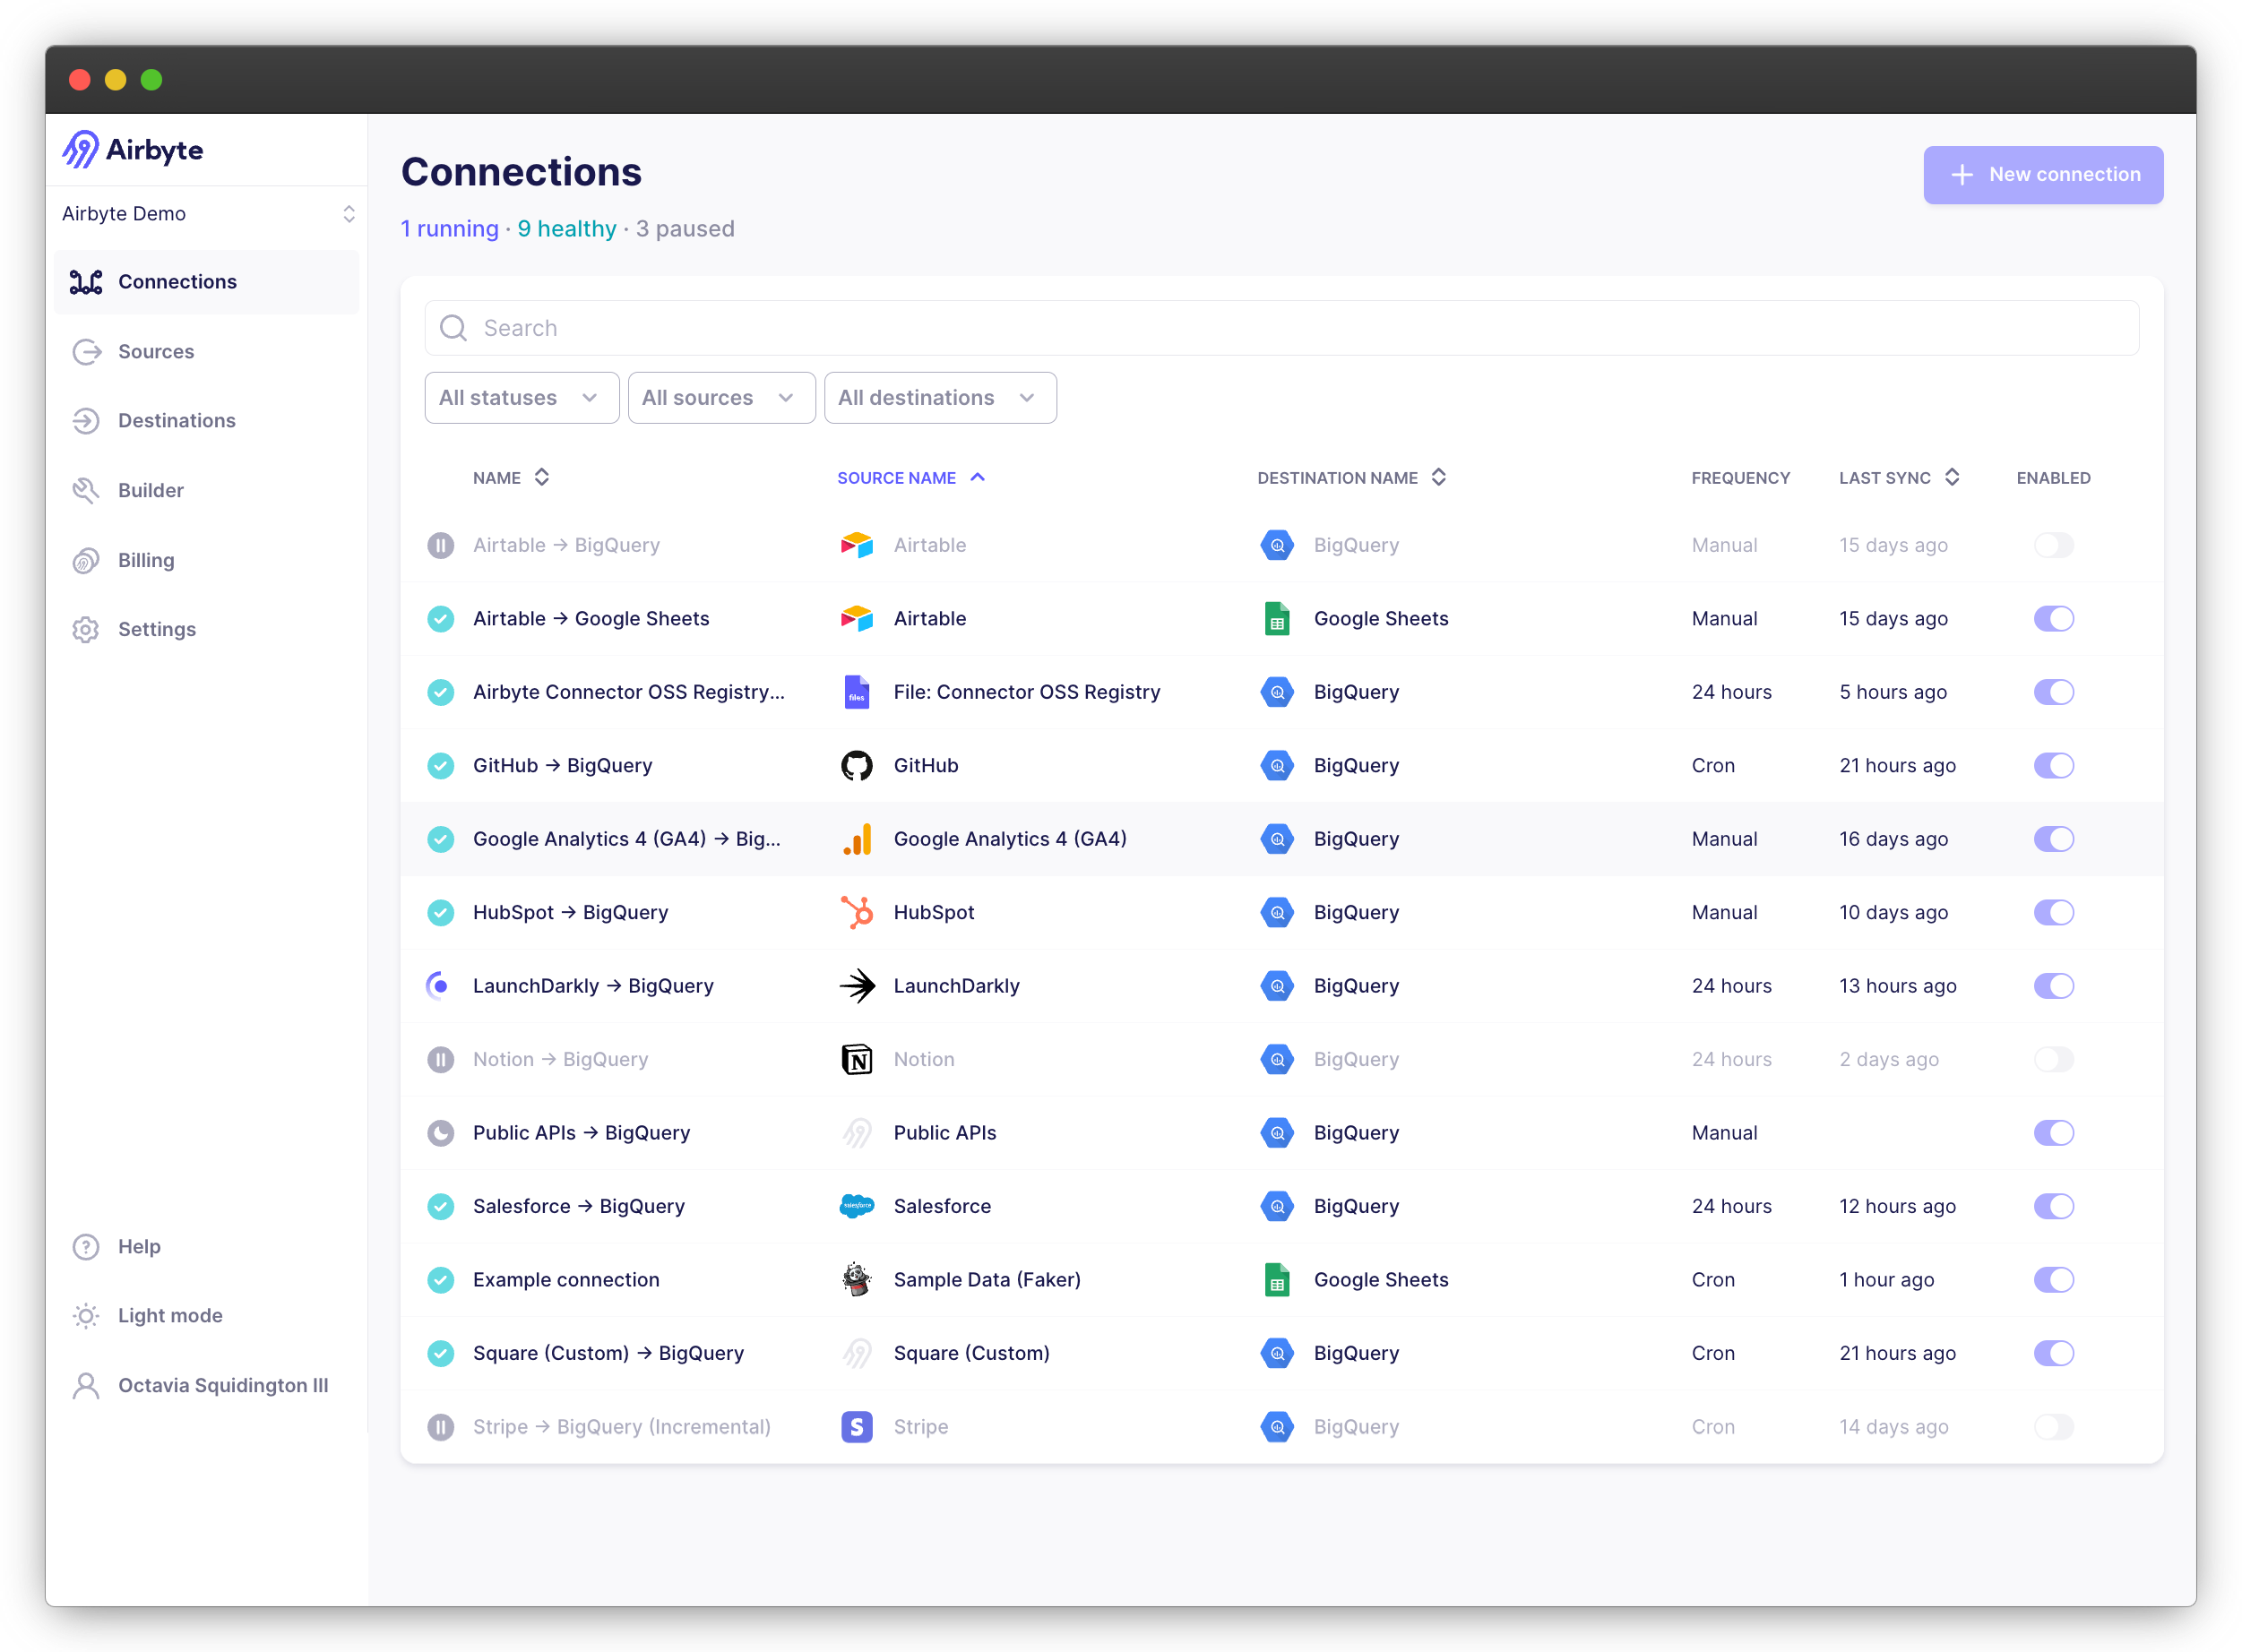 Airbyte's Connections page, where each source-to-destination sync is configured. Source: Airbyte on GitHub.
Airbyte runs as a service with a web interface and a large catalog of prebuilt connectors, so the people setting up sources don't need to write any code.
Airbyte is the easier choice when sources are configured by analysts or operations staff. Its platform is published under the Elastic License 2.0 (ELv2), which allows you to use and modify it for your own company but prohibits offering it to others as a hosted service, so it is source-available rather than open source in the OSI sense.
Meltano
Meltano wraps the Singer ecosystem of taps and targets in a command-line tool whose project files live in Git, which gives you hundreds of community connectors with a code-first workflow.
Meltano (MIT) sits between dlt and Airbyte, and it suits teams that want configuration as code without writing each connector themselves.
2. Storage and query layer: Best open-source databases and query engines
The storage layer is where the data lives and where every query in the stack eventually runs, and the right choice depends far more on data size and concurrency than on features. Most teams below a few terabytes are well served by PostgreSQL, DuckDB or ClickHouse, while the last four tools in this section make sense once data outgrows a single machine and add real operational weight.
PostgreSQL
PostgreSQL is probably already running somewhere in your company, and every BI tool, notebook and ingestion tool connects to it, which makes it the lowest-effort place to start.
PostgreSQL (PostgreSQL License) handles analytics comfortably up to tens of millions of rows, and a read replica of the production database is often the first analytics warehouse a startup has.
DuckDB
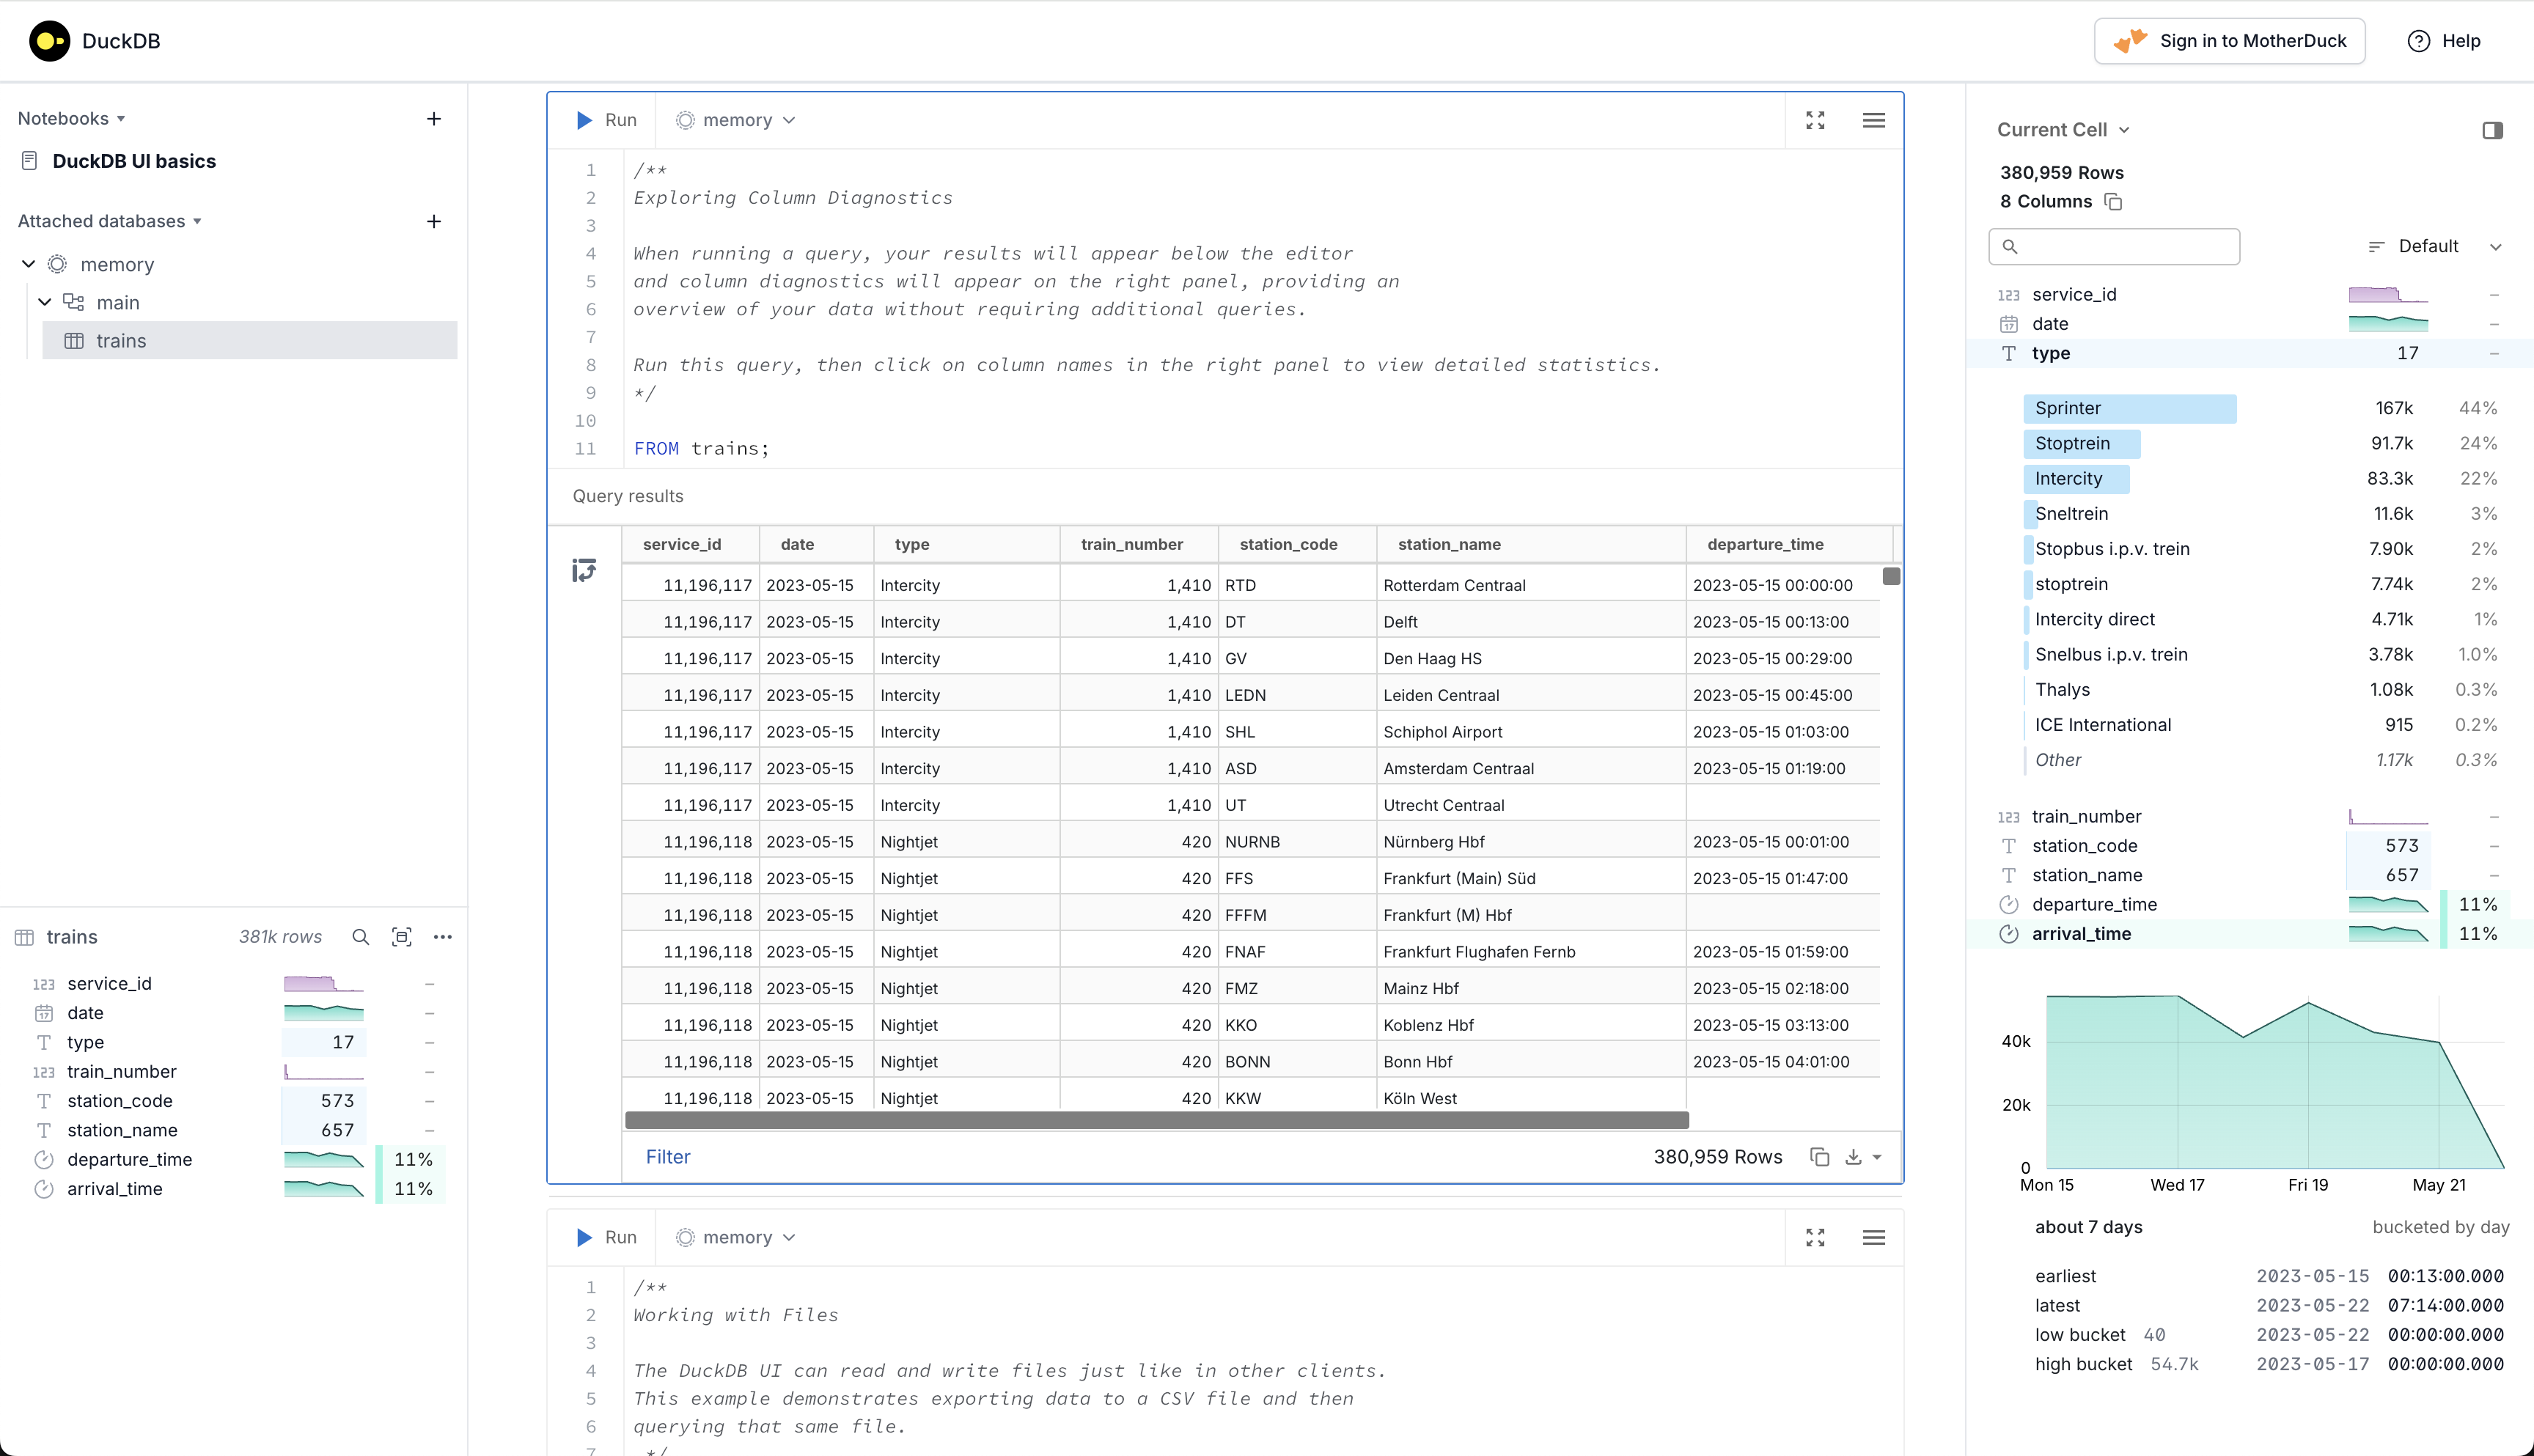 The DuckDB local UI, with SQL cells and a column explorer. Source: DuckDB blog.
DuckDB is an in-process analytical database, closer to SQLite than to a server, so there is nothing to install or run and it queries Parquet and CSV files directly.
DuckDB (MIT) is the fastest way for a single analyst to work through a few hundred million rows on a laptop, and it also runs inside Python notebooks, dbt projects and some BI tools.
ClickHouse
ClickHouse is a columnar database server built for very fast aggregations over billions of rows with many concurrent users.
ClickHouse (Apache 2.0) is the usual open source choice for event data, product analytics and dashboards that many people open at the same time.
Trino
Trino is a distributed SQL engine that queries data where it already sits (object storage, Postgres, Kafka and others) without copying it into one database first.
Trino (Apache 2.0) suits companies whose data is spread across many systems, and it's often paired with an open table format on object storage.
Apache Spark
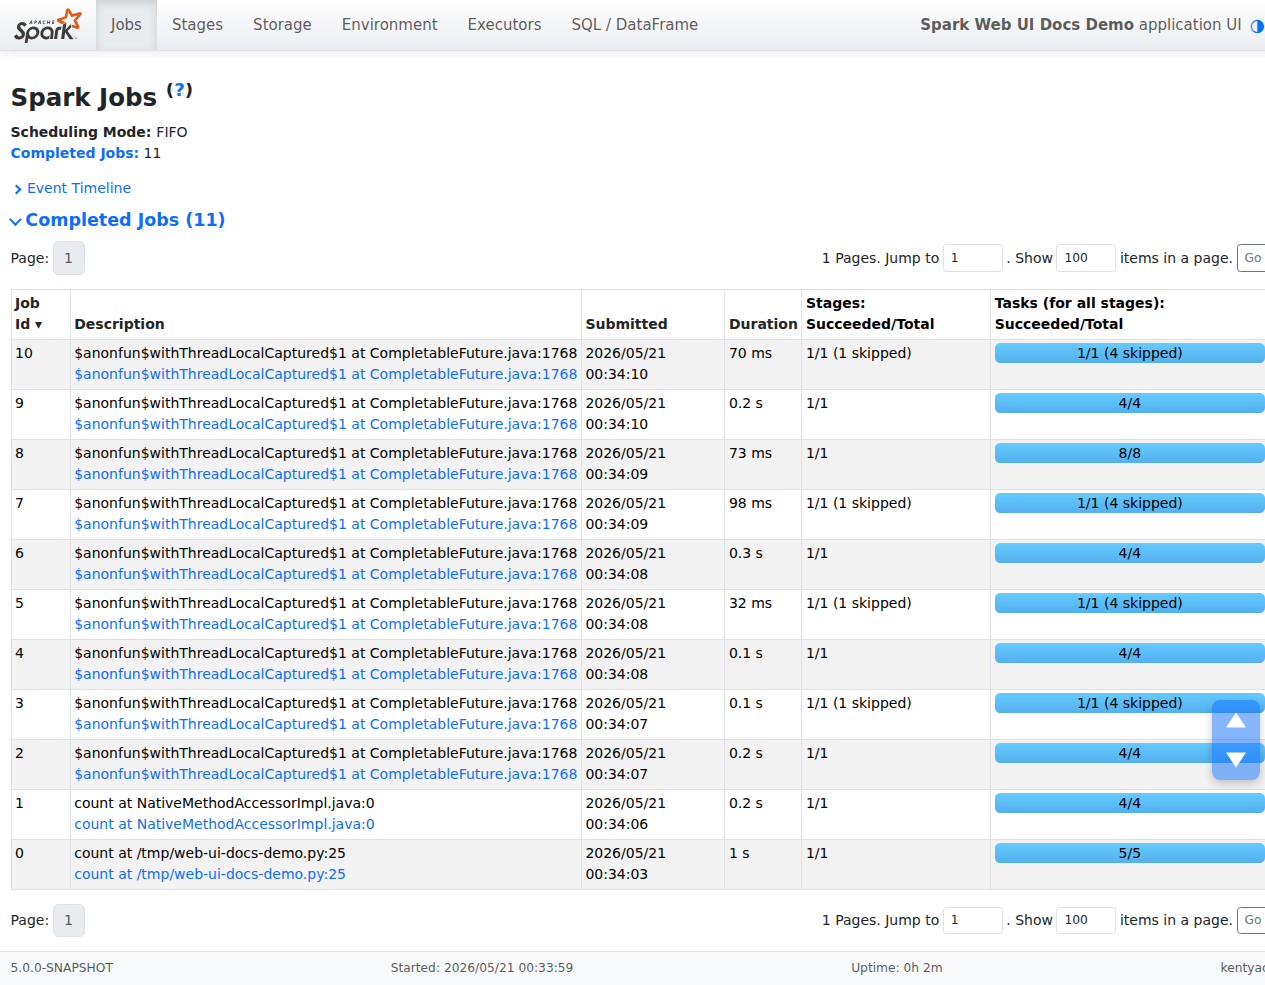 The Spark web UI's Jobs page. Source: Apache Spark documentation.
Spark is a general-purpose distributed engine that handles SQL, Python data frames and machine learning on the same cluster.
Apache Spark (Apache 2.0) is the standard for large batch processing and machine learning pipelines, and it is more engine than most analytics teams need until their data reaches the terabyte range.
Apache Iceberg
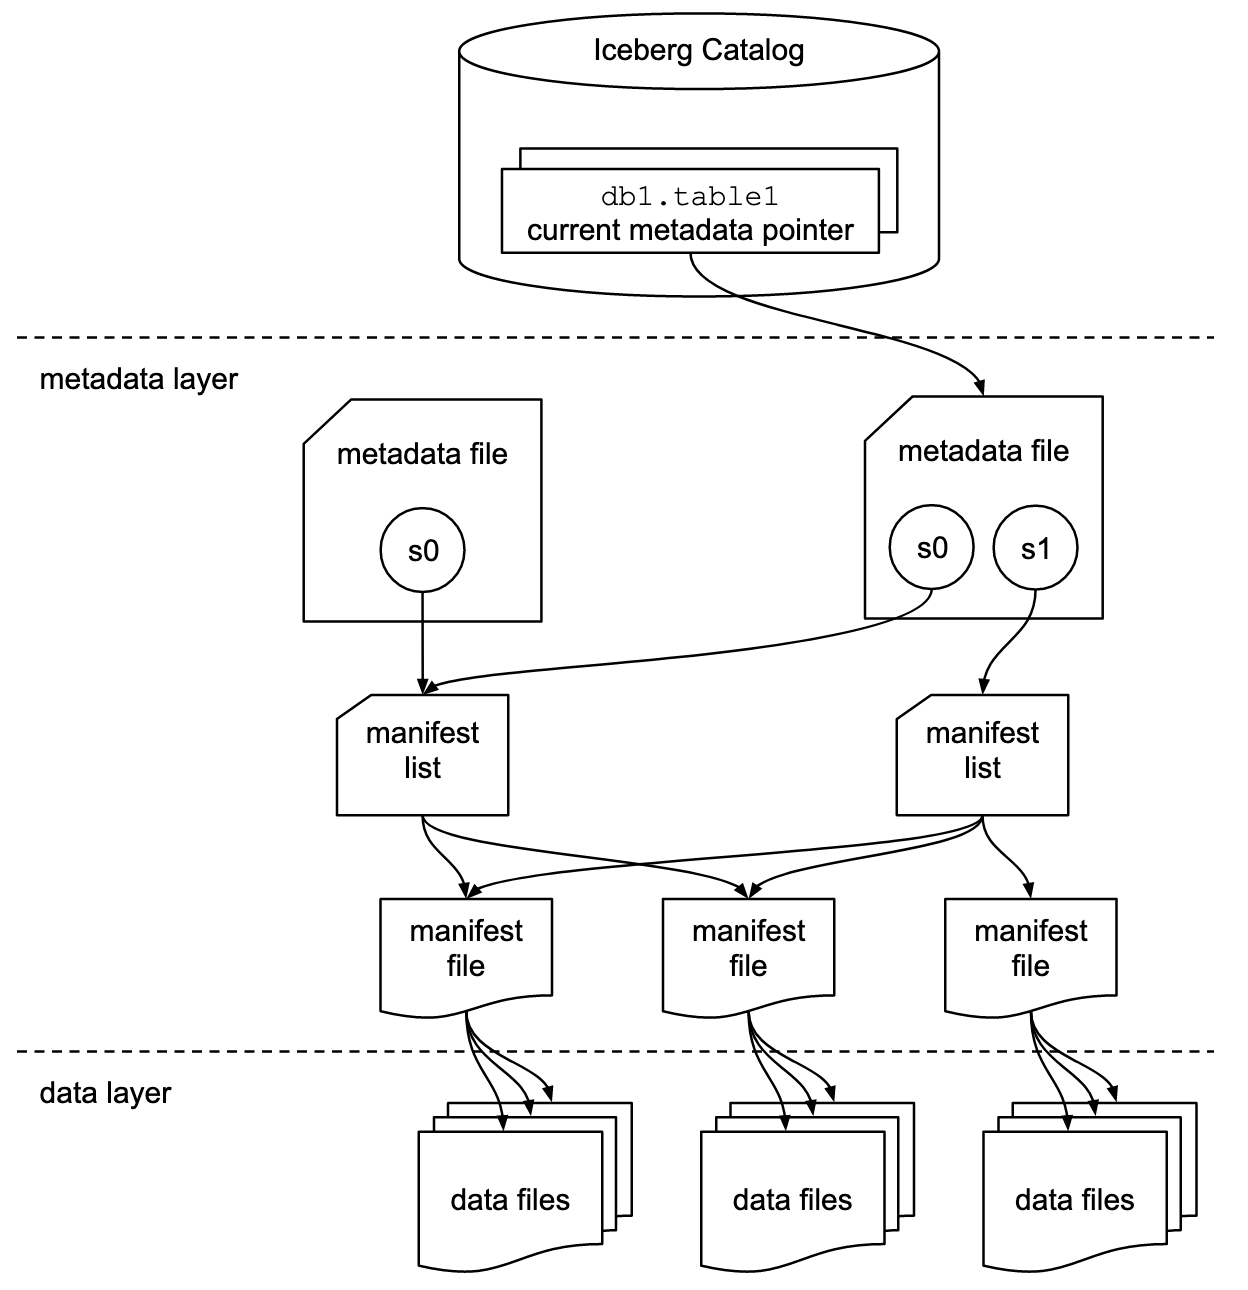 How an Iceberg table is organized: a catalog pointer, metadata files, manifests and data files. Source: Apache Iceberg specification.
Iceberg is an open table format rather than an engine, turning Parquet files in object storage into tables with schemas, transactions and time travel that several engines can read and write.
Apache Iceberg (Apache 2.0) has broad support across Trino, Spark, DuckDB, ClickHouse and the major cloud warehouses, which makes it the common choice for teams that want to avoid tying their data to a single engine.
Delta Lake
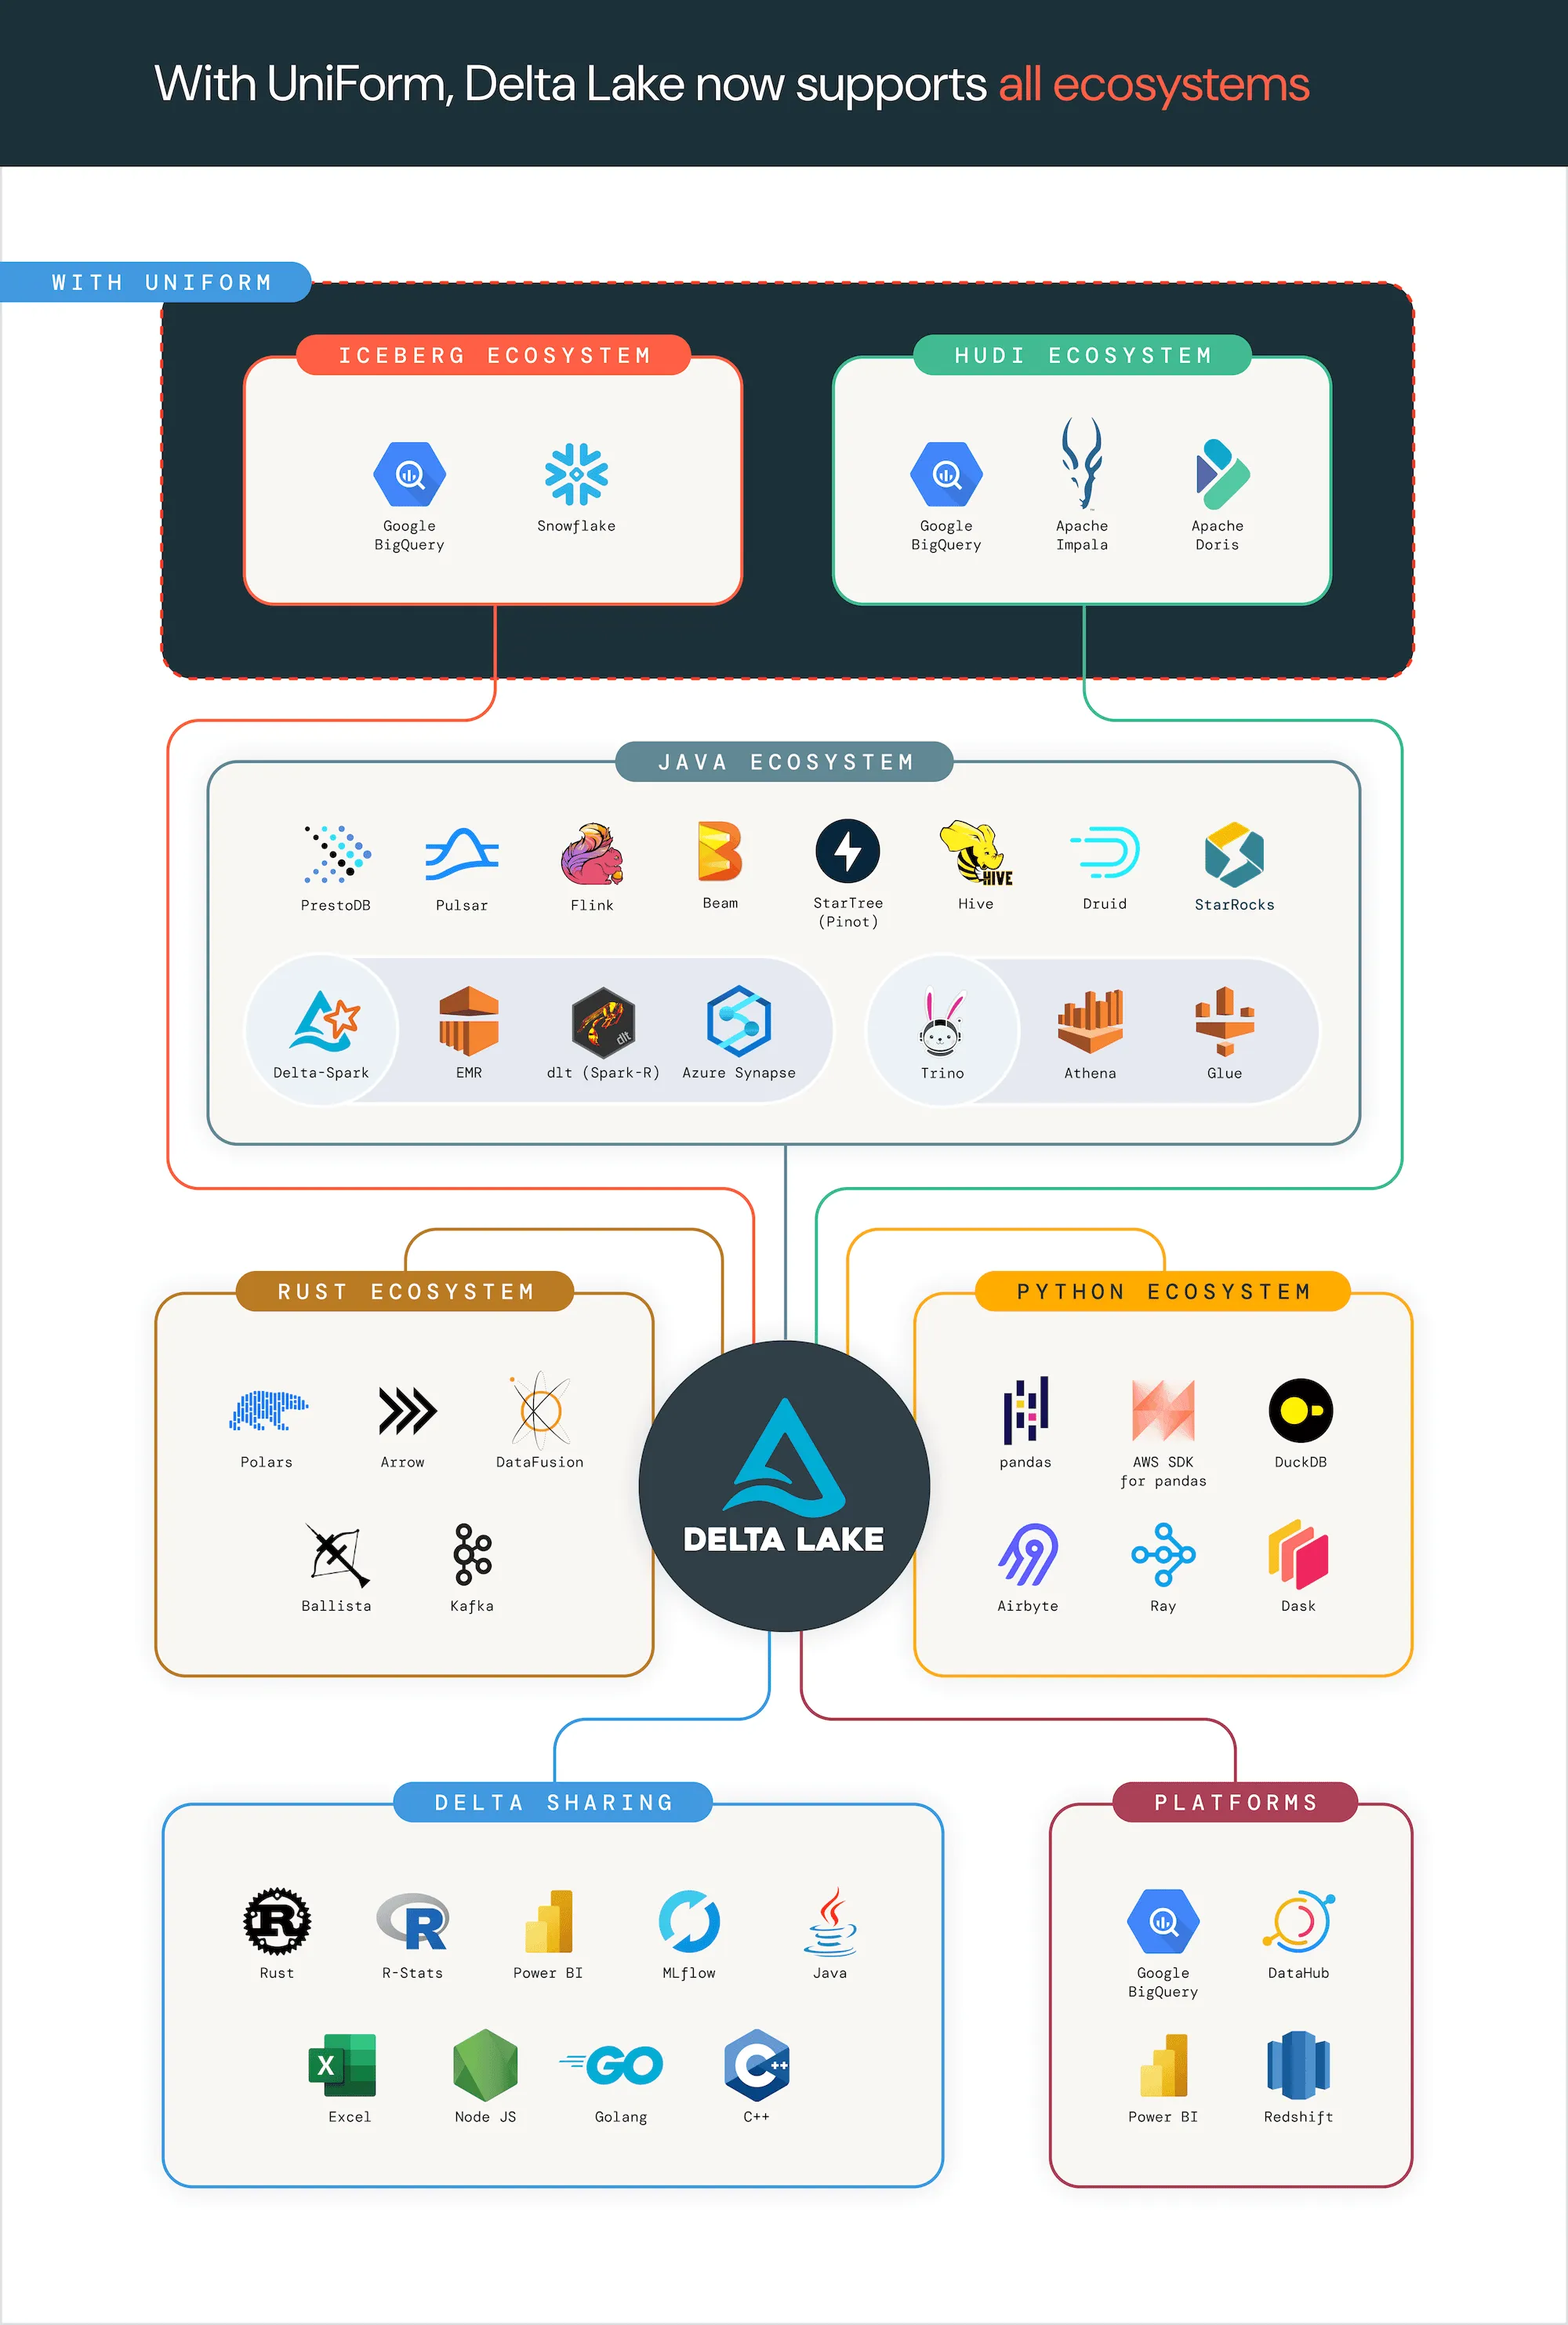 Delta Lake with UniForm, showing the engines and formats that can read Delta tables. Source: delta.io.
Delta Lake is the table format created by Databricks alongside Spark, so it has the deepest integration with that ecosystem.
Delta Lake (Apache 2.0) provides the same core features as Iceberg (transactions, schema evolution, time travel), and the choice between them usually follows from which engines the team already runs.
3. Transformation layer: Best open-source transformation and modeling tools
Raw tables from the ingestion layer are rarely in the shape people want to analyze, so the transformation layer turns them into clean models (customers, orders, subscriptions) with tests and documentation attached. This layer usually becomes worth adding the first time two people write the same SQL logic separately. Tools for entity-relationship diagrams and database design are a separate category, which we cover in our guide to open source data modeling tools.
dbt Core
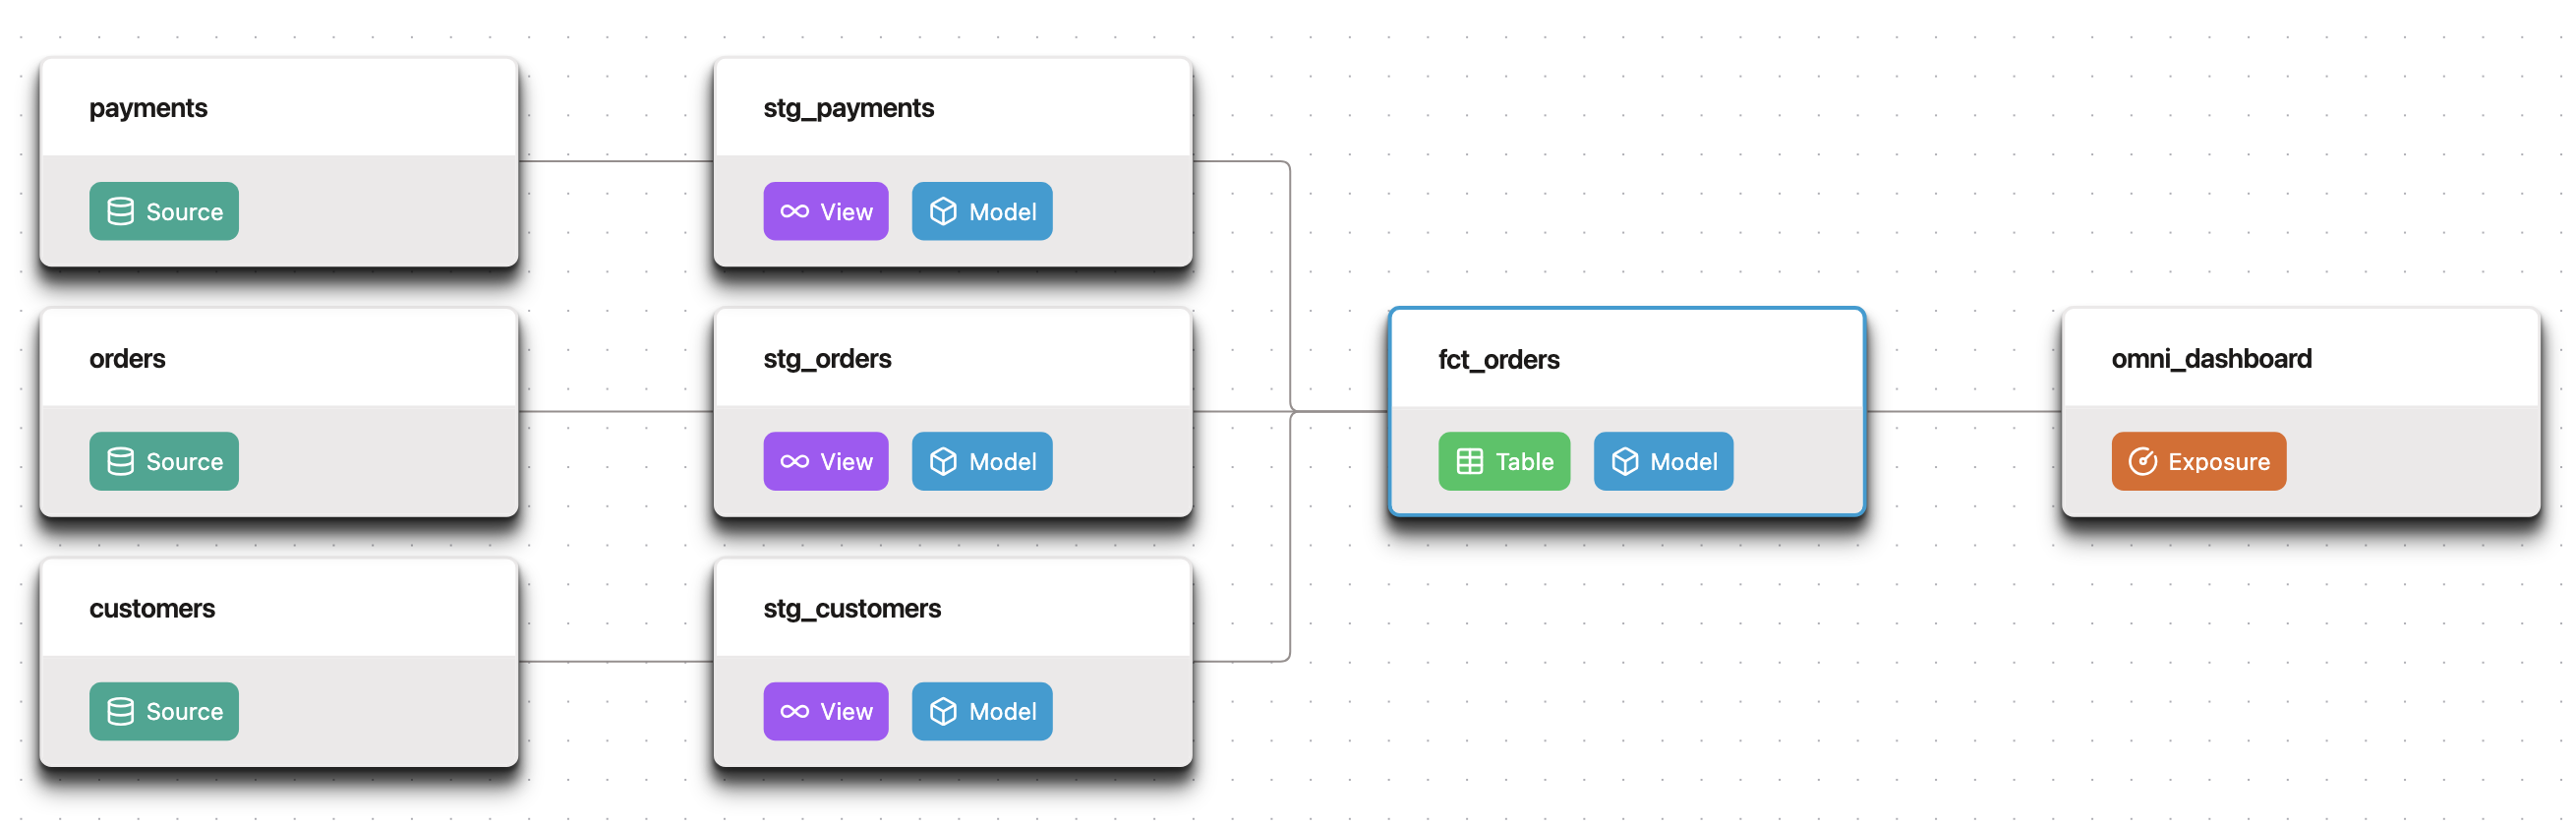 A dbt lineage graph, from sources through staging models to a fact table and dashboard. Source: dbt on GitHub.
dbt Core is the tool most of the analytics engineering ecosystem assumes, so nearly every warehouse, orchestrator, semantic layer and BI tool in this guide integrates with it.
dbt Core (Apache 2.0) treats models as SQL SELECT statements in a Git repository, works out the dependency order, and runs tests that catch nulls, duplicates and broken relationships before a dashboard shows them. The licensing needs a closer look, because dbt Labs' newer Rust-based engine, dbt Fusion, is a separate project whose code is mostly under ELv2, so "dbt is open source" is true of dbt Core and only partly true of Fusion.
SQLMesh
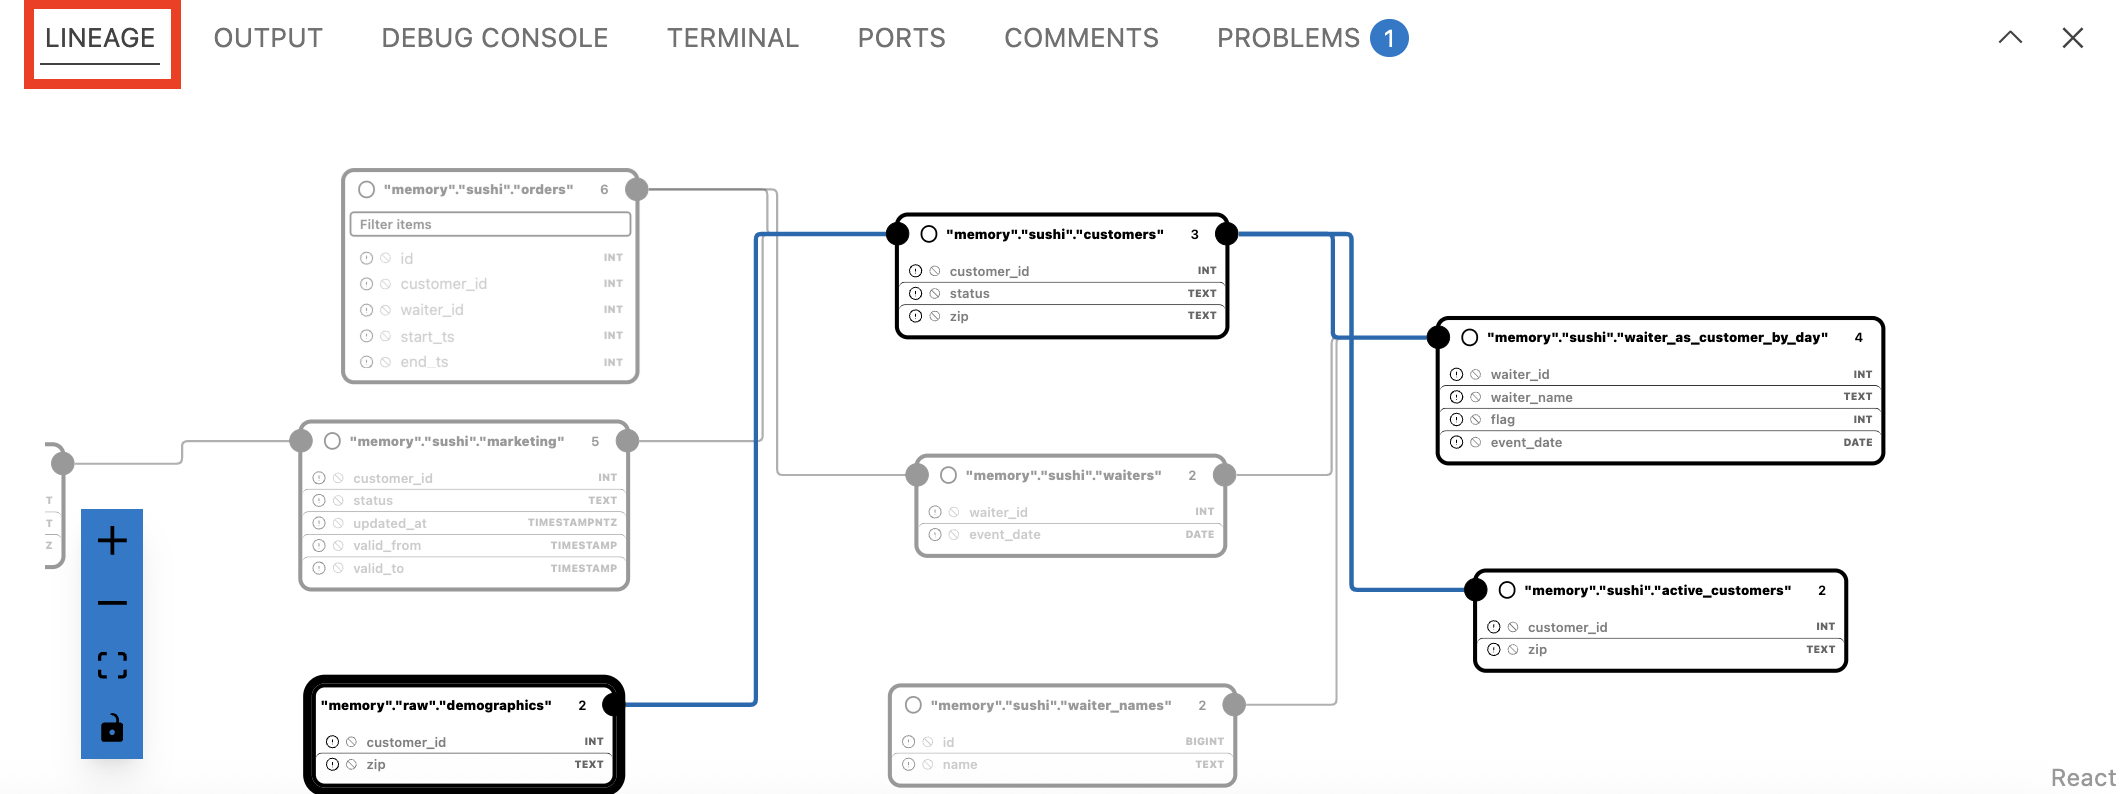 SQLMesh's lineage view in its VS Code extension. Source: SQLMesh documentation.
SQLMesh shows what a change will rebuild before it runs, through a planning step and virtual development environments that avoid recomputing unchanged models.
SQLMesh (Apache 2.0) also offers column-level lineage, and it suits teams whose dbt projects have grown large enough that slow or risky deployments have become a real cost.
4. Orchestration layer: Best open-source orchestration tools
An orchestrator runs ingestion, transformation and any other job in the right order, on a schedule, and tells someone when a step fails. Plenty of small stacks run on cron or on dbt's own scheduler without problems for a year or more, so this layer is often the last one a team adds, usually after a failed job has gone unnoticed for a day.
Apache Airflow
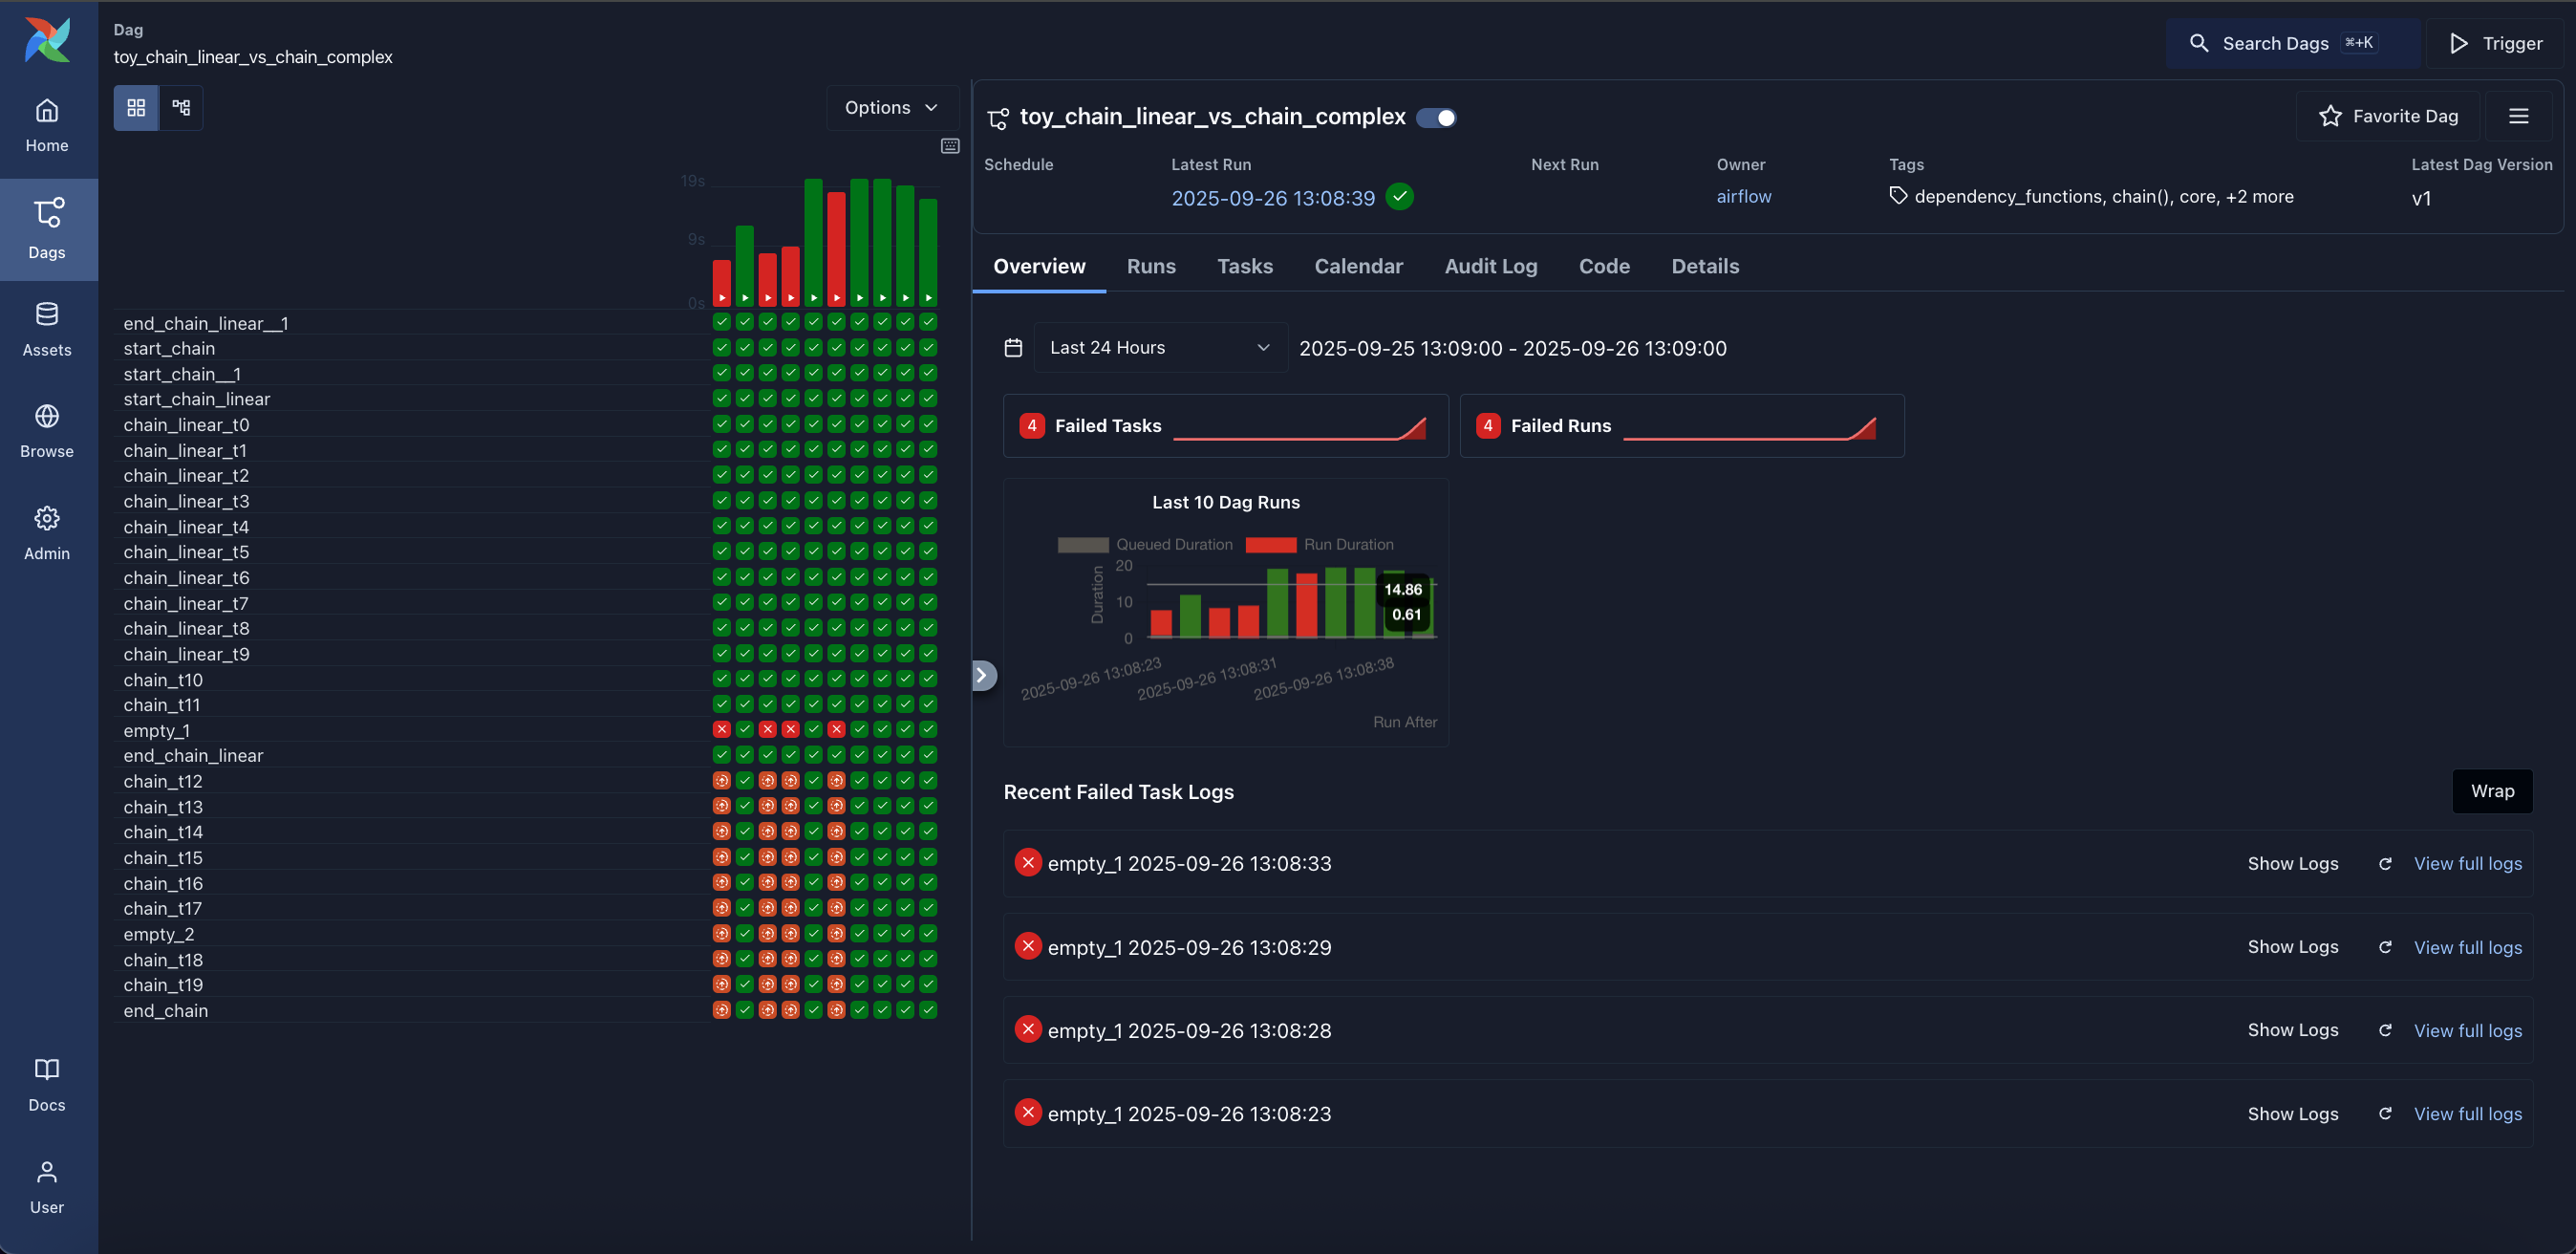 Airflow's grid view, with the state of each task across recent runs. Source: Apache Airflow on GitHub.
Airflow is the most widely deployed orchestrator and the one most data engineers already know, with a very large library of operators for external systems.
Apache Airflow (Apache 2.0) defines workflows as Python code, and its community means that almost any integration problem has been solved and documented by someone before.
Dagster
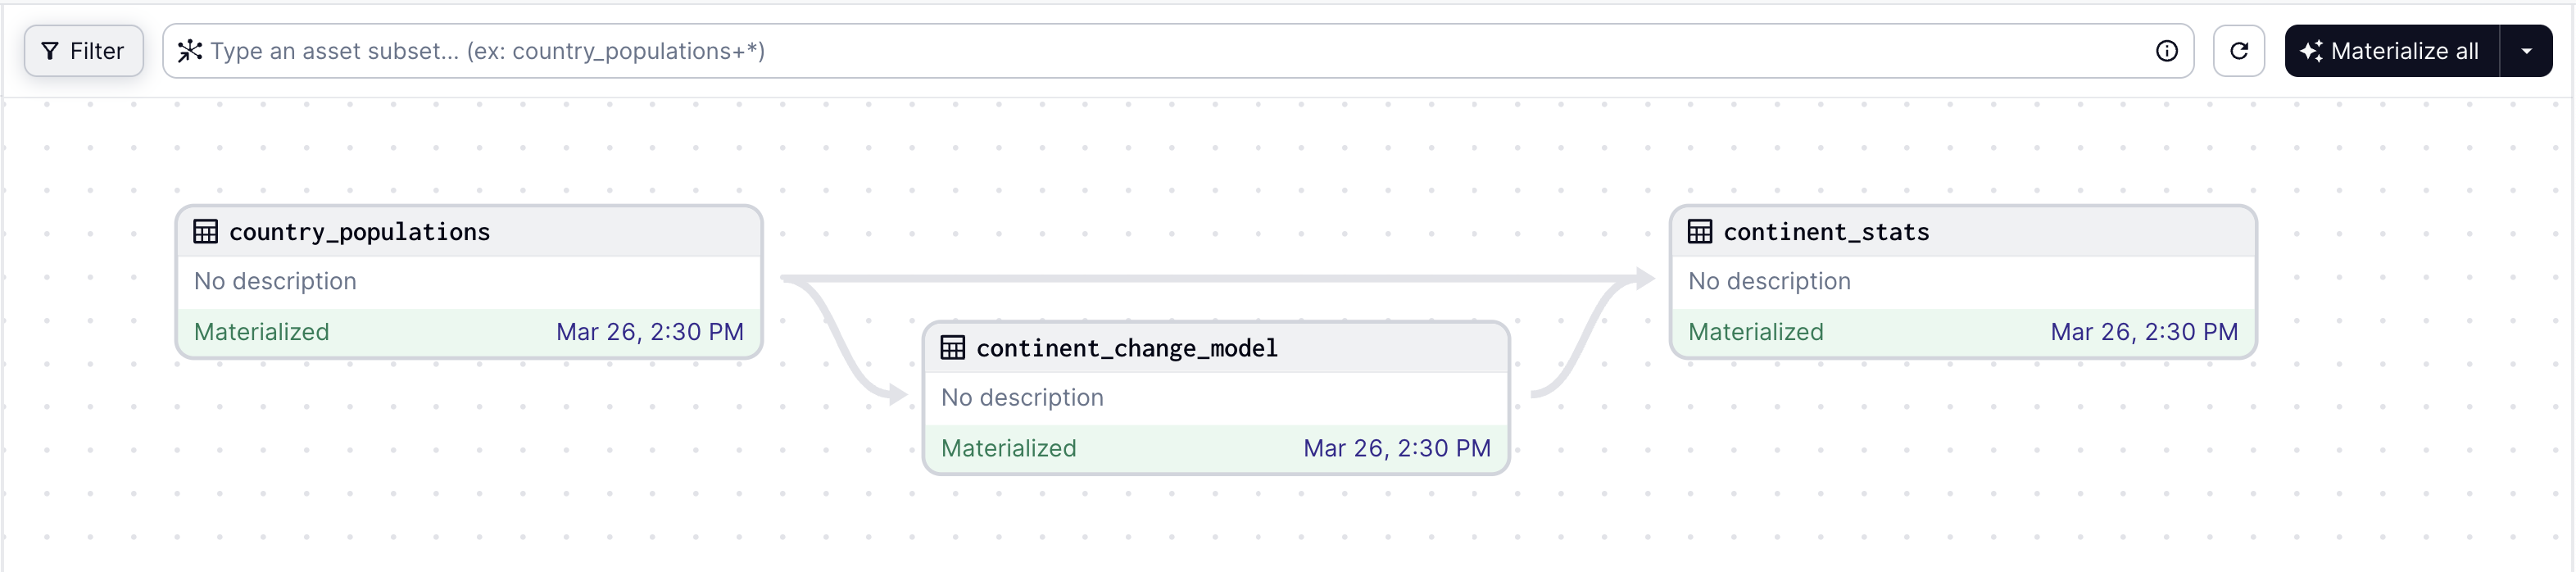 Dagster's asset graph, showing materialized data assets and their dependencies. Source: Dagster on GitHub.
Dagster organizes pipelines around the data assets they produce rather than the tasks that run, which gives you lineage and freshness checks across the whole stack.
Dagster (Apache 2.0) fits the dbt way of thinking closely, and it suits teams that want to see which tables are stale and why from one interface.
Kestra
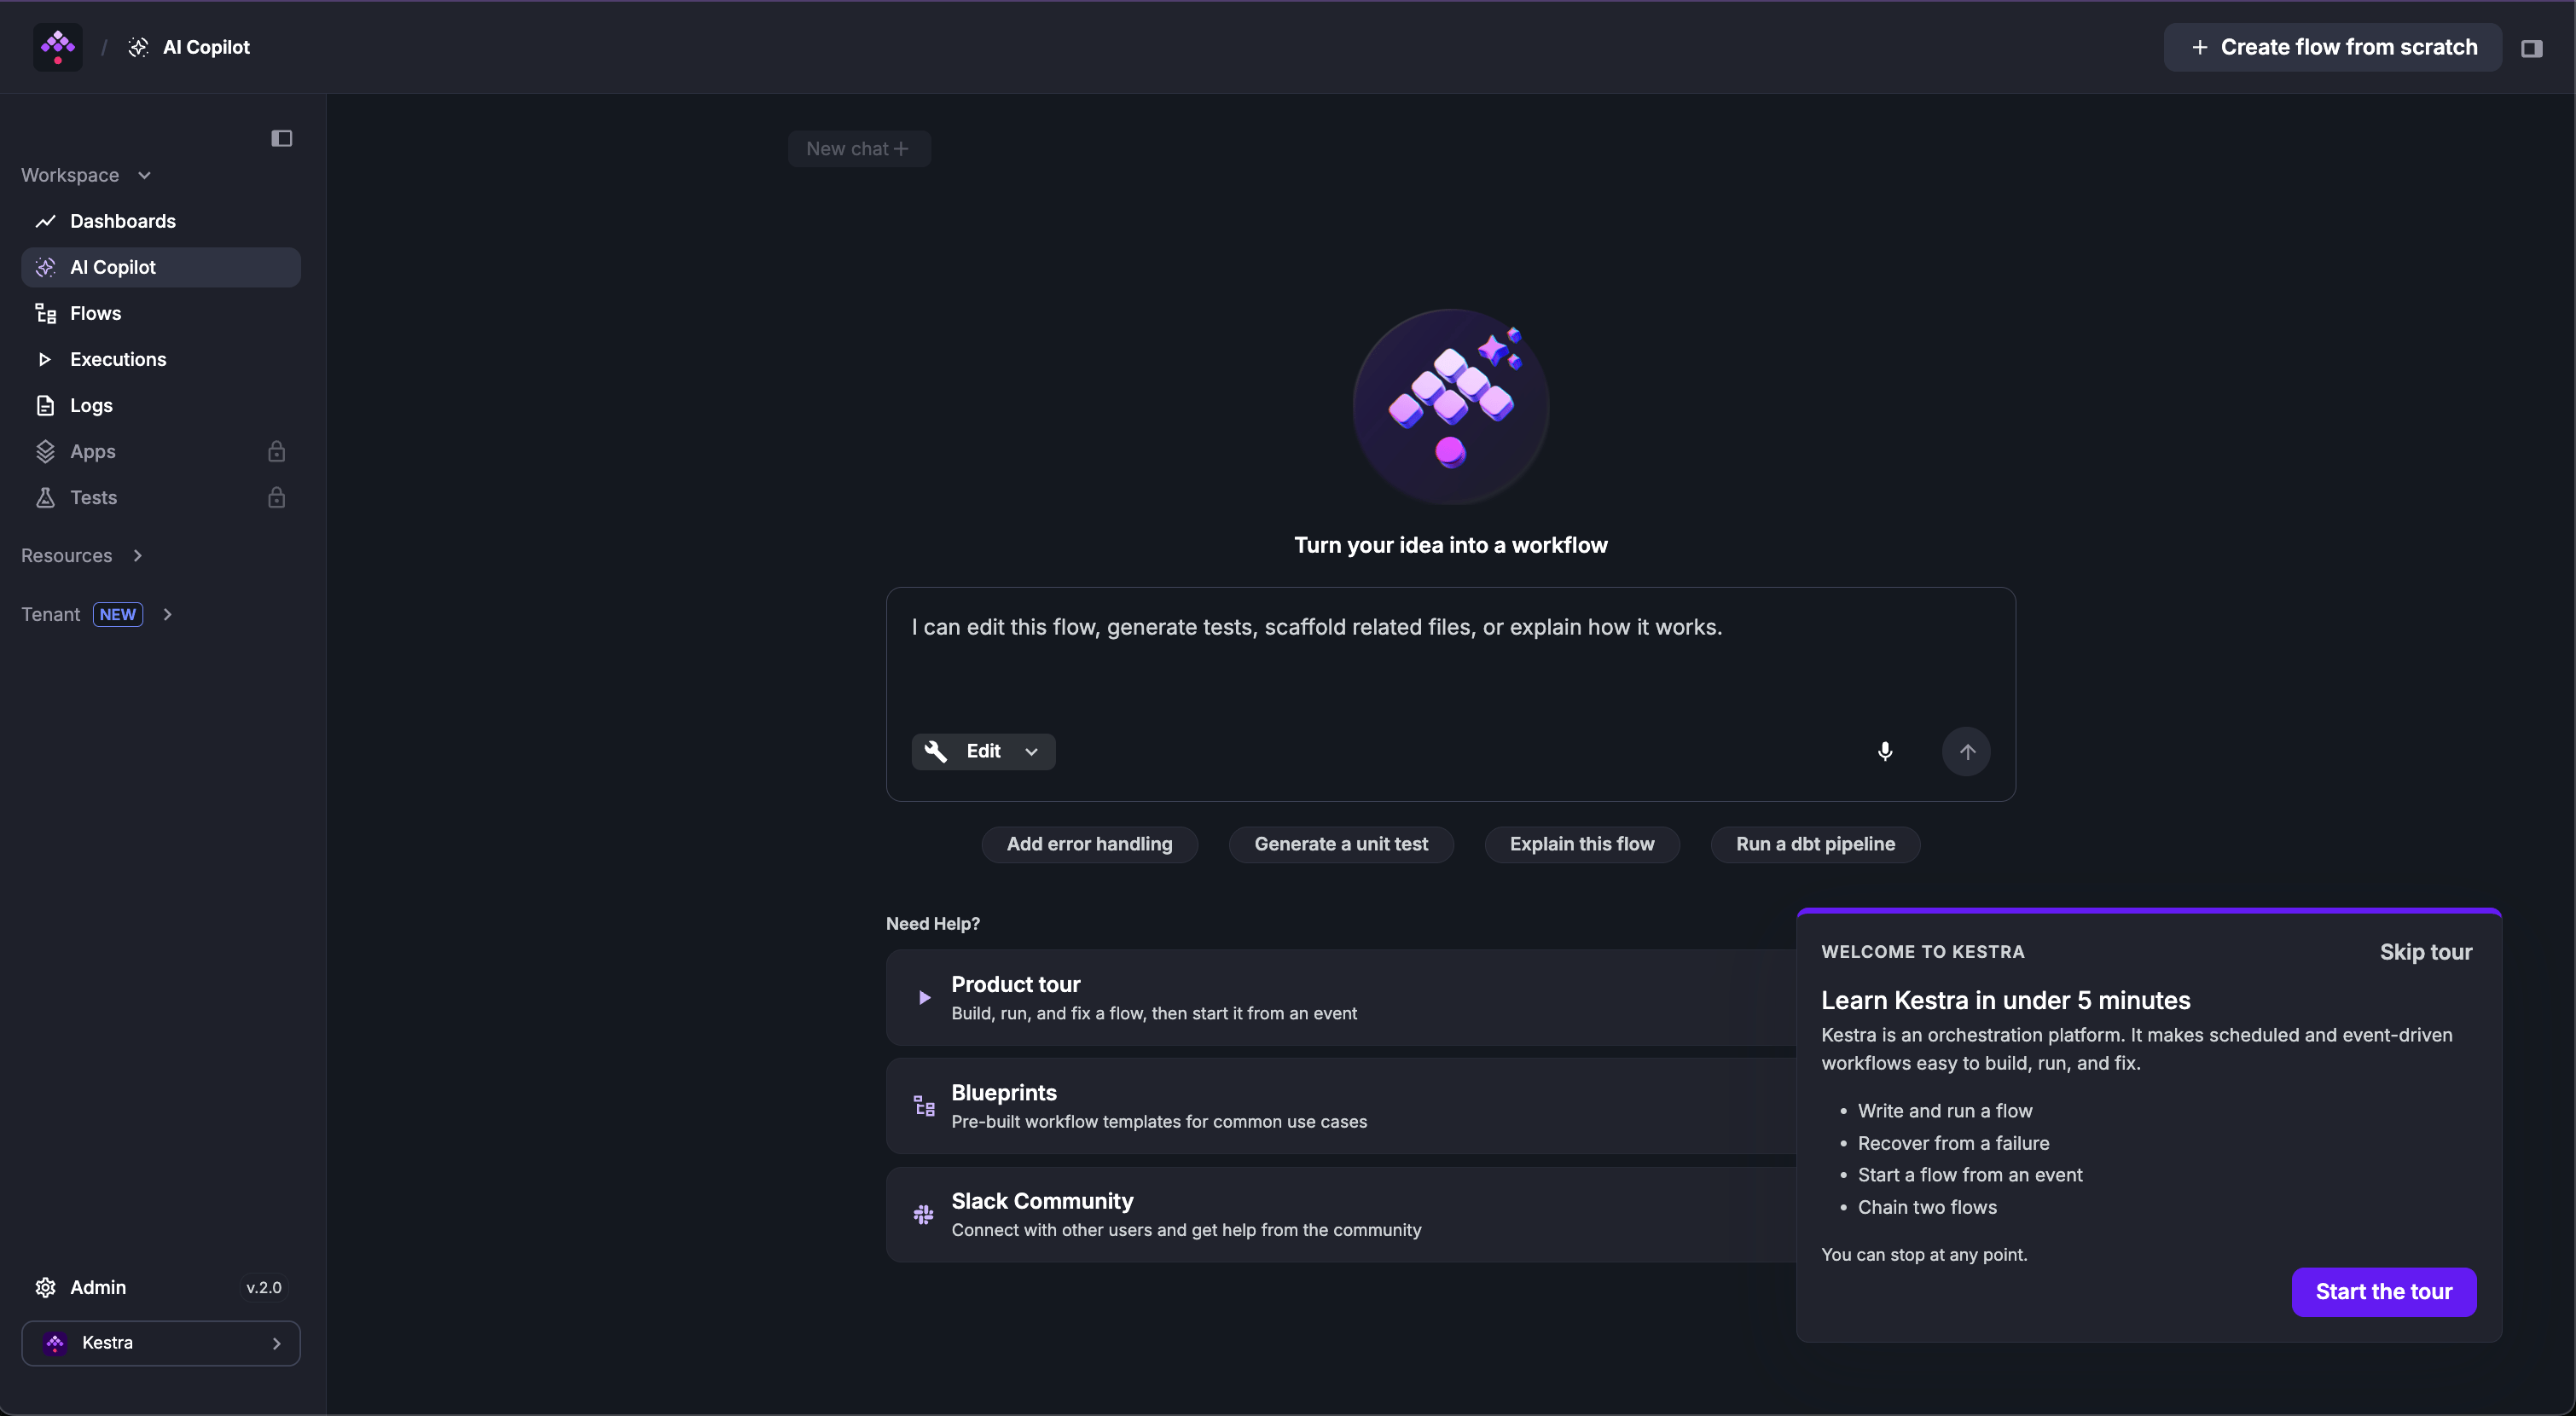 The Kestra web UI. Source: Kestra documentation.
Kestra defines workflows in YAML with a built-in editor, so analysts and operations staff can read and change pipelines without writing Python.
Kestra (Apache 2.0) suits teams where the people who own a workflow are not all engineers.
5. Semantic layer: Best open-source semantic layers
A semantic layer defines metrics such as revenue, active customers and conversion rate once, in code, so every dashboard, notebook and AI agent that asks for "revenue" computes it the same way. Without one, the definition lives in every tool's SQL separately and drifts as people copy and adjust it. A semantic layer becomes worth adding when a second consumer appears: a second BI tool, an embedded dashboard in your product, or analysts and agents querying the warehouse directly. Our guide to semantic layer tools compares the options in more depth, and our explainer covers what a semantic layer is.
Cube
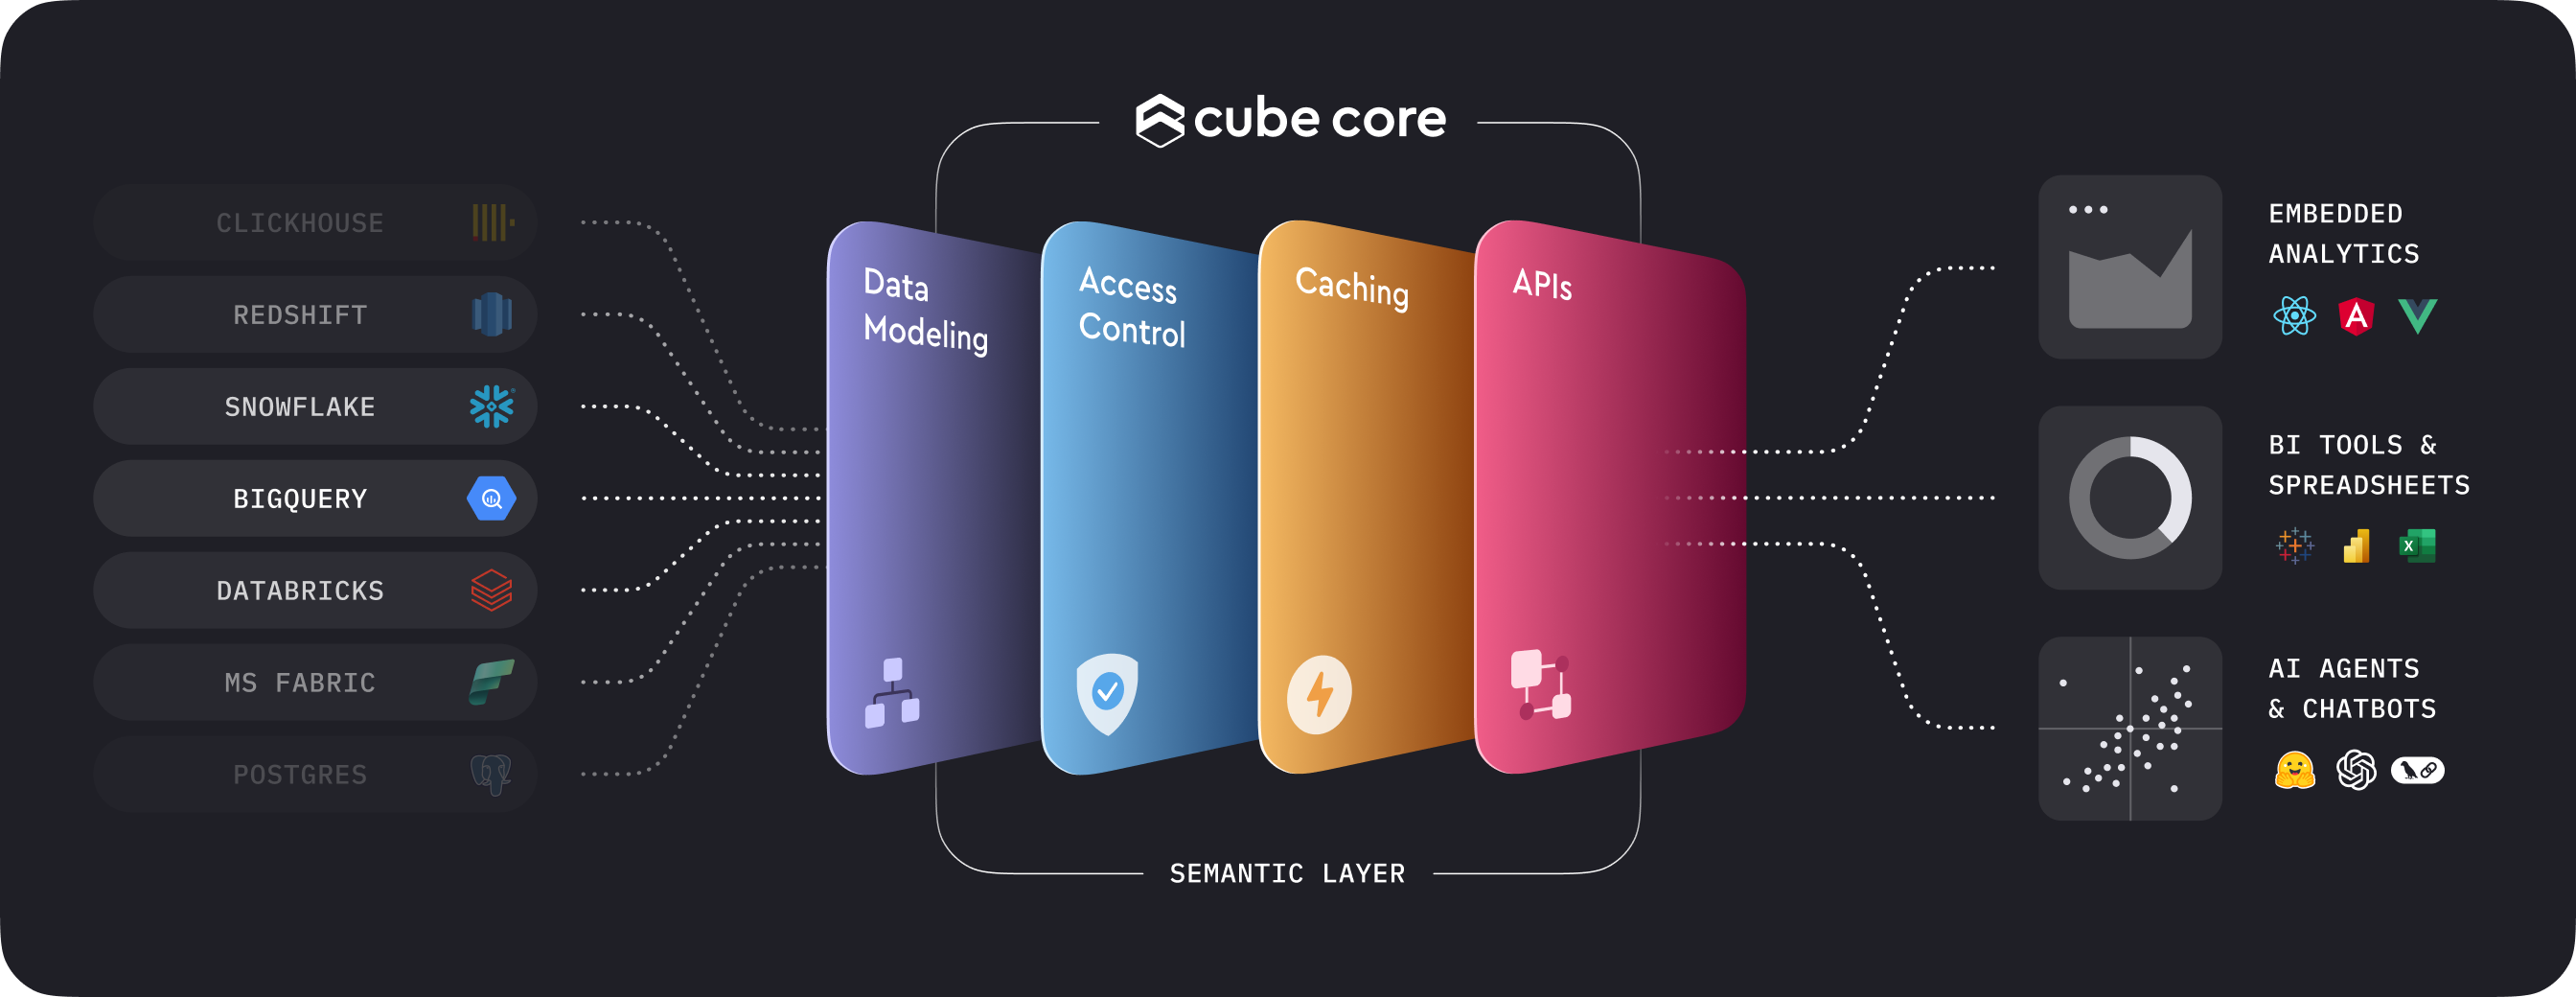 Cube Core sits between data sources and applications, handling modeling, access control, caching and APIs. Source: Cube on GitHub.
Cube is a standalone semantic layer that serves the same metrics to any number of front ends through SQL, REST and GraphQL APIs, with a caching layer on top.
Cube (Apache 2.0, with some MIT components) is the most established open source option, and it suits teams feeding dashboards, embedded analytics and applications from one set of definitions.
MetricFlow
MetricFlow is the engine behind the dbt Semantic Layer, so metrics are defined in YAML alongside the dbt models they depend on.
MetricFlow (Apache 2.0) is the natural choice for teams that already define everything in dbt and want their metrics in the same project.
anfra
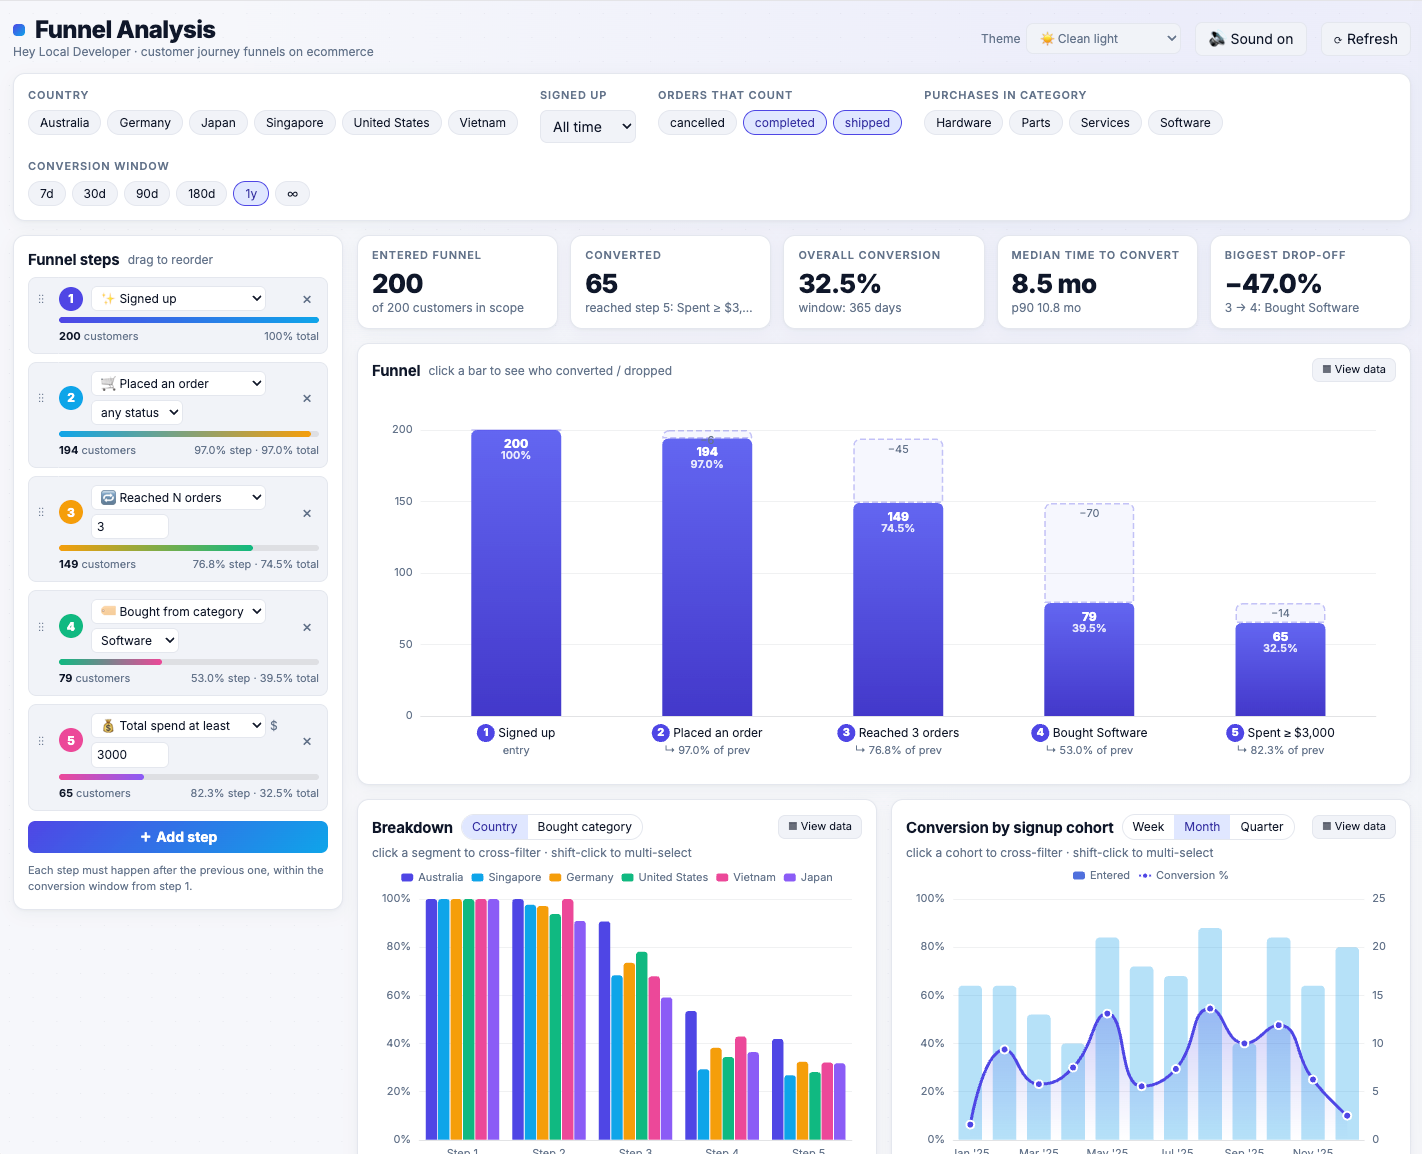 A funnel analysis app built by a coding agent with anfra. Source: anfra on GitHub.
anfra is designed for coding agents, which build analytics apps on top of it but can only request metrics defined in its semantic layer, so every app shows the same numbers.
anfra (Apache 2.0) uses AMQL, the semantic layer Holistics runs in production, and exposes it to agents such as Claude Code and Cursor through an MCP server. (Disclosure: anfra is built by the team at Holistics, which publishes this blog. It's also the youngest project in this guide, at v0.8.0 with a small community.)
6. BI layer: Best open-source BI and visualization tools
The BI layer is the part of the stack most people see, and it has more open source options than any other layer. We compared twelve of them in detail (license, GitHub activity, cloud pricing, self-hosting footprint and how each handles AI agents) in our guide to open source BI tools, so this section only covers what sets each one apart.
Metabase
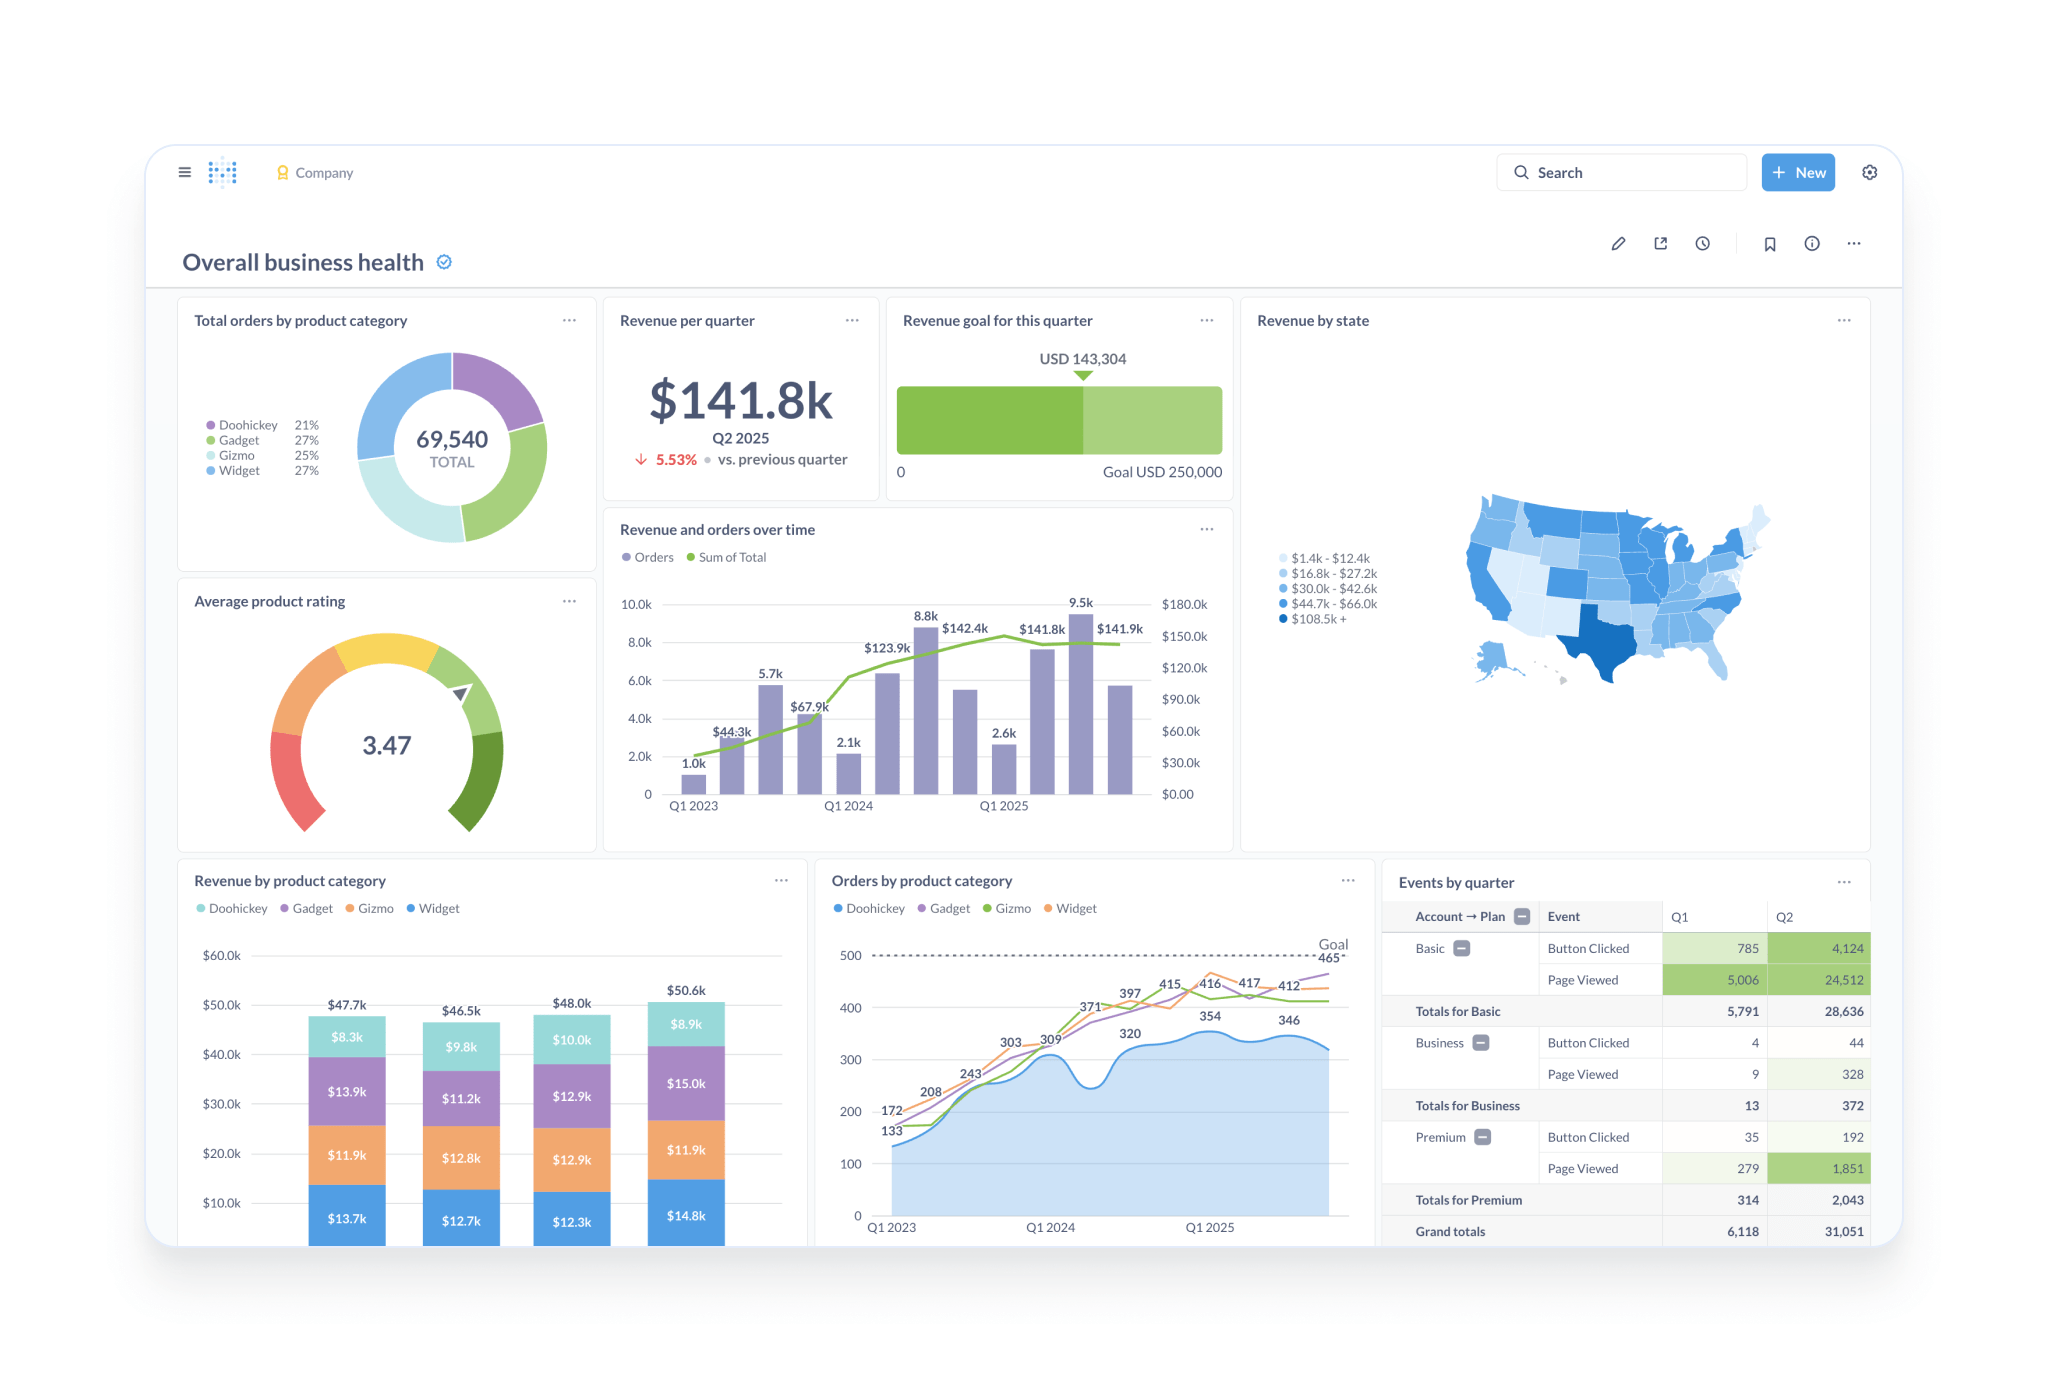 A Metabase dashboard. Source: Metabase on GitHub.
Metabase is the easiest open source BI tool for non-technical users to start with, because its point-and-click questions don't require any SQL.
Apache Superset
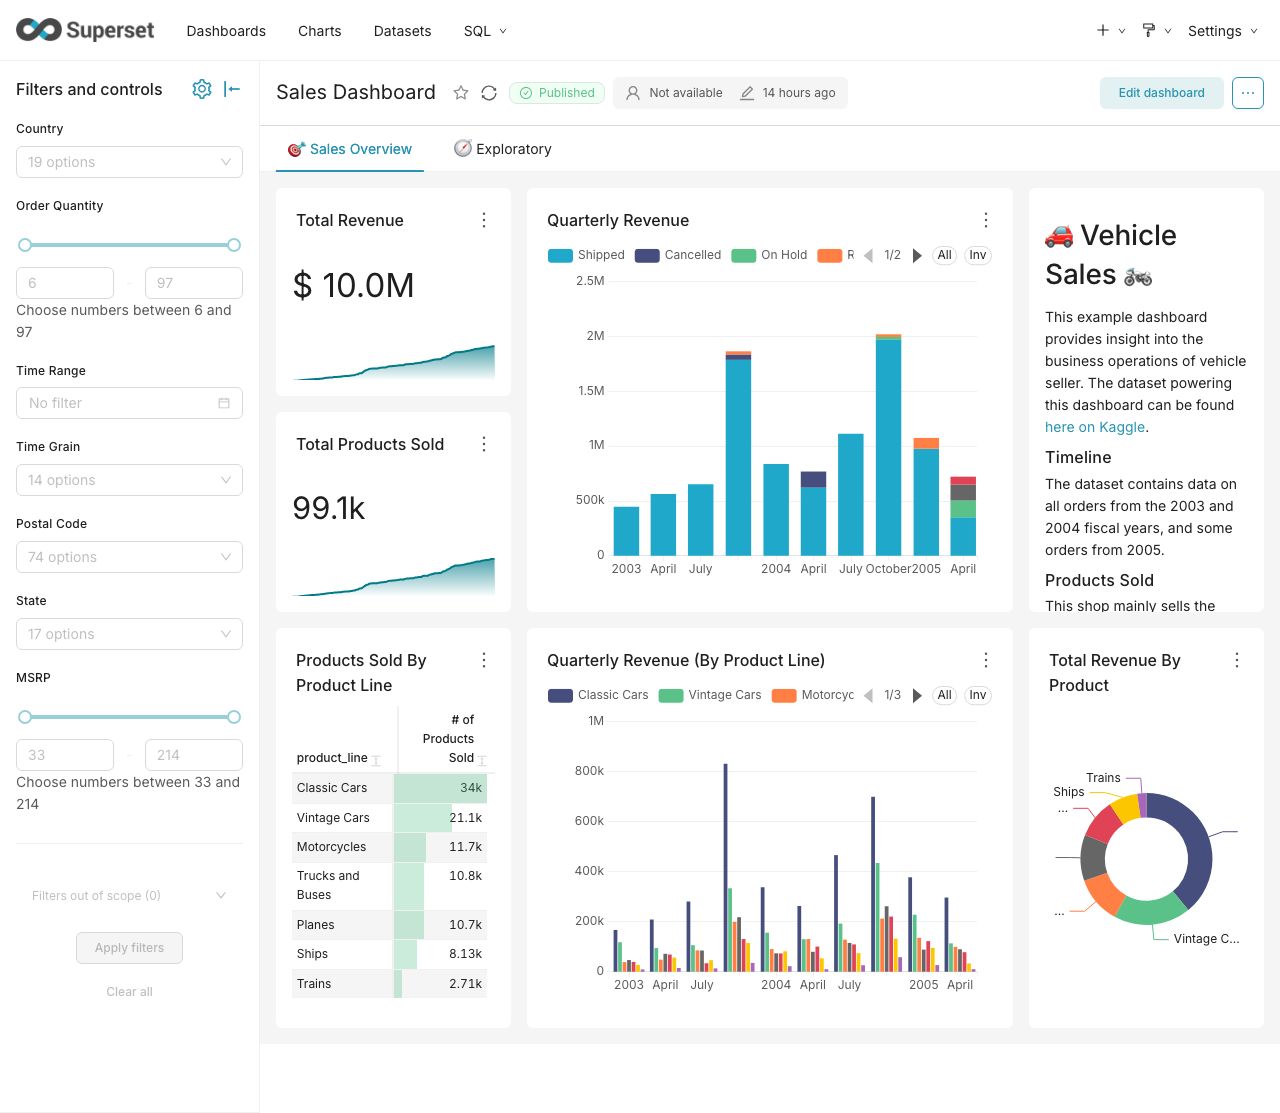 An Apache Superset dashboard. Source: superset.apache.org.
Superset is a full dashboarding platform under the Apache license and the Apache Software Foundation, with a wide range of chart types and a SQL editor for analysts.
Lightdash
 Lightdash, with metrics read from a dbt project. Source: Lightdash on GitHub.
Lightdash reads metrics and dimensions directly from your dbt project, so BI definitions live in the same repository as your models.
Evidence
 An Evidence report. Source: Evidence blog.
Evidence builds reports from Markdown and SQL files and publishes them as a static website, which suits written, narrative reporting more than drag-and-drop dashboards.
Grafana
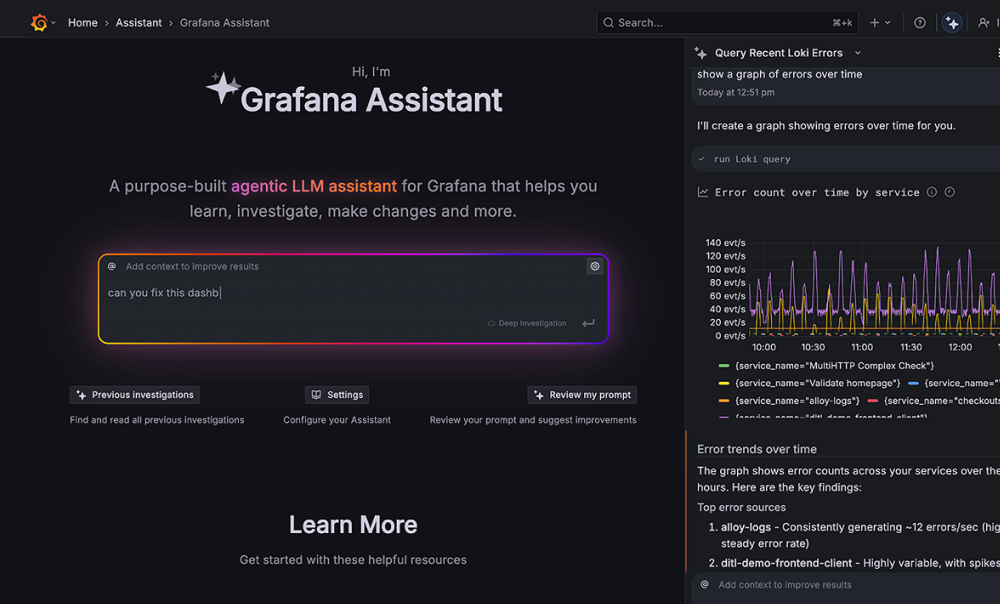 A Grafana dashboard. Source: grafana.com.
Grafana is built for time-series and operational monitoring, which makes it a strong fit for system metrics and a weaker one for business reporting.
anfra
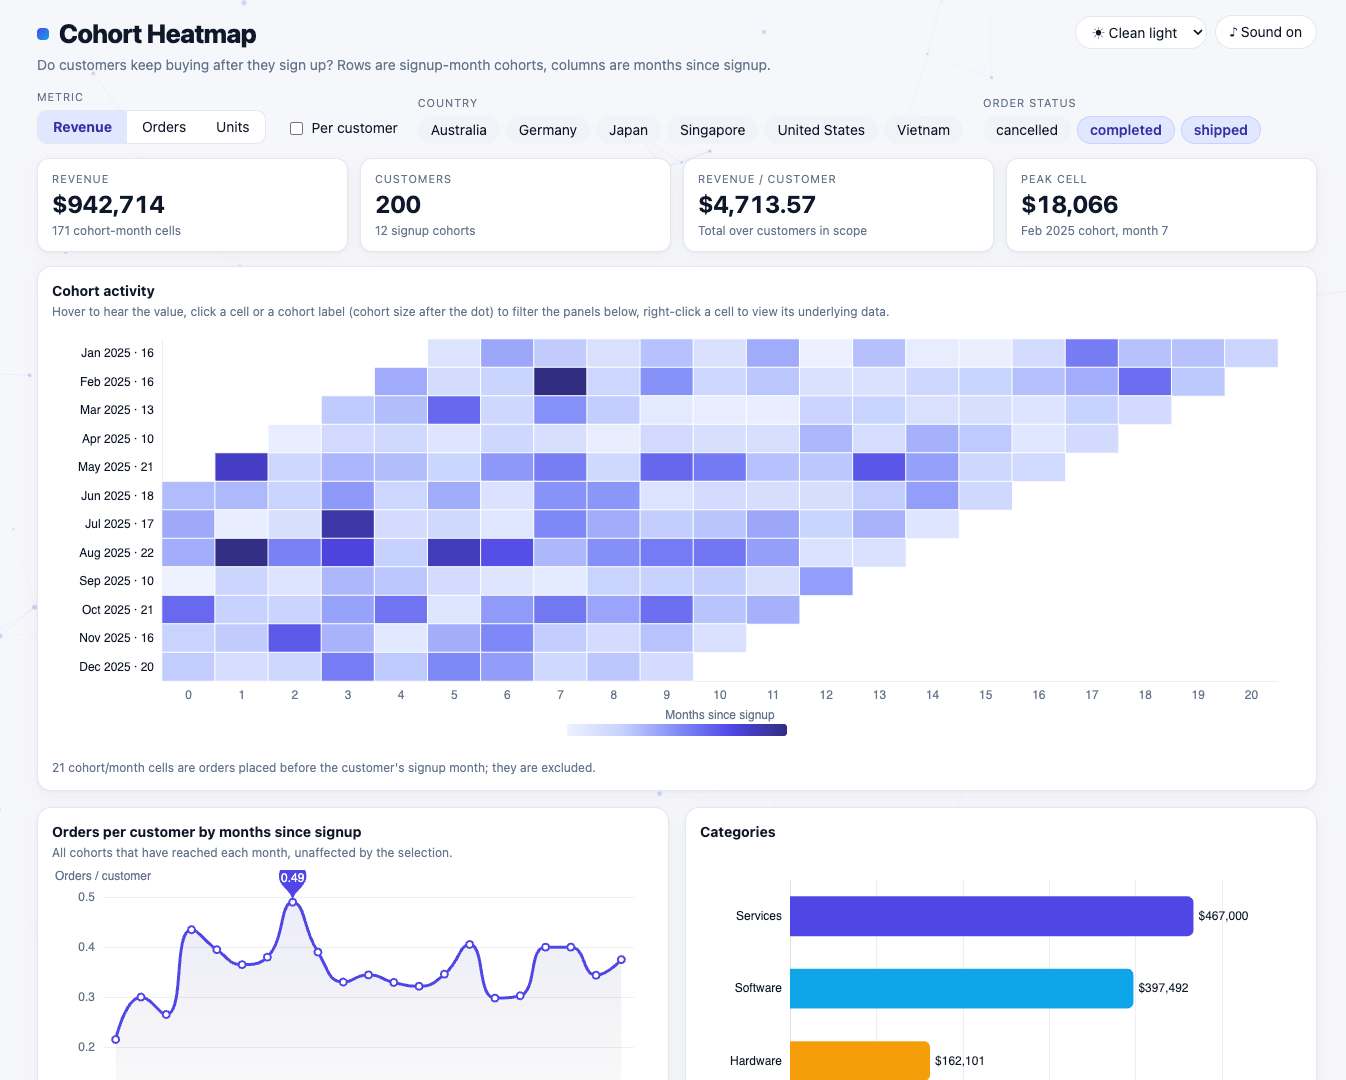 A cohort analysis app built with anfra. Source: anfra.ai.
anfra lets coding agents build fully custom analytics apps rather than fixed dashboards, with every number coming from the governed semantic layer described in the previous section.
7. Analysis layer: Best open-source notebooks and data analysis tools
Dashboards answer the questions a team asks every week, while notebooks and analysis tools answer the question someone asked this morning and may never ask again. Most analysts spend a large share of their time in this layer, and DuckDB pairs well with every coding option below, because an analyst can run SQL against a 5 GB Parquet file from inside a notebook without loading it into memory first.
pandas
pandas is the data frame library most Python tutorials, courses and libraries are written for, so it's the default starting point for analysis in Python.
pandas (BSD-3-Clause) works well up to a few gigabytes of data on one machine and connects to nearly every chart and machine learning library in the Python ecosystem.
Polars
Polars is a data frame library written in Rust that uses all CPU cores and a query optimizer, so it is often many times faster than pandas on the same machine.
Polars (MIT) suits analysts whose pandas work has started to run slowly or out of memory, and its expression syntax will feel familiar to anyone who writes SQL.
R
R was built for statistics, and its package ecosystem (including the tidyverse and thousands of statistical packages on CRAN) remains the deepest for statistical modeling and academic research.
R (GPL-2 / GPL-3) is the stronger choice when the work is mostly statistical inference rather than data engineering.
JupyterLab
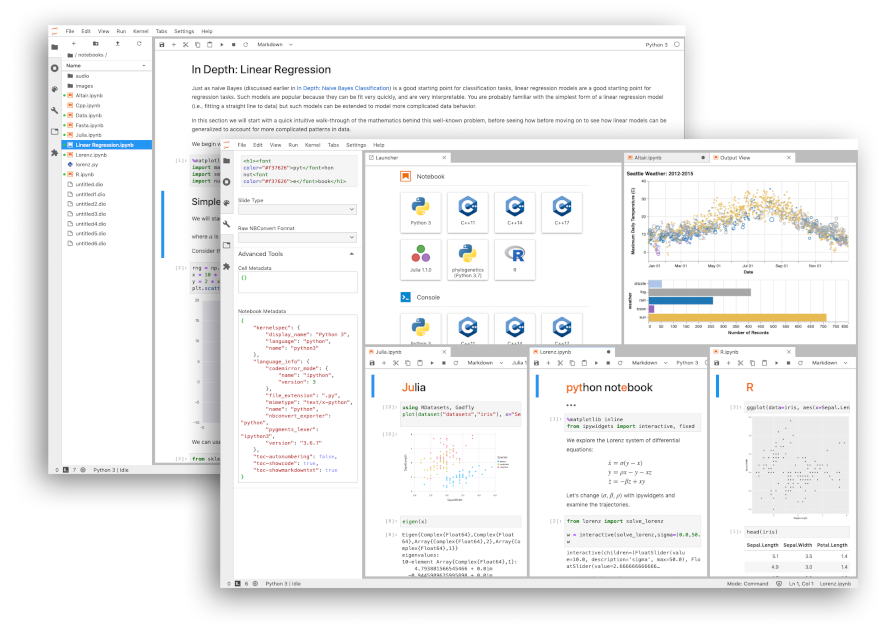 JupyterLab with notebooks, a file browser and plots side by side. Source: jupyter.org.
JupyterLab is the standard notebook environment, supported by nearly every data tool, cloud platform and course, and it runs Python, R, SQL and dozens of other languages.
JupyterLab (BSD-3-Clause) suits almost any exploratory work, although notebooks with hidden state can be hard to rerun and review once they grow.
marimo
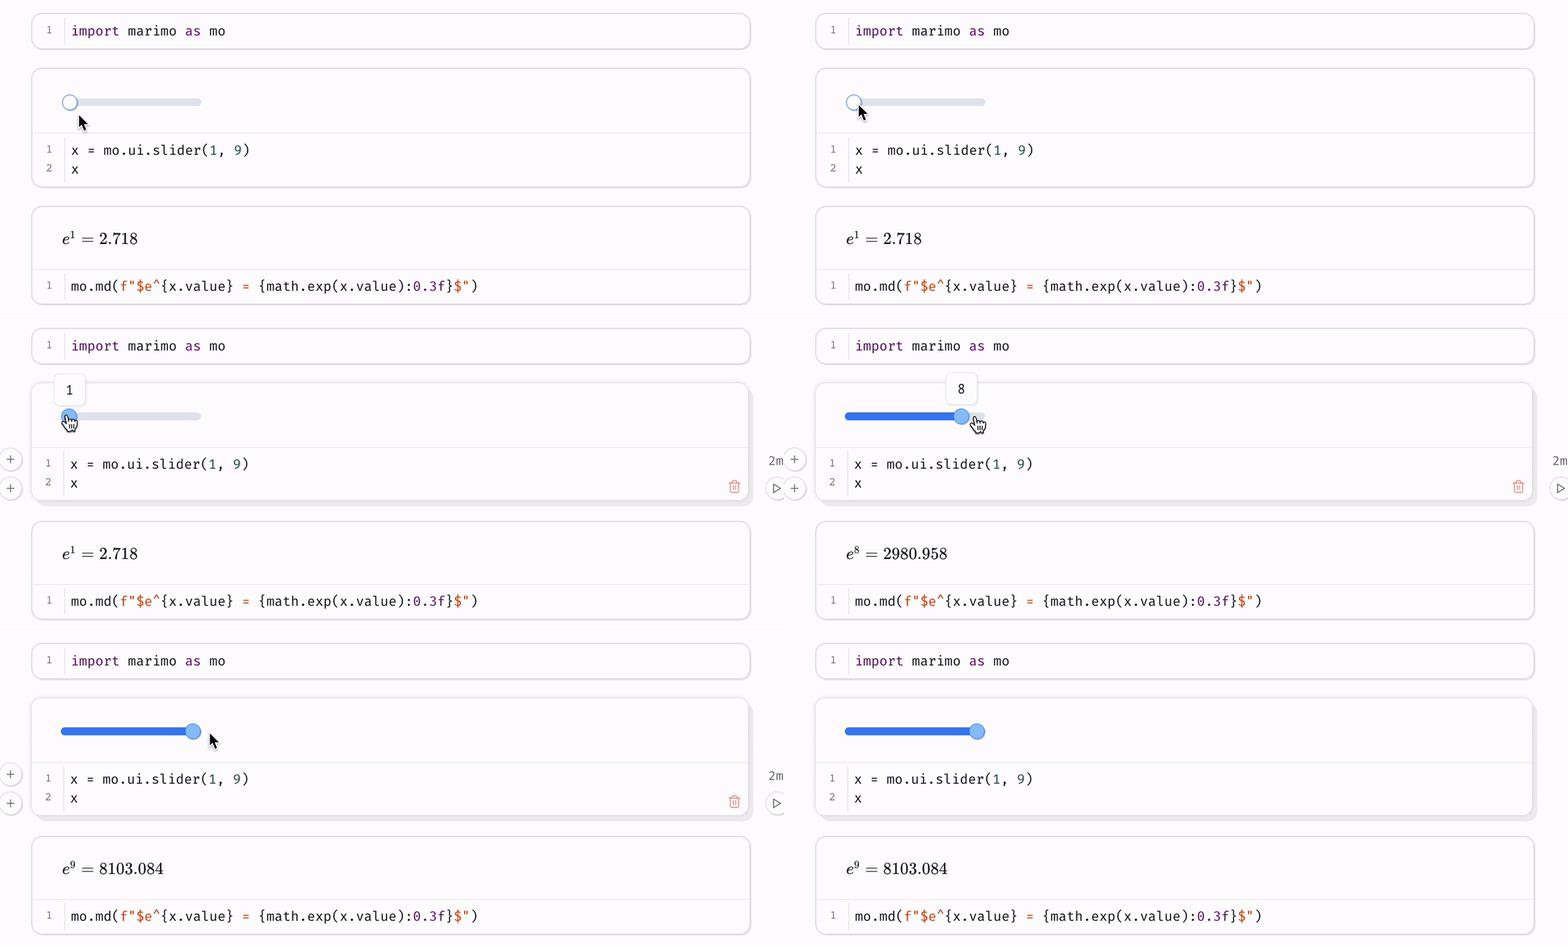 A marimo notebook, where moving the slider reruns every cell that depends on it. Source: marimo on GitHub.
marimo stores notebooks as plain Python files and reruns dependent cells automatically, which removes the hidden-state problems that make old Jupyter notebooks hard to trust.
marimo (Apache 2.0) notebooks review cleanly in Git and can run as scripts or small apps, which suits teams that want analysis to be reproducible.
KNIME Analytics Platform
KNIME builds analyses by connecting nodes on a visual canvas, covering everything from joins to machine learning without writing code.
KNIME Analytics Platform (GPL-3.0, with additional permissions for plug-ins) is free to download and use on the desktop, and KNIME charges for its team and server products.
Orange
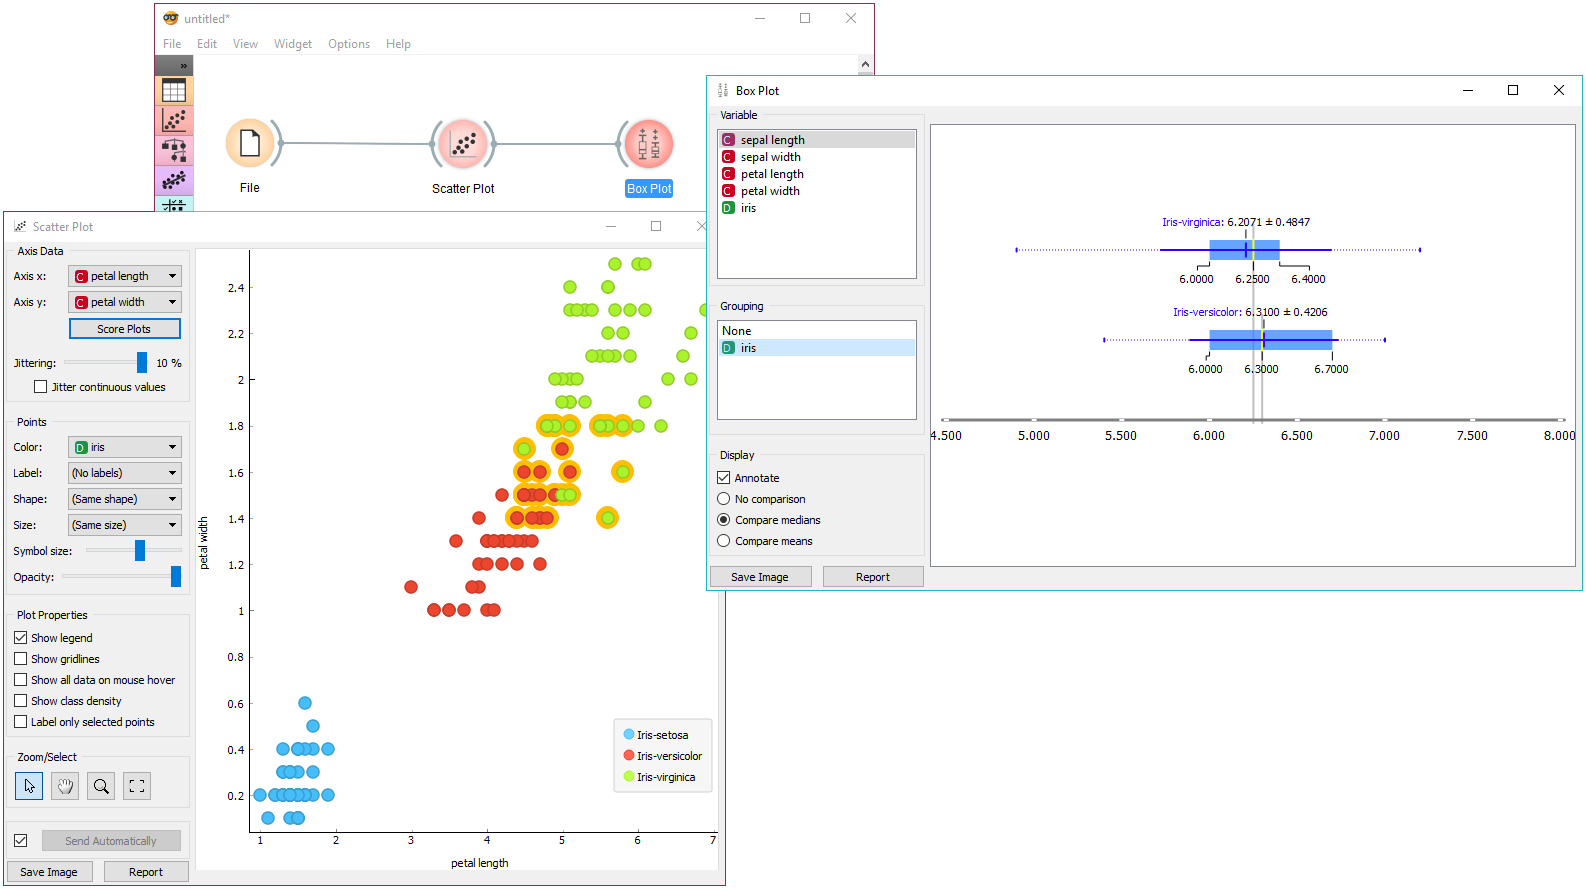 An Orange workflow, with widgets connected on a canvas and their visualizations open. Source: orangedatamining.com.
Orange is a visual tool focused on data mining and machine learning, with interactive visualizations that make it especially popular for teaching.
Orange (GPL-3.0) suits analysts and students who want to explore models visually before, or instead of, writing code.
8. Data quality layer: Best open-source data quality and catalog tools
The last layer answers two questions that get louder as a stack grows, namely whether this data is correct and which table someone should use. Small teams usually cover the first with dbt tests and the second with a shared document, and that works until the number of tables passes a few hundred or a bad load reaches an executive dashboard.
Great Expectations
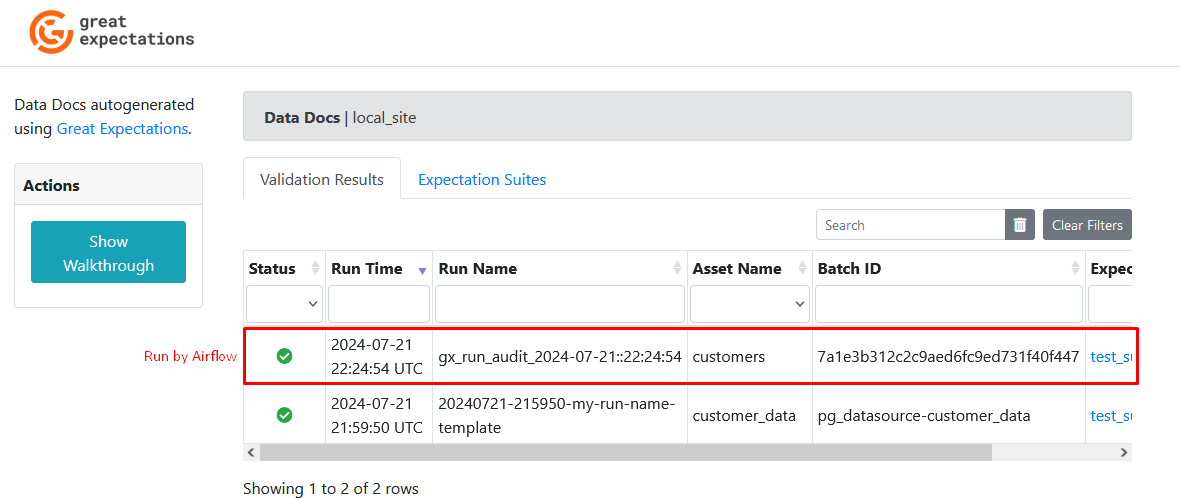 Great Expectations Data Docs, the generated site that lists validation results. Source: Great Expectations on GitHub.
Great Expectations defines expectations about data in Python and produces human-readable validation reports, which makes data tests visible to people outside the data team.
Great Expectations (Apache 2.0) validates each batch of data against those expectations, and it suits teams that want testing beyond what dbt tests cover.
Soda Core
Soda Core writes data quality checks in a compact YAML syntax, which is quicker to read and write than equivalent Python tests.
Soda Core is now published under ELv2, so it falls on the source-available side of the license table below.
OpenMetadata
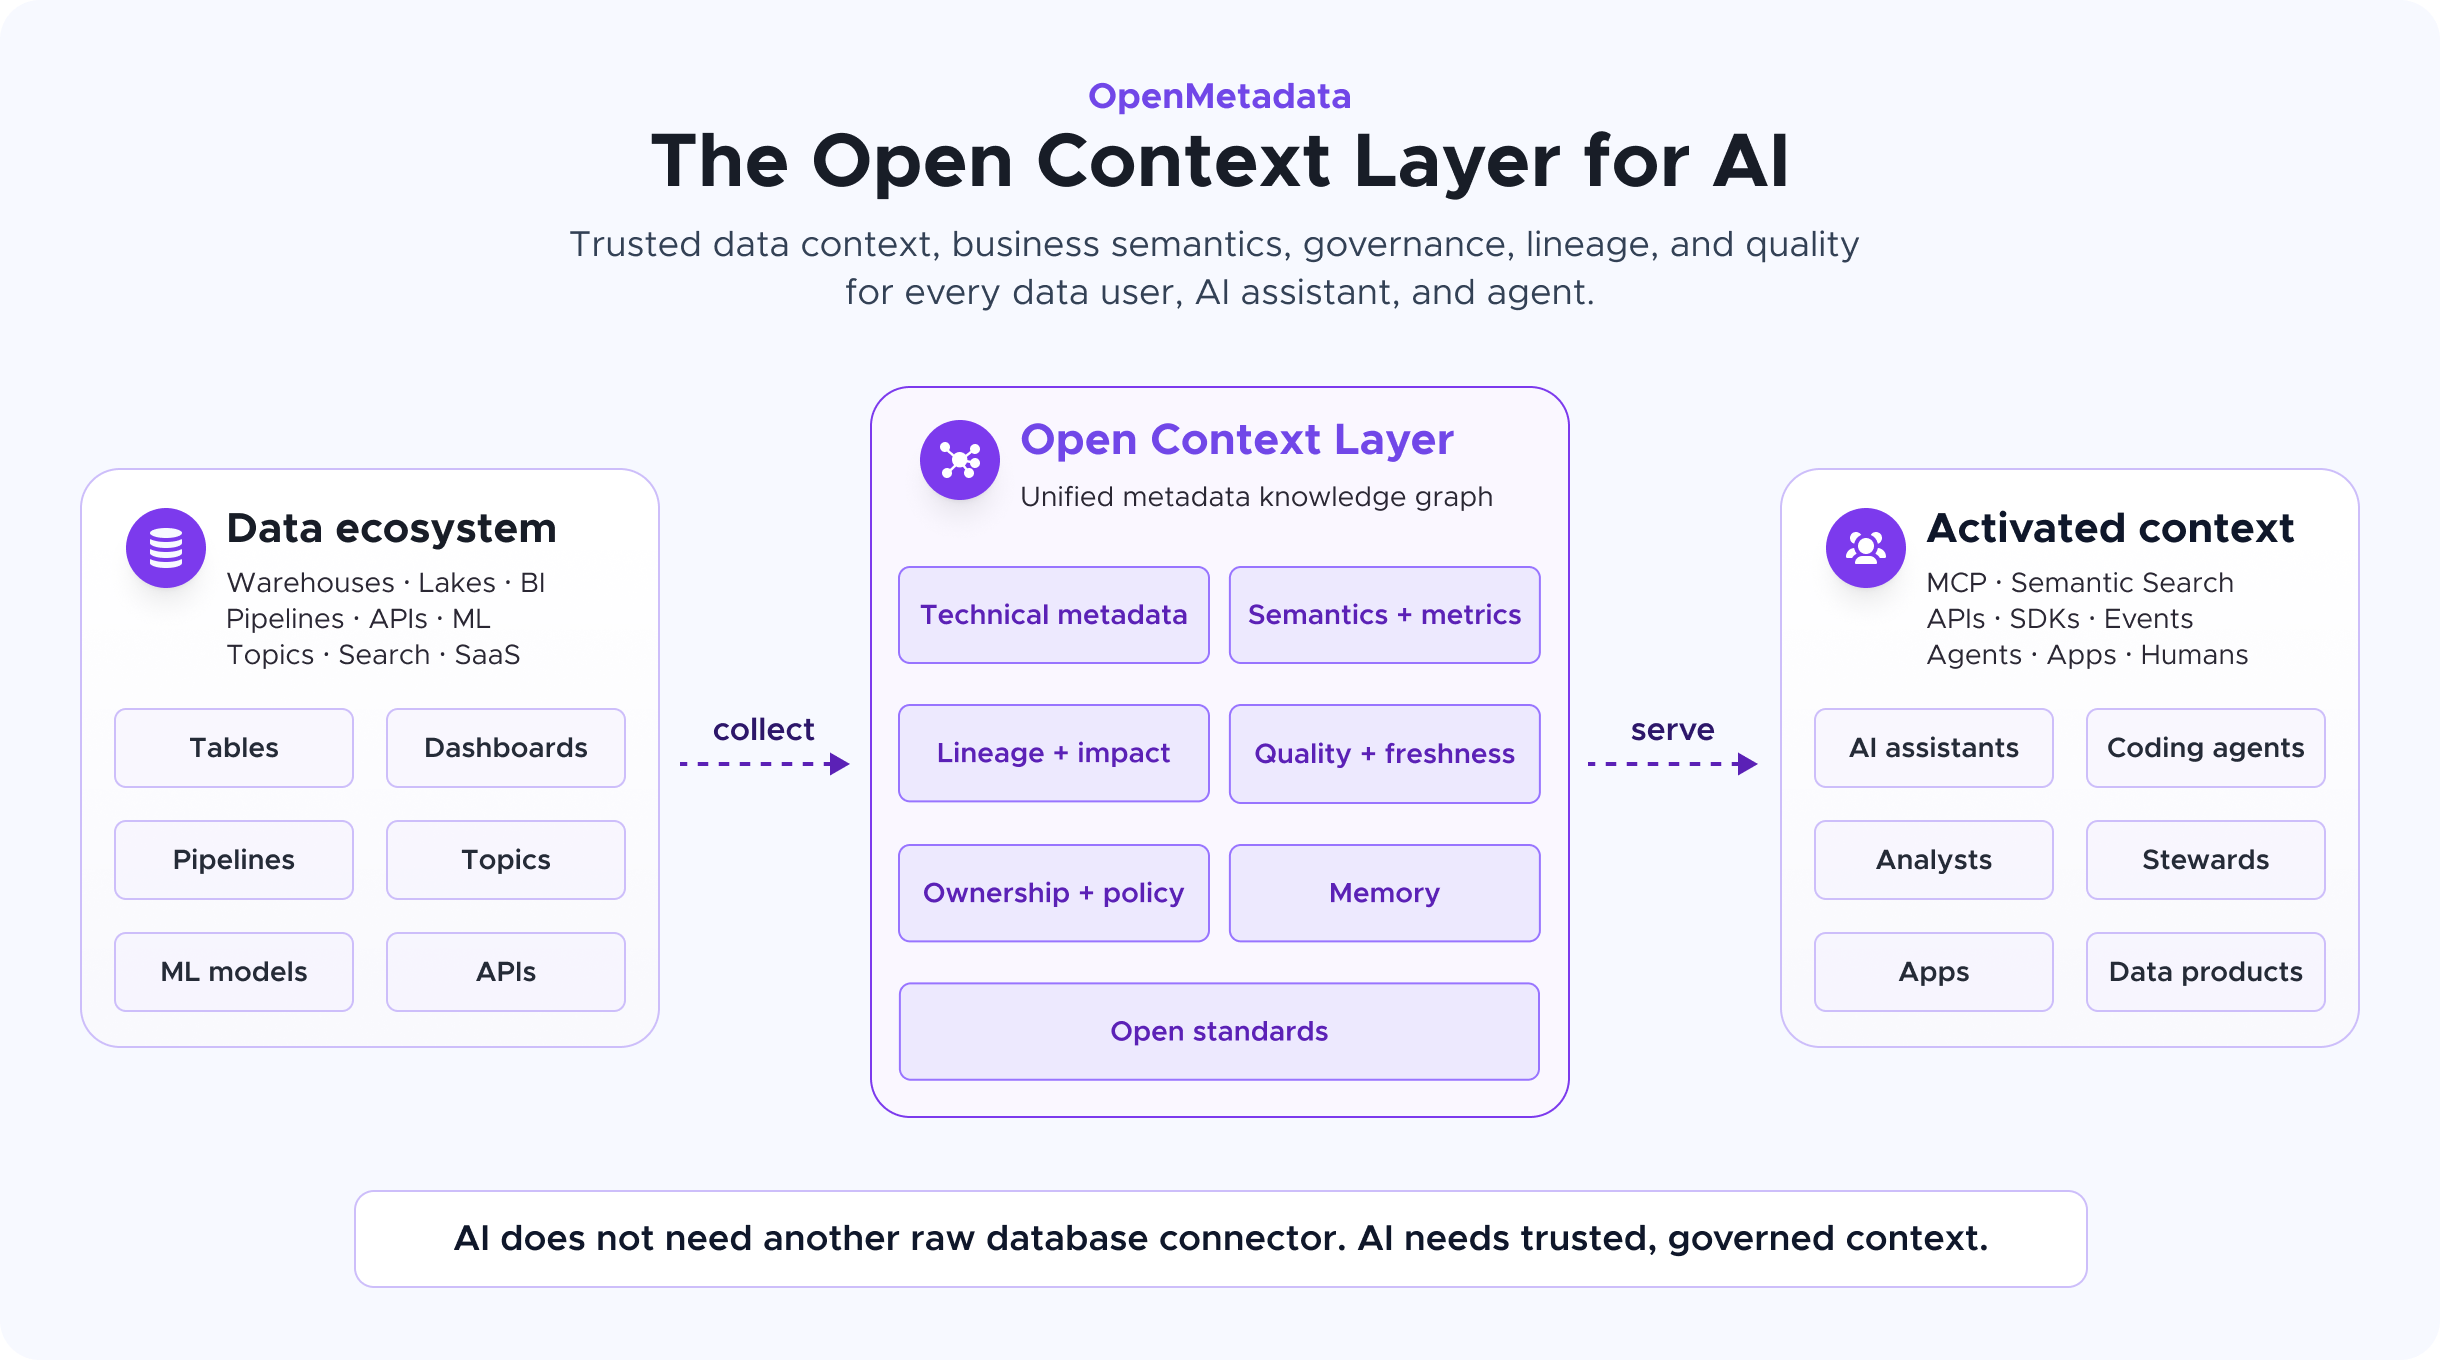 How OpenMetadata collects metadata from the data stack and serves it to people and AI agents. Source: OpenMetadata on GitHub.
OpenMetadata combines search, ownership, lineage, a glossary and data quality in a single catalog, rather than requiring a separate tool for each.
OpenMetadata (Apache 2.0) suits teams with hundreds of tables where people regularly ask which one to trust and who owns it.
Three reference stacks by team stage
The layers above are easier to judge when they're assembled, so here are three stacks we'd recommend at different stages, along with the signal that usually tells a team it has outgrown each one.
Stack 1: the solo analyst or early startup
This stack is dlt for ingestion, PostgreSQL (or DuckDB for a single analyst) for storage, dbt Core for modeling, Metabase for dashboards or Evidence for written reports, and a notebook for everything else. Every piece runs on one small server or a laptop, every tool has years of community answers behind it, and a single person can understand the whole thing. Scheduling can be a cron job that runs dlt and then dbt build.
The usual signals that it's time to move on are queries on Postgres slowing down as event tables pass a few hundred million rows, a second analyst joining and asking which metric definition is correct, or a failed nightly job going unnoticed for two days because cron had no one to tell.
Stack 2: the growing data team
At three to ten people on the data team, the stack usually gains three layers. ClickHouse (or a cloud warehouse, if the team would rather not run a database) replaces Postgres for analytical queries. Dagster or Airflow takes over scheduling, so dependencies and failures are visible in one place. A semantic layer (Cube, or MetricFlow for dbt-heavy teams) appears once dashboards, embedded analytics and ad hoc queries all need the same revenue number, and Superset or Lightdash replaces Metabase when the team wants more control over dashboards and definitions in code.
This stack tends to hold for a long time, and the pressure to change usually comes from data volume (pushing toward Iceberg plus Trino or Spark) or from the number of people asking questions (pushing toward a catalog such as OpenMetadata) rather than from any one tool failing.
Stack 3: the agent-first team
A growing number of analysts now ask a coding agent such as Claude Code or Cursor to write the analysis, the dashboard or the internal tool, and this changes which layer matters most. When an agent queries the warehouse directly, it improvises SQL for each question, and two people asking for "active customers" can get two plausible and different answers. The agent-first stack keeps ingestion and modeling the same as Stack 1 or 2 and puts a semantic layer in the path of every agent query, exposed through an MCP server, so agents request metrics by name and the layer computes them. anfra is built for this pattern (its apps can only request metrics defined in AMQL), and Cube can play the same role through its APIs. The BI layer becomes whatever the agent builds, with the semantic layer guaranteeing that every app shows the same numbers.
This stack is the newest of the three and the tools are young, so it suits teams already comfortable reviewing agent-written code and keeping metric definitions in pull requests. Our guide to data intelligence layers covers the semantic options for agents in more depth.
Open source licenses across the stack
"Open source" covers several kinds of license, and the differences matter mostly when you embed a tool in your own product or offer it to customers as a service. The table below lists the license on each non-BI tool's GitHub repository, with stars and the latest release as of October 14, 2026. License, star and pricing data for the BI tools is in the comparison table of our open source BI tools guide.
| Tool | Layer | License | License type | GitHub stars | Latest release |
|---|---|---|---|---|---|
| dlt | Ingestion | Apache 2.0 | Permissive | ~6.0k | 1.31.0 (Oct 2026) |
| Airbyte | Ingestion | ELv2 | Source-available | ~22.2k | v2.0.0 (Oct 2025) |
| Meltano | Ingestion | MIT | Permissive | ~2.7k | v4.4.1 (Oct 2026) |
| PostgreSQL | Storage | PostgreSQL License | Permissive | ~22.4k (mirror) | 18.6 |
| DuckDB | Storage | MIT | Permissive | ~42.2k | v1.5.6 (Sep 2026) |
| ClickHouse | Storage | Apache 2.0 | Permissive | ~50.4k | v26.9 (Oct 2026) |
| Trino | Query engine | Apache 2.0 | Permissive | ~13.3k | 483 (Jul 2026) |
| Apache Spark | Query engine | Apache 2.0 | Permissive | ~44.2k | v4.2.0 |
| Apache Iceberg | Table format | Apache 2.0 | Permissive | ~9.3k | 1.12.0 (Sep 2026) |
| Delta Lake | Table format | Apache 2.0 | Permissive | ~9.0k | v4.4.1 (Oct 2026) |
| dbt Core | Transformation | Apache 2.0 | Permissive | ~14.0k | v2.0.5 (Sep 2026) |
| dbt Fusion engine | Transformation | Mostly ELv2 | Source-available | ~0.7k | n/a |
| SQLMesh | Transformation | Apache 2.0 | Permissive | ~3.3k | v0.236.3 (Oct 2026) |
| Dagster | Orchestration | Apache 2.0 | Permissive | ~16.3k | 1.13.26 (Oct 2026) |
| Apache Airflow | Orchestration | Apache 2.0 | Permissive | ~47.2k | 3.3.2 (Sep 2026) |
| Kestra | Orchestration | Apache 2.0 | Permissive | ~29.6k | v2.0.6 (Oct 2026) |
| Cube | Semantic layer | Apache 2.0 (some MIT) | Permissive | ~21.0k | v1.8.6 (Oct 2026) |
| MetricFlow | Semantic layer | Apache 2.0 | Permissive | ~1.8k | v0.213.0 (Sep 2026) |
| anfra | Semantic layer / BI | Apache 2.0 | Permissive | New (launched 2026) | v0.8.0 (Oct 2026) |
| pandas | Analysis | BSD-3-Clause | Permissive | ~50.1k | v3.0.6 (Sep 2026) |
| Polars | Analysis | MIT | Permissive | ~40.1k | 2.0.0 (Oct 2026) |
| JupyterLab | Analysis | BSD-3-Clause | Permissive | ~15.4k | v4.6.4 (Sep 2026) |
| marimo | Analysis | Apache 2.0 | Permissive | ~23.2k | 0.25.1 (Oct 2026) |
| KNIME Analytics Platform | Analysis | GPL-3.0 with additional permissions | Copyleft | n/a (not developed on GitHub) | n/a |
| Orange | Analysis | GPL-3.0 | Copyleft | ~5.7k | 3.40.0 (Dec 2025) |
| Great Expectations | Data quality | Apache 2.0 | Permissive | ~11.9k | 1.24.0 (Oct 2026) |
| Soda Core | Data quality | ELv2 | Source-available | ~2.4k | v4.27.0 (Oct 2026) |
| OpenMetadata | Catalog | Apache 2.0 | Permissive | ~15.5k | 2.0.5 (Oct 2026) |
The three license types behave quite differently in practice:
- Permissive licenses (Apache 2.0, MIT, BSD and the PostgreSQL License) let you use, modify, embed and resell the software with few obligations beyond keeping the copyright notice. Most of the stack falls in this group, which is why a fully permissive stack is easy to assemble.
- Copyleft licenses (GPL and AGPL) require you to share your changes under the same license when you distribute the software, and the AGPL extends that to software offered over a network. These licenses rarely matter for internal analytics, and they matter a great deal if you plan to ship a modified tool inside a commercial product.
- Source-available licenses such as ELv2 publish the code and allow internal use and modification, but they restrict offering the software as a managed service and are therefore excluded from the OSI definition of open source. Airbyte, Soda Core and most of the dbt Fusion engine fall here. For a company running its own analytics, the practical difference is small, and for a company building a data product on top of these tools, it's worth a read by someone who understands the license.
Licenses also change. Several popular data tools have moved from permissive to source-available licenses over the past five years, which is one reason the table carries a date, and checking the LICENSE file in the repository before a large commitment takes about five minutes.
How to choose which open source data analytics tools you need
The most useful question is which layers your team needs this quarter rather than which tool is best in each layer, because every layer you add is one more thing to upgrade, monitor and explain to the next hire. A short decision path covers most teams:
- Every team needs storage, some form of BI and a way to do ad hoc analysis. PostgreSQL or DuckDB, Metabase or Evidence, and a notebook cover all three for a small team.
- A team with more than two data sources benefits from an ingestion tool. dlt suits teams that write Python, and Airbyte suits teams that would rather configure sources in a web interface and can accept ELv2.
- A team where the same SQL logic appears in more than one place benefits from dbt Core or SQLMesh, and it's usually the highest-value layer to add after the basics.
- A team where several tools, products or agents read the same metrics needs a semantic layer, and the choice between Cube, MetricFlow and anfra mostly follows from what else is in the stack (standalone APIs, dbt or coding agents).
- A team whose jobs depend on each other and fail silently needs an orchestrator, with Dagster for asset-centric dbt shops, Airflow where engineers already know it, and Kestra where non-engineers edit workflows.
- A team with billions of rows or data spread across many systems can look at ClickHouse, Trino, Spark and an open table format, and should expect to dedicate engineering time to running them.
- A team that embeds analytics in its own product or resells it should check every license in the stack, with particular attention to AGPL and ELv2 components.
A practical way to start is with the smallest stack that answers this quarter's questions, adding a layer only when one of the signals above shows up, so the stack grows at the pace the team can maintain it. If open source isn't a hard requirement, our guide to the best BI tools covers commercial options for each part of the reporting layer.
FAQ
What is some free data analytics software?
Most of the tools in this guide are free to download and use. For a single analyst, a common free setup is DuckDB or PostgreSQL for storage, Python with pandas or Polars in a JupyterLab or marimo notebook for analysis, and Metabase or Apache Superset for dashboards. KNIME Analytics Platform and Orange are free options for analysts who prefer a visual, no-code interface.
Is KNIME free to use?
KNIME Analytics Platform, the desktop application, is free to download and use under the GPL-3.0 license, with additional permissions that cover plug-ins. KNIME's paid products cover team collaboration, scheduling and deploying workflows on a server.
What are the best open source data analysis tools for beginners?
Beginners who want to learn to code usually do well with Python, pandas and a notebook (JupyterLab or marimo), plus DuckDB for practising SQL on local files. Beginners who would rather avoid code can start with KNIME or Orange, both of which build analyses by connecting blocks on a canvas, and with Metabase for building charts from a database.
Is Python a data analytics tool?
Python is a general-purpose programming language, and it becomes a data analytics tool through open source libraries such as pandas and Polars for data frames, NumPy for numerical work, Matplotlib and Plotly for charts, and scikit-learn for machine learning. Together with a notebook environment, these libraries make Python the most widely used open source option for ad hoc data analysis.
Where can I find open source data analytics tools on GitHub?
Every tool in the license table above has a public GitHub repository except KNIME, which publishes its source elsewhere, and PostgreSQL, whose GitHub repository is a read-only mirror. Curated lists such as awesome-open-source-data-engineering on GitHub are a good way to discover tools beyond this guide, although star counts and the date of the last release are worth checking before adopting anything from them.

Data Engineer turned Product; writes SQL for a living.