The Magic Money Machine Model
This is part of a series on business fundamentals for data professionals.
Last week, on improving communications with business users, I argued that there are two ways that data analysts may improve:
- You get better at understanding the businessperson’s model of the world. This means that you understand how he or she views things, which then allows you to build conceptual bridges between what you understand to what he or she wants to know.
- You get better at communication itself. This includes things like visual communication — that is, being good at picking the right visualisation for the right kinds of data —but it also means getting good at communicating with people.
We then discussed the Ladder of Inference, which was a technique from the second category.
Let’s talk about the first category today.
The Magic Money Machine
To communicate better with business people, you need to learn their worldview.
In other words, you need to understand the mental model of the business that they hold in their heads when they are talking to you.
When you understand how businesspeople see the world, your job becomes much easier:
- You will know why they’re asking you for a certain metric, because you know how it fits into the model in their head.
- You may predict what follow-up metrics they are likely to ask for.
- And you will quickly figure out what they’re expecting to see (or what their assumptions are!) when they ask you for something and you hand over a dashboard or report.
One simple model that most businesspeople hold in their heads is what I’ll call the magic money machine model.
Imagine that you have a black box with a slot in the front and a slot in the back. You put in $1 into the slot in the front, and the machine whirs. After a few seconds, it spits out $1.30 through the slot out the back.
“That’s magical!” the crowd screams. “Do it again!”
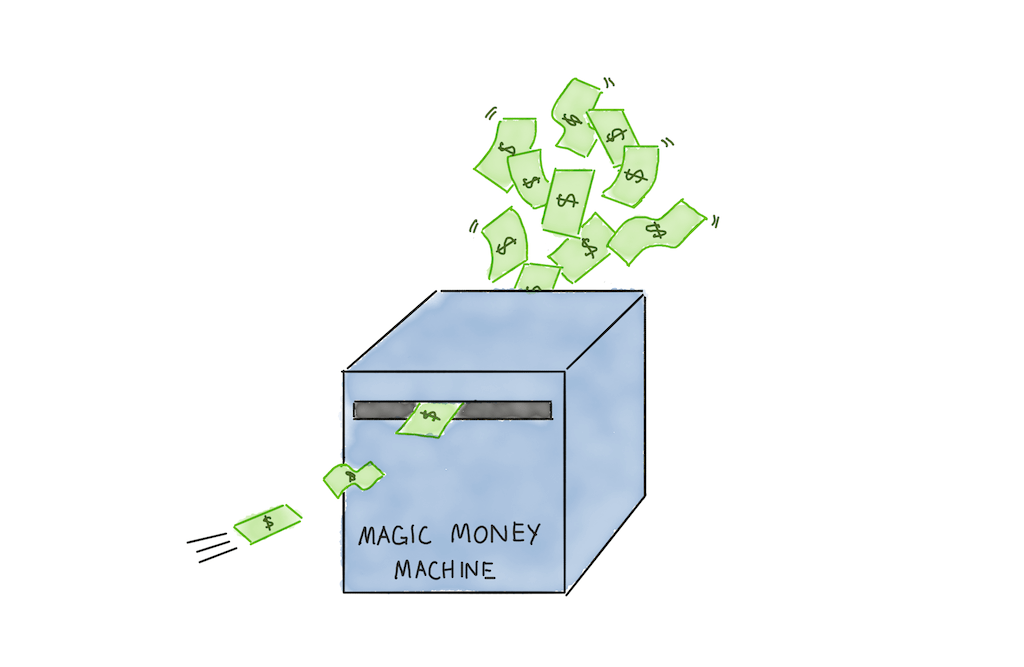
You do it again, and out comes $1.24.
You realise that you can do this all day. And so you set up camp and build a shelter for your box, and you begin to study it carefully.
Over time, you learn that the machine spits returns between $1.10 to $1.30 per dollar that you put in. You average this out to $1.20, and say that the machine gives you an average return of 1.2x.
This mental model is the basic model that many businesspeople have of their businesses.
Every Business Is The Same Inside
In essence, a business is a box that takes in money on one end, and spits out more money on the other.
Good businesses take in a dollar and spit out many times more money. These are companies like Coca-Cola, and American Express, and Apple. Bad businesses take in a dollar and spit out less money. These are companies like WeWork and Moviepass and GrubHub.
A business is a box that takes in money on one end, and spits out more money on the other.
Not all businesses generate a return on each dollar from the beginning. Mature businesses tend to spit out a larger stream of cash. Younger, less mature startups tend to consume a ton of money for growth, with the hope that — come a certain day — the business will turn around and will begin to generate more cash for every dollar that is put in.
This sounds simple, but it can be surprising how deeply this model of the world affects business behaviour. For instance:
- Your CEO will evaluate company spending and ask herself: is the amount of money I’m spending going to result in higher returns later? Should I allocate the company’s money differently?
- Investors evaluate your company’s earning potential by looking at how much money might be generated for every dollar put into the business. This means that …
- Startup founders will try and show metrics that speak to this model, which implies that …
- Your KPIs and metrics will be measured — or manipulated! — according to how it affects the overall picture of the money machine.
Of course, there are businesspeople who don’t think in terms of the money machine model. These businesspeople tend to be operators in smaller companies. Lower level managers also tend to think more in terms of KPIs and departmental objectives. But climb high enough in the company’s hierarchy and you will eventually find someone — or many someones — who think this way. And in fact, even if the company is a joke and nobody is thinking about financials, you can be sure that the bulk of the company’s investors will think in terms of this model.
You can’t escape the magic money machine model in business — once you understand it, it is everywhere you look.
The Proper Name: Return on Invested Capital
So what’s the proper name for this magic money machine model? The proper name is: return on invested capital.
ROIC is a subtly different concept from revenues or profits. Revenues are the amount of money your company makes. Profits are how much you make after you subtract costs from revenues. But ROIC is a measure of efficiency — that is, for every dollar that you spend in the business, how much profit does it bring in?
If you’re interested in a comprehensive description, you can read up on ROIC over at Investopedia. But it is not necessary to do so: as a data professional, you merely need an intuitive understanding of this worldview.
This box is the model that hangs out at the back of every savvy businessperson’s head. It is what is taught to first and second year students in business school. It is the foundational worldview on which all other business worldviews are built.
Why This Matters To The Data Analyst
So why is this important to you as a data analyst? Well, every metric that is asked of you will somehow lead back to this mental model of the business! Think about it:
- Marketing spend determines how much it costs to land a new customer.
- Product metrics like activation and retention will determine how efficiently you spend those customer acquisition dollars.
- Detailed product measures like engagement metrics will tell you how effectively the product is serving paying customers.
- Sales salaries will determine the eventual gross margins of the product.
- And so on.
You don’t have to worry about the magic money machine model directly, of course. As a data professional, your job is to return numbers to the relevant operators in your company’s business. They, in turn, will use your information to make tweaks to their operations.
But you should understand this fact about business: eventually, your numbers are going to make their way up to company leadership, and they are going to contribute to a mental model of the entire business. More often that not, that model is going to take the form of a magic money machine.
If you understand this, you’ll begin to see how your work fits into the worldviews held by the most important businesspeople in your company. You may begin to see why they act the way they do. Your businesspeople may ask for operational numbers, and they may be evaluated on narrow KPIs. But behind it all is the logic of ROIC. It permeates the air of business like oxygen; you can’t really go far without it.
This is part of a series of posts that explain business fundamentals to the data professional. For more updates, subscribe to our newsletter below: