The Goldilocks Rule of Getting Data Driven
Have you ever played table tennis?
Imagine you’re a recreational table tennis player. You’re not great, but you’re not a noob either. You’re just decent, like most casual players.
(You can pick any other sport, or even video games for this example, by the way. I just chose ping-pong because I am a recreational player, and I like playing it very much).
Now imagine two scenarios:
In the first scenario, you’re playing against your neighbor, who is a complete beginner. This person has played very little ping-pong before. He flops his serves. He holds his racket wrongly. He can’t recognize if you’re doing a top spin or a back spin. His return will always hit the net whenever you do a back spin.
Scenario two, you’re playing with Ma Long, one of the world’s best table tennis players. He’s basically the Federer or Nadal equivalent of table tennis. This time, though, you look like the complete noob. You can hardly return his serves even though you recognize the spin. You play full-on defense hoping that he’ll make a mistake. But guess what: Ma Long doesn’t make mistakes.
Which scenario would you prefer to play?
My take: Neither.
You can probably guess at why. You’ll be bored to death in both games. One is too easy, and the other is just too hard — so hard that you’ll give up.
(Well except when you’re playing with your 10-year old son and you’re busy pretending to lose every point, in which case you’re not exactly competing, but just spending quality time with your kid. But I digress.)
I think for most casual players, the right choice is usually: you should compete with an opponent who is just marginally better than you. That is, you win some points, you lose some points. You are 100% engaged, and you’re even likely to improve your ping-pong skills over a period of time.
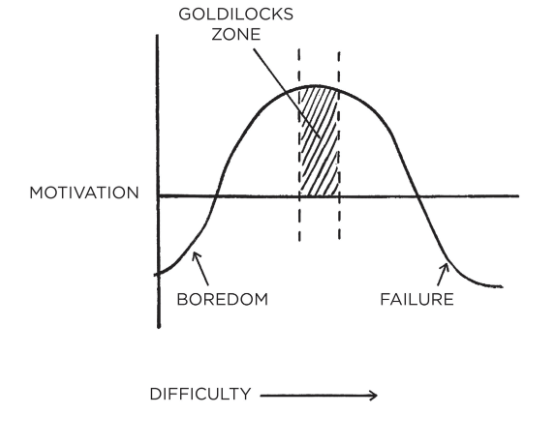
I’m referring specifically to the Goldilocks Rule: When learning or training for something new, you are most engaged when the task is at the edge your abilities.
In other words, the task is not too easy, and not too hard. It’s just right. It’s slightly more than your current abilities. With a little concentration and training, you think you can get there. You believe you can get there. You’re motivated to get there.
It turns out that the Swedes have a term for this: “lagom”. Technically it means “just enough” or “in moderation”. It goes back to the time when the Vikings passed their horns around for everyone to drink their share. So you drink your fill, then pass to the next guy and say “Here. Lagom.” — Ok I made up the last part, I’m not sure if you actually need to say anything. Most likely no.
Now. What does this have to do with a data blog, you ask?
Well, data is a learnt skill, too.
If you’re a data analyst getting into the space, I think there are plenty of resources catered for that (this one from Matt Arderne is a good one).
But what about the business users trying to be more “data-driven”? What is a Goldilocks-zone curriculum for business users getting into data? These people aren’t trying to be full-time data analysts, they just want data to support their decisions.
Surprisingly (or unsurprisingly?), I’ve found nearly no good training resources for this group of people. I don’t mean to say that no one has ever built such a thing, for if this were the case, we’d have no numbers-driven business executives. I just mean to say that I can’t seem to find one that’s public and generalisable and useful.
Anecdotally, Amazon is famous for printing a metrics deck at every WBR meeting. I wonder if they have a proper “data-driven” training curriculum for their incoming business executives, or is it all tacit knowledge?
Then, we've also talked a lot about self-service BI before. Mode’s Benn Stancil wrote a few months ago that “self-service is a feeling”, and my colleague Cedric built on that to say “self-service analytics is a business state”, where “the business is sufficiently data-driven, but the data org does not look like an army of English-to-SQL translators”
How many BI tools are built with this end-state in mind? And how do you accomplish it?
I’ve been thinking about this a lot, ever since we started doubling down on ‘self-service BI’ as our core positioning. But I’m not hung up on features alone. ‘People, process and then tools’ are a thing for a good reason — you have to help the people first.
How might we teach generalizable data skills to business users? What is a Goldilocks-zone curve of progression? Can we build that into the BI tool itself? Or must it be an educational add-on? I don’t know which of these directions are fruitful, but we’re currently investigating them. I hope to share more with you in the next couple of weeks, when we have something more concrete.
I'll leave you with those. I know this post has more questions than answers, but questions are all I have so far. If you have thoughts on those, let me know.