Clearer Communication: How To Use The Ladder of Inference When Communicating Data To Your Business Users
This is part of a series on business fundamentals for data professionals.
One of the biggest challenges that you’ll face as a data analyst is being able to successfully communicate challenging, nuanced, abstract pieces of information to your business users.
After all, it doesn’t matter how good you are at data modeling or at writing SQL if you can’t get important business information into the hands of a decision maker.
So how do you do this?
There are, I think, two large components to this skill, at least in the context of business intelligence:
- You get better at understanding the businessperson’s model of the world. This means that you understand how he or she views things, which then allows you to build conceptual bridges between what you understand to what he or she wants to know.
- You get better at communication itself. This includes things like visual communication — that is, being good at picking the right visualisation for the right kinds of data —but it also means getting good at communicating with people.
This post is about a technique that belongs to the second category.
Let’s get started.
The Problem
It’s a fairly common experience to be in a discussion where two people are arguing past each other.
Perhaps Mary wants to know what the most effective channels for marketing spend are. And perhaps Joe is interested in campaigns for the next quarter. They spend 20 minutes arguing about different things, before you step in to point out that Mary is benchmarking recent data against previous quarters, while Joe is extrapolating from current data into the future. Mary and Joe are both responding to the same data set, but they are using it for different purposes — which leads to lots of little conflicts that they can’t seem to square with each other.
This is a simple example of a miscommunication. But there are worse forms of miscommunication, which result in long, unproductive, drawn-out meetings. These miscommunications are usually subtle in nature. For instance, if someone is walking through raw data without interpreting it, they may come into conflict with another person who glances at the data and then immediately says “oh, I guess this campaign isn't a good use of our money.” These sorts of misunderstandings are particularly common when you’re working in business intelligence, because you deal with complex information, long rows of numbers, and tricky analyses.
The Solution
So how to do you prevent this from happening?
In 1974, business professor Chris Argyris developed a thinking tool called ‘The Ladder of Inference’ (sometimes called the ‘Ladder of Inquiry’) — a metaphorical model that describes how people think when presented with new information. The ladder itself isn’t particularly new, because similar ideas exist in cognitive science, psychology, and even artificial intelligence. But the reason the ladder of inference is useful in a way that these other models are not it because it is a simple illustration of the various ways humans process information, and therefore the various ways that miscommunication may occur.
The ladder looks like this:
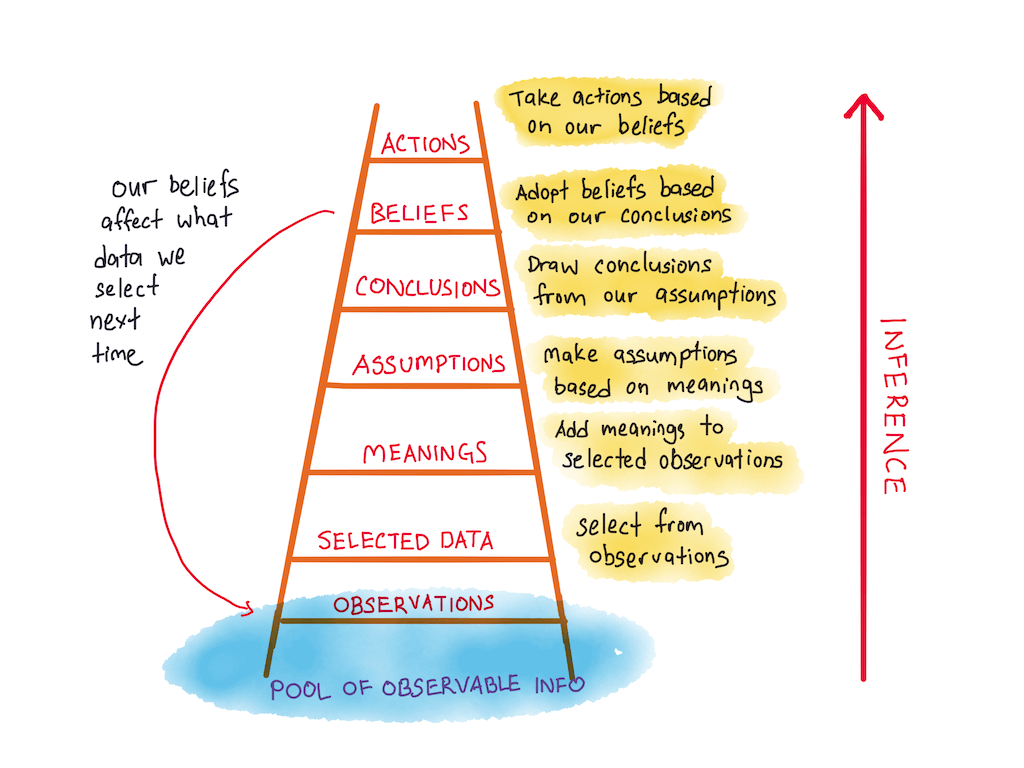
- At the bottom rung is the pool of possible observations that can be made of the world.
- Above it are observations that you (or your team) have made from this pool — perhaps because you've decided to measure or record them.
- Above those observations is selected data — that is, the subset of observations that you have chosen to focus on (this is a natural limitation: human beings are unable to make sense of too many observations at once).
- Once you have selected some data to focus on, you attempt to add meaning to these observations.
- Then, you make assumptions based on those meanings.
- Eventually, you draw conclusions from these assumptions.
- Your conclusions calcify into beliefs about the world.
- Finally, you take actions based on those beliefs.
The ladder tells us that miscommunications occur when two people are on different levels of the ladder during a discussion. For instance, Mary might be looking at marketing data and going “What can we conclude from this? What factors are causing these downward trends in marketing returns?”, while Joe jumps in with “Ahh, the trend seems to be down for Google Ads, we’re throwing all that cash down the drain! Why not switch to Facebook instead? We can drive better targeting by using our email list!”
The ladder tells us that miscommunications occur when two people are on different levels.
In this particular case, Mary is at the level of making meaning from data. She’s not sure that the data is saying what she thinks it’s saying. Some trends seem to say ‘Google Ads isn’t working’; while others show promising conversion results, and might mean ‘our positioning sucks given the demographics our keywords are targeting.’
Meanwhile, Joe has glanced at the data, filtered it through his experiences running ad campaigns for various successful startups over the past five years, and leapt straight through from assumptions to conclusions.
The point isn’t that Mary is right and Joe is wrong — for all we know, Joe is making the right conclusions here, because he’s aided by the superior assumptions he is able to draw from his experience. But Mary and Joe are likely to talk past each other and to clash horribly in the ensuing discussion, because they are operating at different levels on the ladder. In fact, their argument may stretch the entire length of the meeting unless one of them stops to ask: “wait, which level on the ladder of inference are you at?”
(In practice, nobody actually talks like that; what you’re more likely to hear is: “Hold on, Joe, you’ve concluded that Google Ads isn’t working, but you need to bring us along on your reasoning. Mary is still trying to extract meaning from the data, and she hasn’t drawn any conclusions yet. Could you engage with her on the possible alternative explanations she’s looking at?” This intervention can be performed by a third-party, and is more natural than talking about an abstract idea like the ladder.)
Actionable Uses For The Ladder
We may now see why the ladder of inference is so useful:
- When you hear a long, drawn out disagreement between two team members, and it sounds like they are talking past each other, interject and clarify which levels of the ladder each member is on. If person A’s objections are at a lower level on the ladder, this must be dealt with first before advancing the discussion upwards.
- When you are presenting ideas, make sure to bring the audience along from observation, meaning, all the way up to beliefs, conclusions and recommended actions. This is particularly important if you are presenting to people who do not share your worldview, or if you are discussing insights drawn from complicated data.
- The ladder also implies that you should be careful when jumping up the levels. Sometimes this is good — quick leaps might mean that you have expertise in the area and are drawing on your experience — but other times it just means that you are doing sloppy thinking.
- You may also consider teaching the Ladder of Inference to your team. This typically only takes a couple of minutes at the start of a meeting. What this then allows you to do is to say “so I’m at the assumptions level here, and I think that …” which makes it clear to everyone which level you’re thinking at.
Of course, teaching the whole ladder to your team might be a bit much. But even if you keep the ladder within your head, you may still be useful to those around you: you may, for instance, step in to clarify positions whenever you see two people going at it for what seems like hours (point 1, above). Having a mediator who is trained in the Ladder of Inference often makes a world of difference during internal meetings.
The ladder also clarifies for us one other aspect of business life: when we say that someone is a ‘good communicator’, what we really mean is that the person is able to quickly and accurately identify where on the ladder their counter-parties are at, and is then able to adapt the discussion to bring them along.
As a data analyst, the Ladder of Inference is useful because it helps you with communication. And communication is ultimately what determines your effectiveness as a data person within your organisation. Give the ladder a spin, and see if it helps you with your career. You might be surprised at what you find.
This is part of a series of posts that explain business fundamentals to the data professional. For more updates, subscribe to our newsletter below: