How Metrics Change When Your Company Grows
This is part of a series on business fundamentals for data professionals.
Last week, we looked at return on invested capital, or ROIC. We called it the ‘magic money machine model’, and argued that it was one of the most important, foundational views of a business that a business person will have.
But if ROIC is so important, why is the startup press not particularly interested in it? Why do so many reports discuss other metrics, like gross merchandise value, or top line revenue growth?
Well, there are two answers to this.
The first answer is that ROIC is not a particularly sexy topic to discuss. Uber doesn’t get extra points for saying “we delivered a 2.3x return on invested capital this year!” (which they didn’t) — instead, it gets in the news for fighting city governments.
(Also, ROIC takes work to calculate; such startup numbers aren’t easily available to journalists).
The second answer is that ROIC isn’t important at the beginning of a company’s life. Sure, it hangs in the background, and it motivates the thinking of a company’s investors. But the truth is that it is impossible to know what a startup’s eventual ROIC would be in the early years of its life.
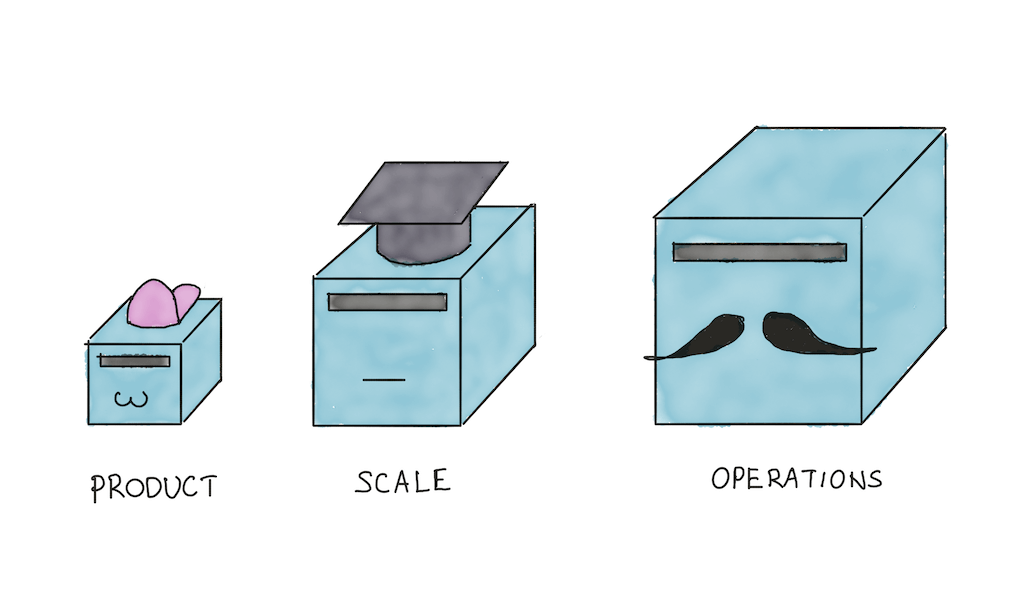
To understand this further, you should know that startups go through roughly three stages of life:
- The Product Stage.
- The Scale Stage.
- And finally the Operations Stage.
As a data professional, you should understand what each of these stages imply, because the metrics that you look at for each stage will be different.
Let’s explore what this means.
The Product Stage
The product stage is the first stage of a startup’s life.
This is when the company is trying to find ‘product-market fit’. That is, you are attempting to build an offering (a product or service) that people want to use.
Naturally, the metrics that you look at during this stage are all oriented around product usage.
These are metrics like:
- Retention — which tells you that users are continuing to use the product over time, and are gaining value from it.
- Activation — which tells you what problems exist in the onboarding flow of your product, that prevent people from using it in the first place.
- Usage metrics — which tells you which features are used the most, and which suffer from usability or value problems.
Notice that people aren’t particularly worried about margins, profits, revenues, or ROIC at this stage — it is simply too early to care.
The Scale Stage
The scale stage occurs after you’ve built a product that people want to use.
In this stage, the main challenge is to build a solid go-to-market motion. This means creating a sales process that is scalable, and looking for a bunch of marketing channels that are reasonably cost effective.
Of course, product development continues to occur in the background, which means that all the product-related metrics that you set up in the previous stage are still in play.
But the real difficulty at this stage of the company’s life is the search for a healthy source of growth. Naturally, your metrics focus will shift to metrics that measure the performance of these growth efforts. These metrics are things like:
- Customer acquisition cost — how much it costs to acquire a new customer. This may be calculated by combining new revenue measures with fully-loaded costs of sales and marketing.
- Marketing channel performance — this includes cost per ad channel, but it also includes things like content performance, if you have a content marketing strategy.
- Sales metrics — like the number of new opportunities per time period, or number of deals won.
- Viral coefficient — this measures the number of new customers that are brought in by existing customers. It is only valid for certain types of products, where a viral loop is possible (think: Facebook or Dropbox invites).
At this stage of the company, ROIC begins to rear its head. Board members will watch the amount of money your company is spending on all its growth initiatives, and begin to ask themselves if they can imagine a future in which the company generates more money than it spends.
You may discover that company leadership becomes mildly interested in cloud costs — “How much are we spending on AWS? We don’t have to redo everything now, but would we be able to rearchitect later?” — and they may keep an eye on marketing spend, even as they’re trying to find a growth strategy that works.
The Operations Stage
The operations stage is when your company reaches scale.
At this stage, the focus is on margins and unit economics. This is when you want to demonstrate to investors that the business can generate good returns on invested capital. In particular, if your company intends to go public, it needs to show numbers that indicate good business fundamentals.
What metrics matter here? The answer, of course, are metrics related to efficiency. If a business is a machine that takes in money and generates more money, then the focus is on increasing the ratio of returns.
Therefore, the metrics are things like:
- Cloud and other infrastructure costs — You want teams to be aware of how much infrastructure they’re paying for. Netflix, for instance, pipes data infra costs straight to every data team member in the company. This allows them to keep an eye on the amount they'd have to pay when they provision machines for data analytics.
- Marketing efficiency — The goal here is to keep an eye on how much the marketing organization is spending in order to drive new customers to the sales org. This metric is more important during the Operations Stage than it is during the Scale Stage, because the focus during the Scale Stage is on finding a marketing approach that works; the focus on the Operation Stage is on fine-tuning what already works.
- Sales efficiency — Similarly, the amount of money it takes to close a lead becomes important during this stage. Sales orgs are likely to ask for metrics around sales performance on a periodic basis. And management is likely to use this data to adjust compensation.
Closing Remarks
In practice, the stages tend to bleed into each other. You may be asked to set up a dashboard with basic marketing metrics during the Product Stage, before it is really needed, and you may be tasked with keeping track of cloud costs during the Scale Stage, when it’s not yet critical to control costs.
The point I'm making is that ROIC is what every company will be evaluated on … eventually. It is easy to forget this fact in the first two stages of a company’s life. And it’s easy to focus only on product metrics, or scale metrics, without any thought to how they fit together as a mental model of the entire business.
Fundamentally, these shifts in product metrics occur because shareholders (and therefore investors) are driven by a worldview defined by ROIC.
So it’s not crazy when we say that ROIC is the foundational worldview behind business; when a business person asks you for a certain metric, you may now know why they’re asking for it. And sometimes, if you’re observant enough, you may even predict the request before it happens.
This is part of a series of posts that explain business fundamentals to the data professional. For more updates, subscribe to our newsletter below: