Top BI & Reporting tools for Amazon Athena

Amazon Athena has been largely famous for its ability to query large dataset stored in Amazon S3. Since Athena is server-less, you can quickly query your data without having to setup and manage any servers or data warehouses.
It uses Presto DB SQL syntax so there's no huge learning curve if you're used to traditional databases like MS SQL Server or MySQL Servers.
In this blog post, I will introduce to you the best BI & reporting tools that can leverage Athena's unique power. Please note that the tools listed below are of no particular order.
Top BI & Reporting tools for Amazon Athena
- Holistics
- Looker
- Chartio
- Mode
- Redash
Choosing the right BI tool for your organization can be extremely tricky, so we dedicate another article on this topic, check it out here: Navigating The Business Intelligence Tool Space
1. Holistics
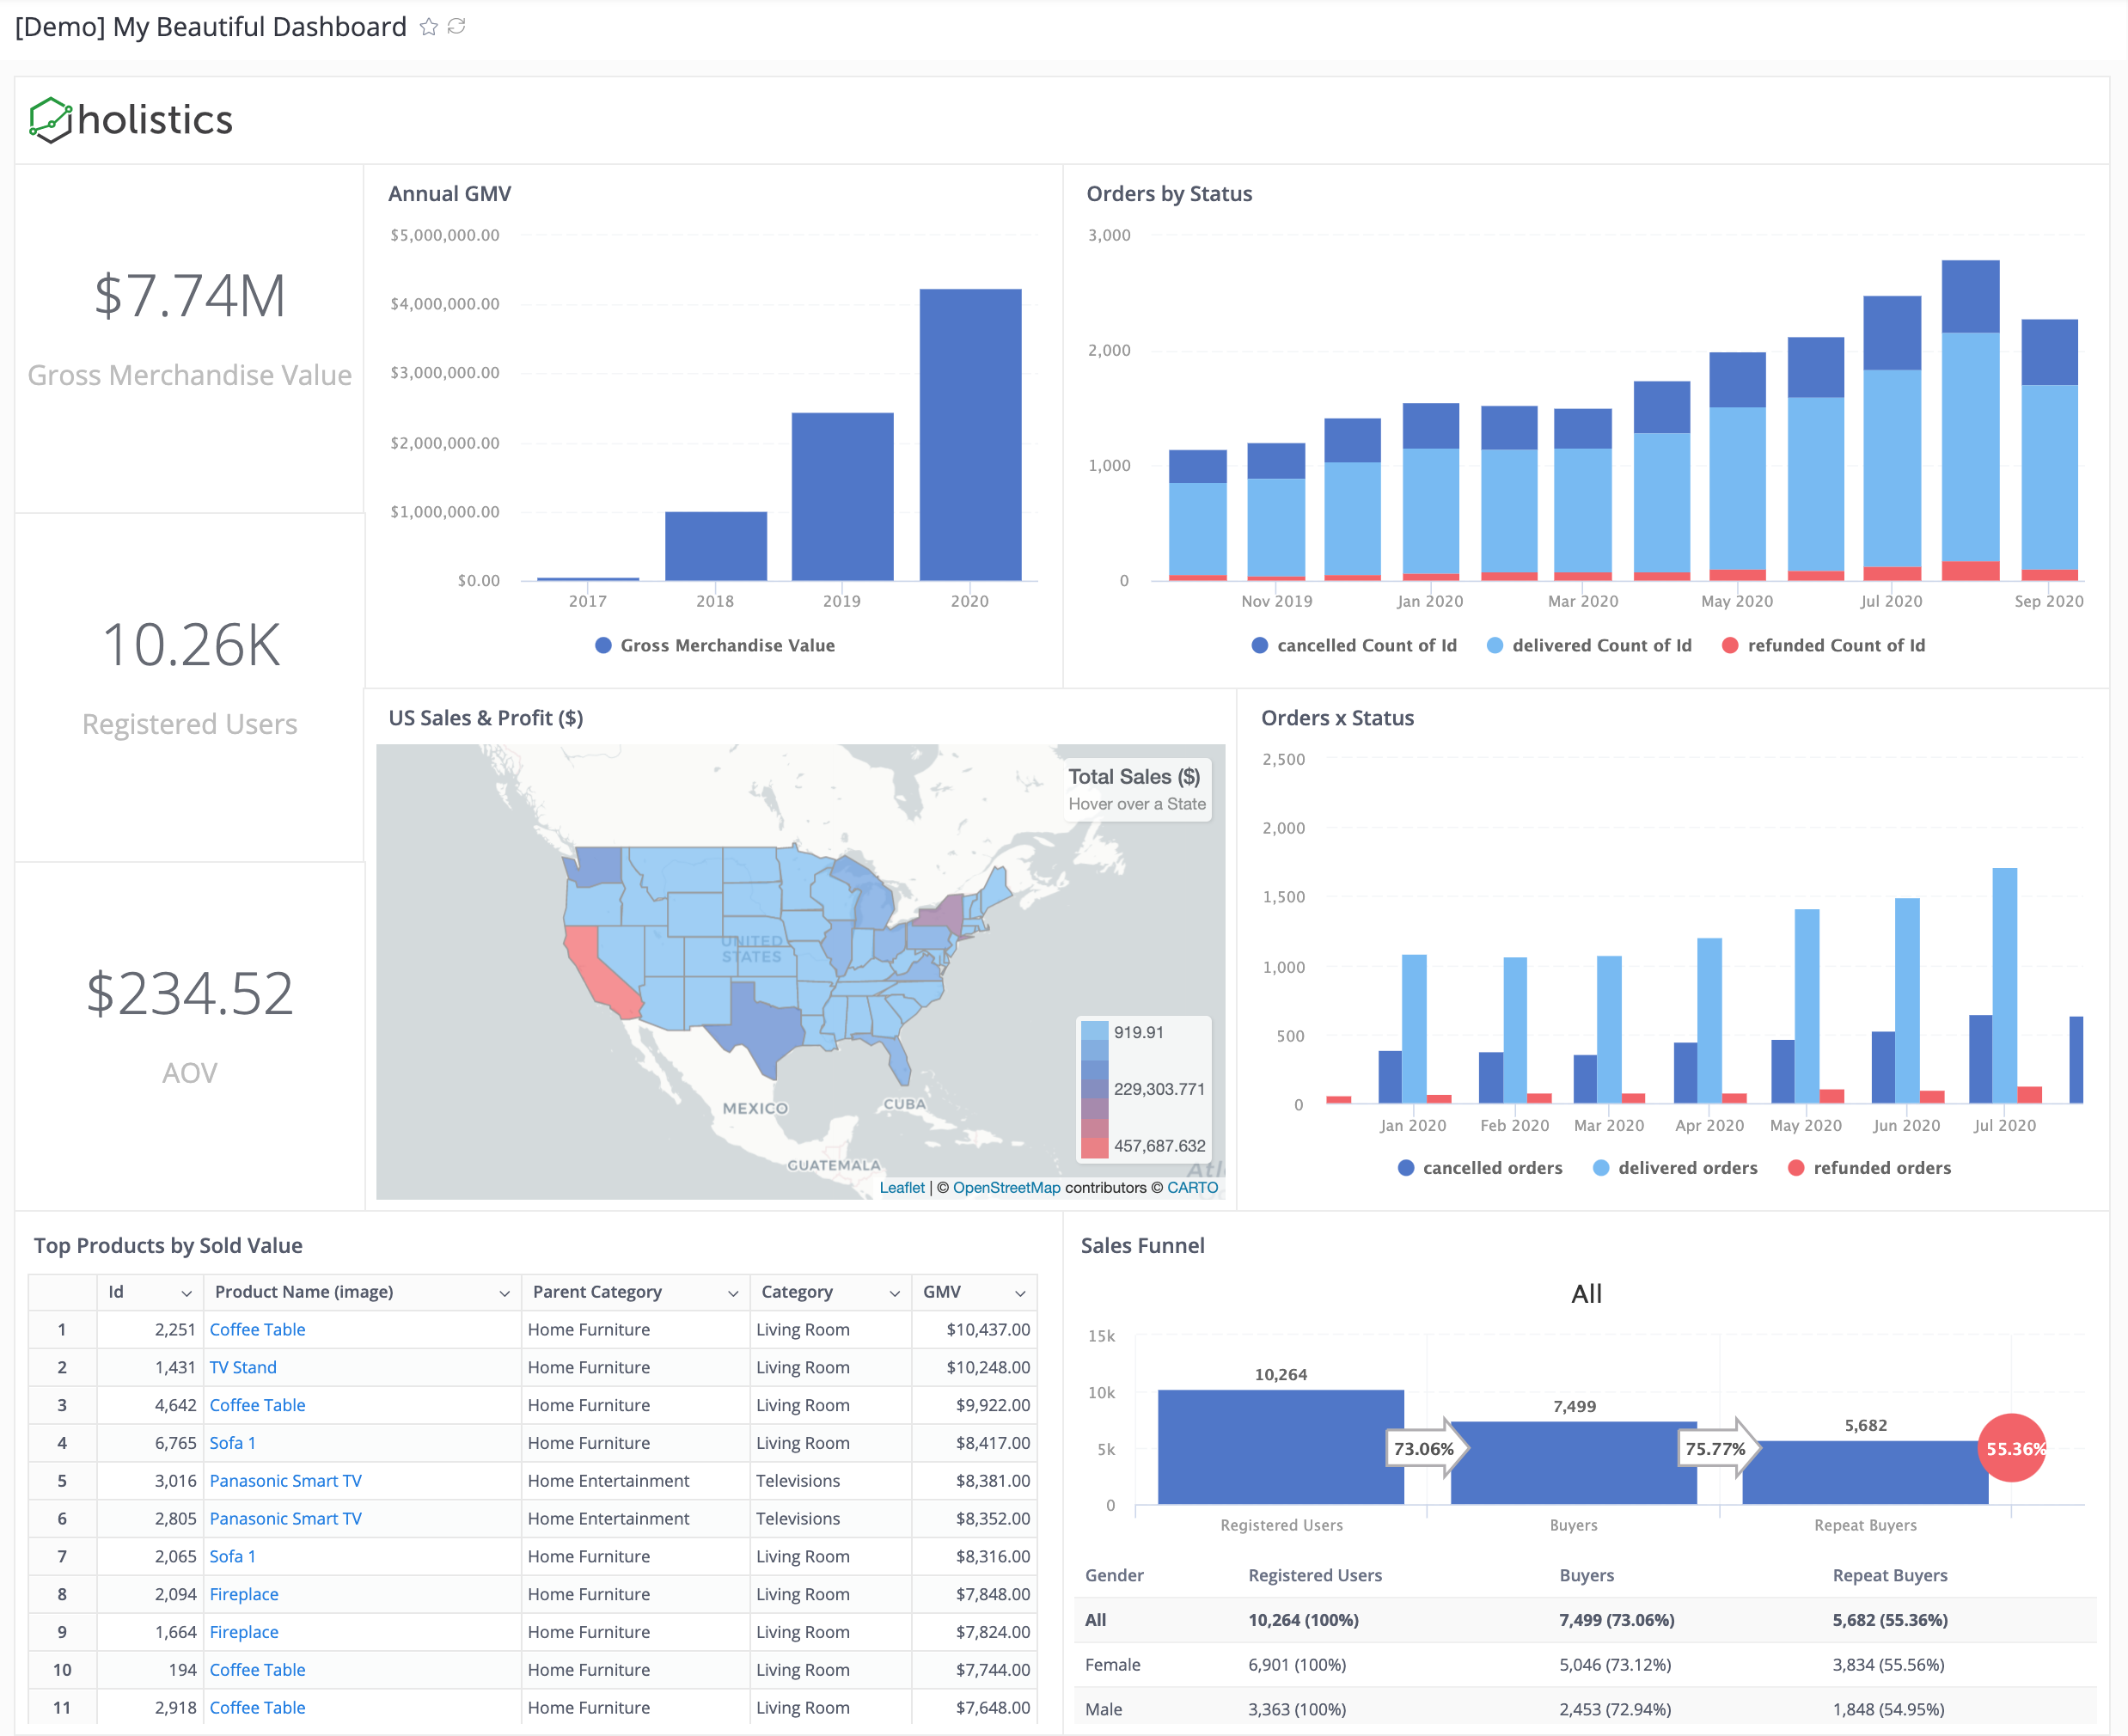
Holistics is a self-service BI tool that lets data analysts model and transforms data in Redshift easily. At the same time, non-technical users can explore the data and find insights on their own using a drag-and-drop interface.
Holistics pledges to become a self-service BI tool with a powerful data modeling capability, which can help analysts create a single source of truth where you can apply business logic to your own data and make sure it is accurate, maintainable, and re-usable.
Follow their instruction here to connect Holistisc to Amazon Athena.
Pros
- Allow you to query Athena using customizable SQL queries and get fast results with its cache layer
- Materialized views of query results are stored back to your own SQL database, for immediate access and fast visualizations and reports.
- Automated scheduling of reports and dashboard with the latest data in Redshift, sent directly to your email inbox.
- Advanced SQL Editor: Version History, Autocomplete, SQL Snippet, Highlighting, Auto-formatting, Query History, Custom Advanced Logic...
- Drag-and-drop interface for business users to explore data and generate reports to answer ad-hoc questions.
- Competitive pay-as-you-go pricing model, which only scales as your company scales.
- Have a custom-built DSL layer (called AML) to perform mapping between database tables and business logic, thus it's more flexible and customizable.
- Git Version Control to track every change, perform branching, code reviews to ensure accurate analytics workflow
Cons
- A lot of advanced analytics features and chart types are still under development.
- Holistics has not supported Git-integration and version control, which is preferable to a lot of advanced analysts.
- Dashboards are not as interactive as other competitors'. Currently Holistics only supports drill-down by date and drill-through to another dashboard.
2. Looker
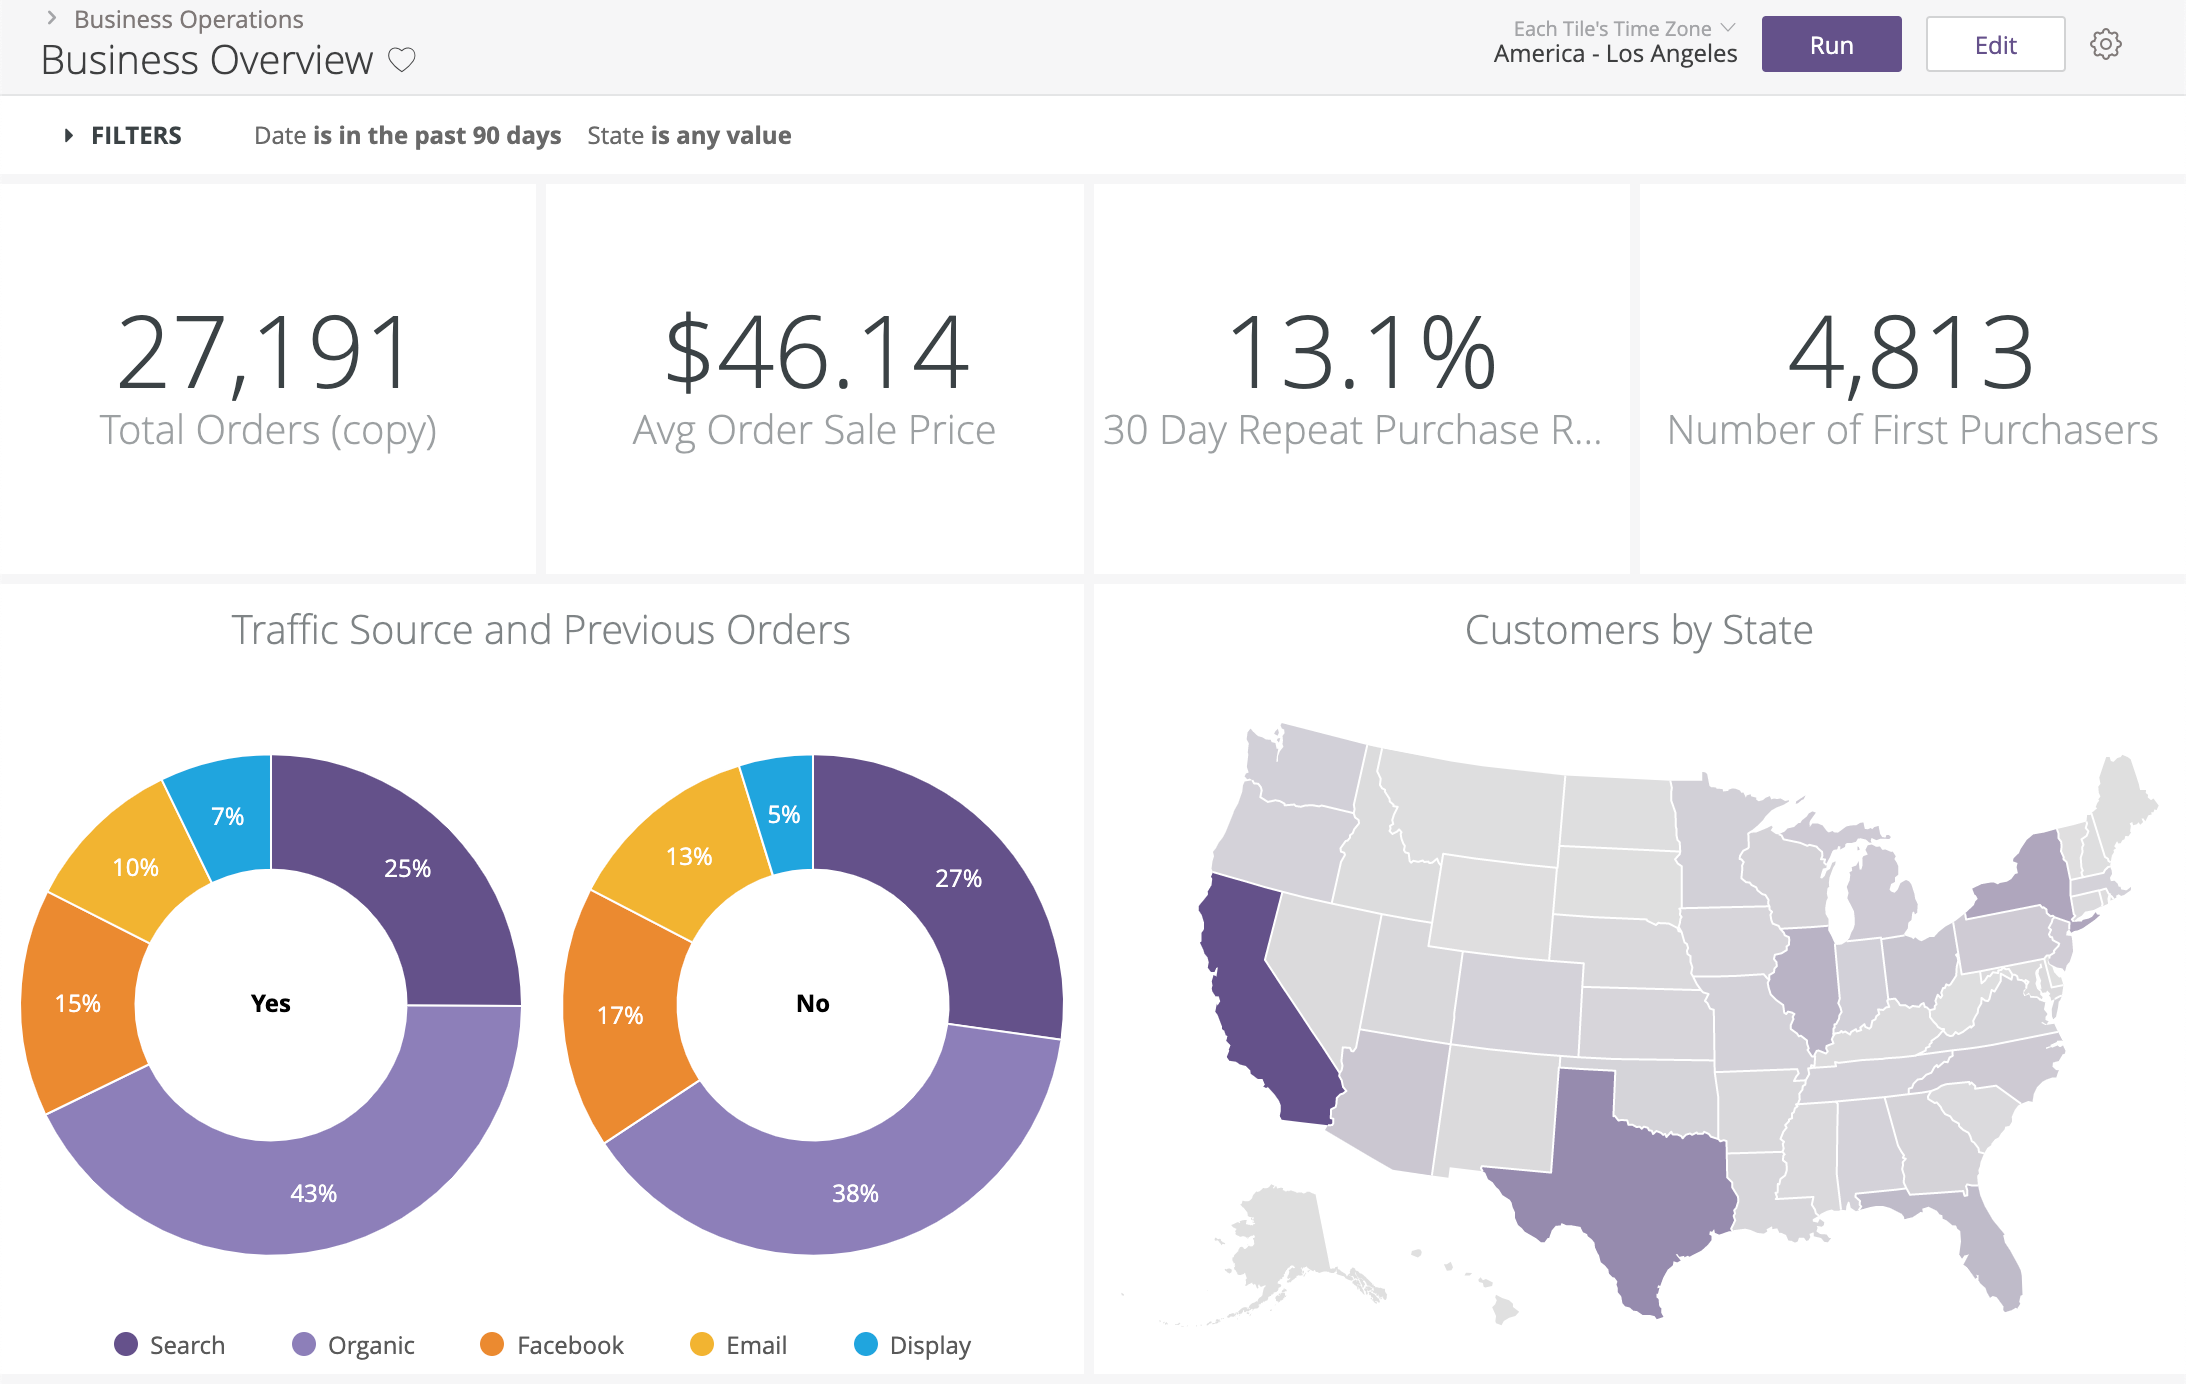
Another famous name in the BI industry, Looker is a powerful BI tool that provides an innovative approach for real-time data exploration and analytics.
If you are looking for a tool to centralize your business data, look no further because Looker, with its semantic modeling layer, can help you apply business logic to your data and create a single source of truth for every team to use.
New to the Magic Quadrant in 2018, Looker is positioned in the Niche Players quadrant — showing a good balance between Completeness of Vision and Ability to Execute.
You can learn to connect Looker to Amazon Athena here.
Pros
- Looker runs entirely in-browser, so there’s no need for desktop install and it's better for collaboration and data delivery between internal and external users
- Looker operates entirely on the data in your database. That means that you’re operating directly on your full dataset and getting all the horsepower of your database, whether that be an MPP like Vertica, Redshift, Bigquery; a SQL-on-Hadoop setup like Impala or Spark; or a standard RDBMS like MySQL or Postgres
- Automated reporting - Looker allows you to schedule emails for daily/weekly/monthly reports or send alerts if there are anomalies in data.
- Looker has GitHub integration, so you can see every change made to the modeling layer and combine the work of multiple developers seamlessly
Cons
- Looker has a steep learning curve when it comes to adopting a new language (LookML) & the model-view approach for the end-users. You definitely need to have an internal team that is dedicated to just setting it up and getting the rest of the people on board.
- Small errors are hard to troubleshoot and result in not using the dashboard much. No SQL CLI makes it disappointing for power users.
- Relative to other BI tools, the advanced charting functionality is somewhat limited
For more Looker analysis and evaluation, check out:
3. Chartio
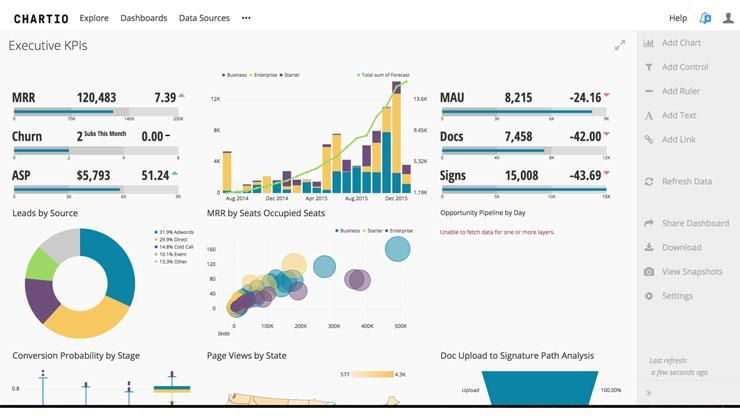
Chartio is a business intelligence tool that makes Amazon Athena data available for all employees (technical and non-technical alike) to query, explore, and report on.
Update on Jan 2022: Chartio is shutting down, for Chartio Alternatives, check out this article.
Although it doesn't offer a free version like Holistics, its pricing is fairly close.
What I like about this tool, similar to Holistics, is that it caters to both technical and non-technical users alike. It uses Visual SQL as its visual language for querying data that allows non-technical users to build queries with no coding knowledge.
At the same time, it provides powerful query optimization on SQL, which analysts can utilize to speed up their workflow.
Instruction to connect Chartio to Athena: here
Pros
- Since it's based on SQL, you can also do some very advanced transformations.
- Chartio offers a data pipeline to extract, load and transform the data as needed.
- Great training materials.
- The tool is web-based, so it can work well with any browsers like Holistics.
- You can save your data into Chartio's datastores. Using these datastores on your dashboards makes them super fast to refresh without querying your own database. You can set when you would like to refresh your datastores.
Cons
- Visualization capabilities. There are not so many visualization options, and the charts customization is also a bit limited.
- Embedded analytics is not included in the normal price package. The price is very high if your company is small or medium-sized.
- The UI is not intuitive and simple enough for non-technical users to get used to quickly
4. Mode
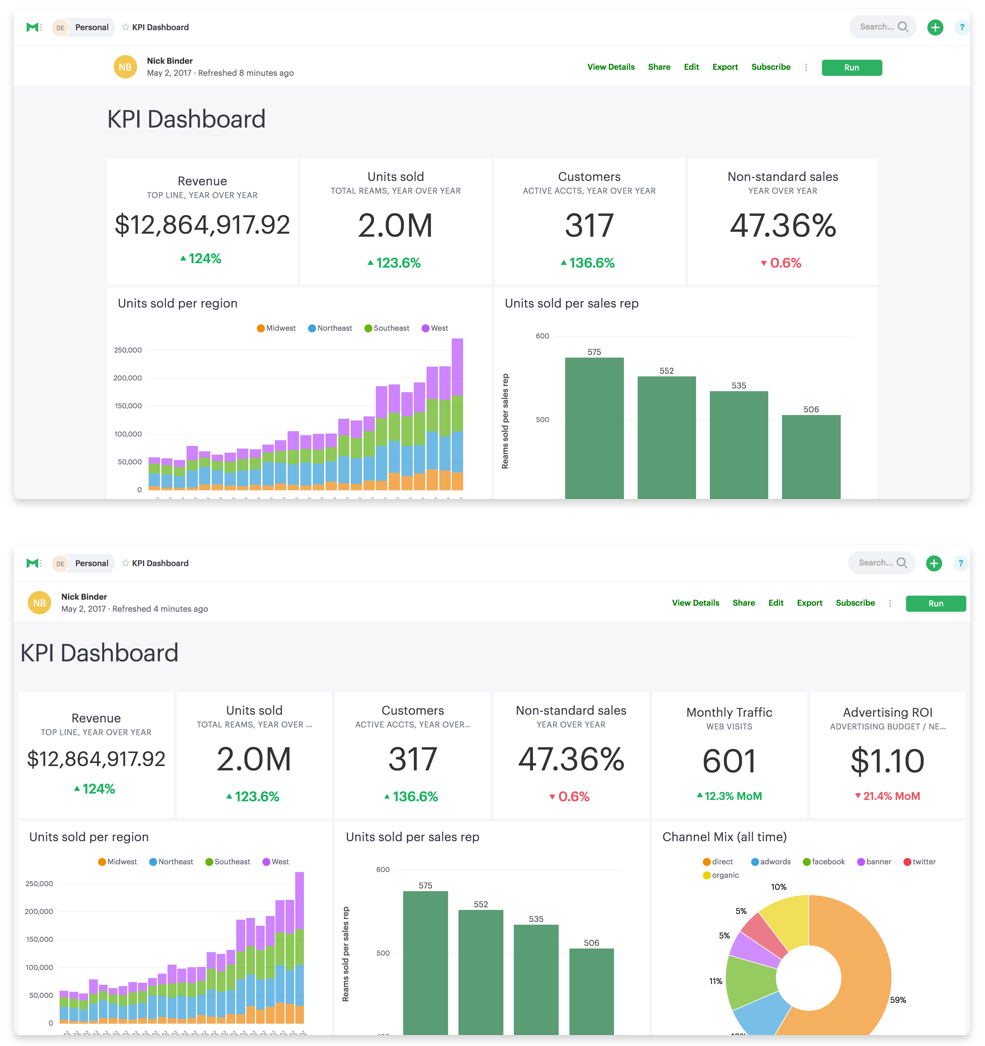
Mode is a collaborative data platform that combines SQL, R, Python, and visual analytics in one place. This means that to leverage the full power of Mode, your company must have at least a dedicated, highly technical specialist.
Click here to learn how to connect Mode to Amazon Athena.
Pros
- Mode's embedded R and Python notebooks are amazing. Its support for popular Python libraries make this tool stand out from other products in the market.
- Mode invests greatly in training resources. Their entry-intermediate SQL & Python courses are one of the most helpful on the Internet.
- The data is quickly and easily exportable to Excel for further manipulation - a recent update improved this further so that you can simply copy most data without the need to download the actual file
- Customization: Mode allows analysts to customize their own reports using HTML and JavaScript. This is, again, something that the majority of BI tools haven't supported.
Cons
- Since Mode is geared towards technical users, it's hard for non-technical users to explore the data or build reports on their own. Also, this leads to its limited charting options that can only be solved with technical knowledge.
- The user experience is not polished. Quite often Mode experiences glitches and delay which cause its users to refresh the app quite often.
5. Redash
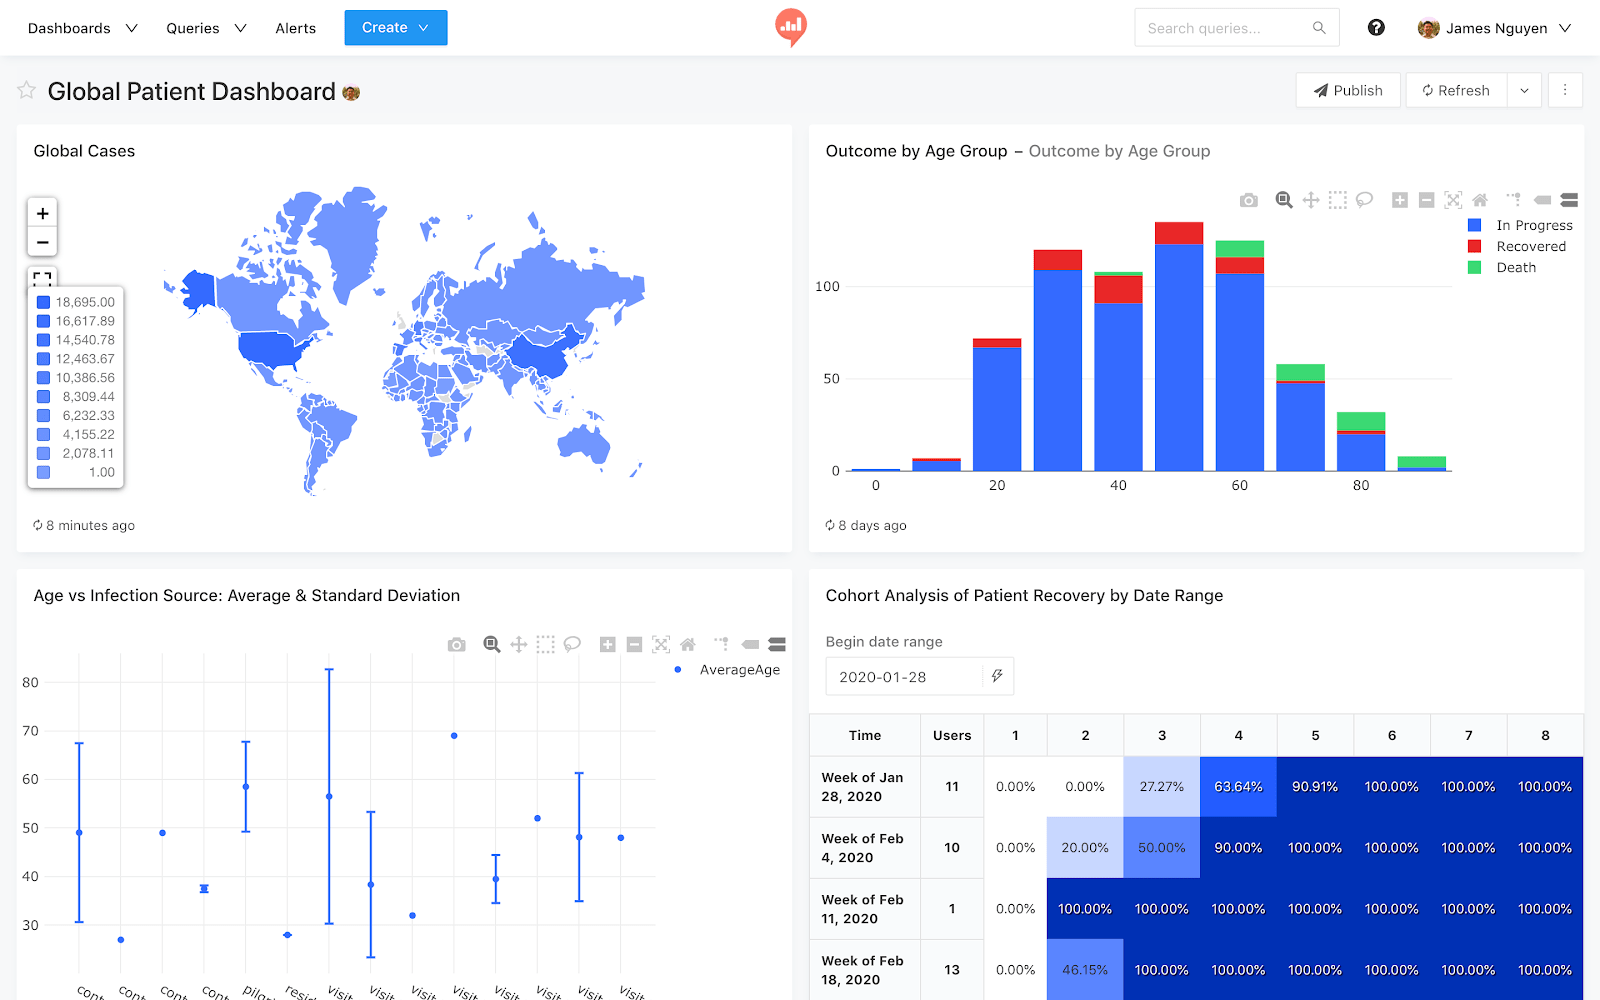
Redash is a SaaS application to query your data sources, visualize data, build dashboards, and share them with your team easily. It comes with a simple but powerful interface along with integrations to Slack, Zapier, and more.
How to connect Redash to Amazon Athena: Click here.
Pros
- Easy enough to set up and self-host
- Search and filter on top of queries is automated, making the setup of high-value reports simple and quick
- Cost effective (Object-based pricing and query-based pricing). Also have open-source.
- If you're a developer, you'll notice that the Redash code is well structured and very approachable.
Cons
- The dashboard and visualization features are not as advanced when compared to other tools, so if you want to create very complicated charts, you should consider again.
- Redash has the same weakness as Mode when it comes to self-service. It's too technical for end-users to do ad-hoc reporting without any SQL skills.
Conclusion
I hope this post has given you a pointer to choose the most suitable BI tool for your Amazon Athena service. I'd strongly recommend giving each tool a try, and try to involve as many people in your company (or at least, in your Data team) to try these products out. Some times, there might be use-cases that you won't be expecting!
--
What's happening in the BI world?
Join 30k+ people to get insights from BI practitioners around the globe. In your inbox. Every week. Learn more
No spam, ever. We respect your email privacy. Unsubscribe anytime.
