




Self-service BI
that everyone trusts

Let every team answer their own questions, on a governed semantic layer that keeps every number consistent.

Self-service BI that everyone trusts

Explore freely

Point, click, and drill into any question without writing SQL or filing a ticket.

One source of truth

Every metric defined once, consistent everywhere.

Where decisions happen

Push answers to dashboards, Slack, email, and alerts, so people see them where they already work.

Answer your own questions, on data your analysts curated

Analysts curate trusted data once. Business users explore it on their own, by drag-and-drop or just by asking.

Analysts curate trusted data

Your data team defines each metric once in the semantic layer, then packages the right tables and fields into curated datasets.

Self-service starts from governed, consistent data instead of the raw warehouse.

Explore freely with drag-and-drop

Business users drag, drop, and pivot their way to an answer, then drill and filter along the paths analysts set up.

Most follow-up questions stay self-serve, without SQL or a ticket queue.

Or just ask AI in plain English

Type a question in natural language and get a chart back.

Holistics AI is grounded in the same semantic model, so its answers stay consistent with every other report.

Explore Holistics AI

Go deeper, interactively

Keep asking follow-up questions, all without an analyst.

Filters that get you to the slice you need

Slice to the country, segment, or date range you care about in an instant, without touching the underlying query.

Drill down and break down

Click any value to break it down by another dimension and see what's driving the number.

Drill-through to the details

Jump from a summary chart straight into the detailed report behind it, in a single click.

Date drill

Zoom from year to quarter to day on any time chart to spot the pattern.

Cross-filtering

Click a point in one chart and watch every related visualization on the dashboard update together.

View underlying data

Drill all the way to the raw rows behind any number, without an export, an analyst, or any setup.

Take action right from the report

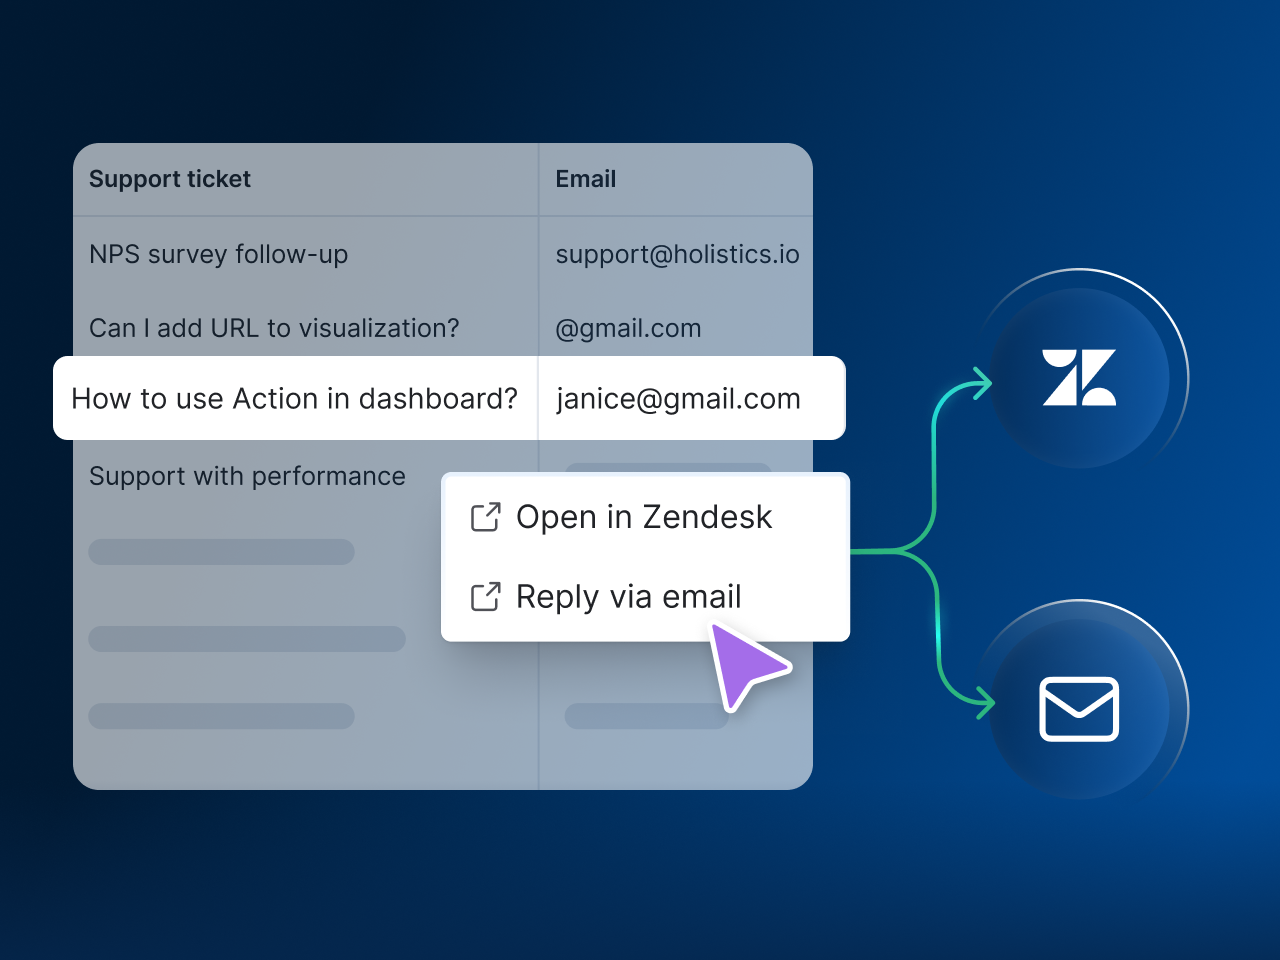
Turn a report from something you read into something you act on. Open a CRM record, send a pre-filled email, or jump to another dashboard, straight from a row in your table.

Learn about Actions
Take action right from the report
Head of Data
Head of Data Optimal Workshop

Analyze without an analyst

Common analyses are a setting, not a support ticket.

Period-over-period comparison

Compare this month to last, or this year to last, with a single setting.

Trend and reference lines

Surface the trend and benchmark against your targets, right on the chart.

Percent of total

See how each segment contributes to the whole, without writing a formula.

Moving calculations

Smooth day-to-day swings with moving averages, or track a running total over time.

Build dashboards worth sharing

Compose the story on a freeform canvas, on brand and on any screen.

Canvas dashboards

Arrange charts, text, and images freely to tell the story, rather than stacking tiles in a fixed grid.

Rich visualizations

Go beyond bars and lines with geo maps, cohort retention, conversion funnels, and fully custom charts.

On-brand themes

Style typography, colors, and spacing to match your brand, or go dark. Save reusable themes once and apply them across every dashboard.

Responsive on every device

Dashboards adapt to any screen, from a boardroom display to a phone.

Get data where decisions happen

Put data in the tools people already check, so they actually use it.

Scheduled delivery

Push dashboards and reports to email, Slack, Google Sheets, or SFTP on any schedule you like.

Data alerts

Get pinged the moment a metric crosses a threshold, so nobody has to keep refreshing a dashboard to check.

Data alerts

Export and embed

Export to CSV, Excel, or PDF, or embed a live dashboard straight into another app.

Staff Data Engineer
Staff Data Engineer ZOE

Find the version you can trust

As dashboards multiply, the trusted version stays easy to find and the stale stuff stays out of the way.

Endorsed content

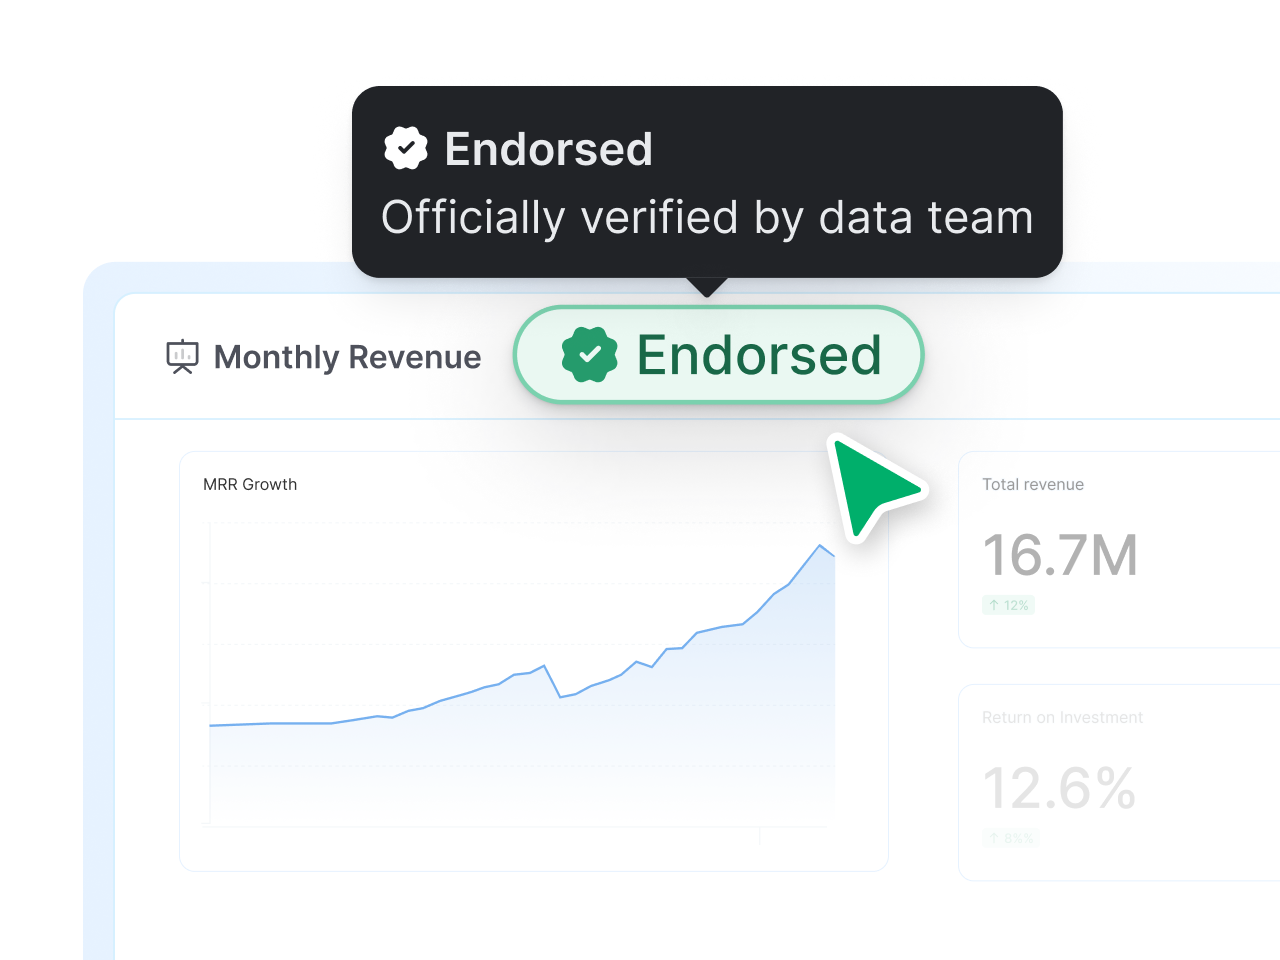
Mark trusted dashboards and datasets with an endorsement badge. Endorsed content rises to the top of search and Holistics AI answers, so people land on the official version instead of a stale copy.

How content endorsement works

Tags that organize everything

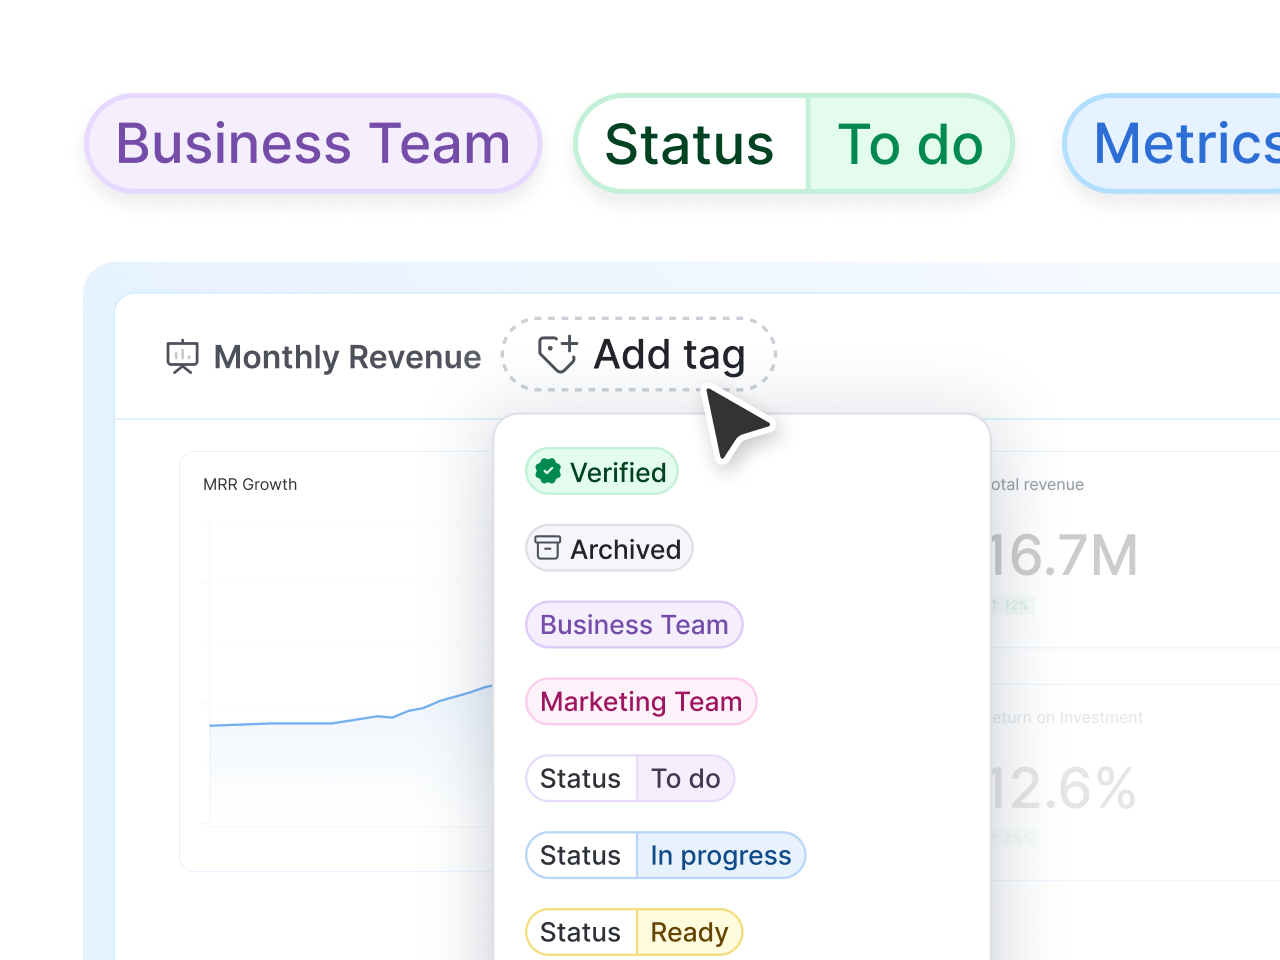
Tag dashboards, datasets, and models by team, status, or topic. Tags are nested, color-coded, and defined as-code, so your library stays consistent as it grows.

Set up the tagging system

Archive without deleting

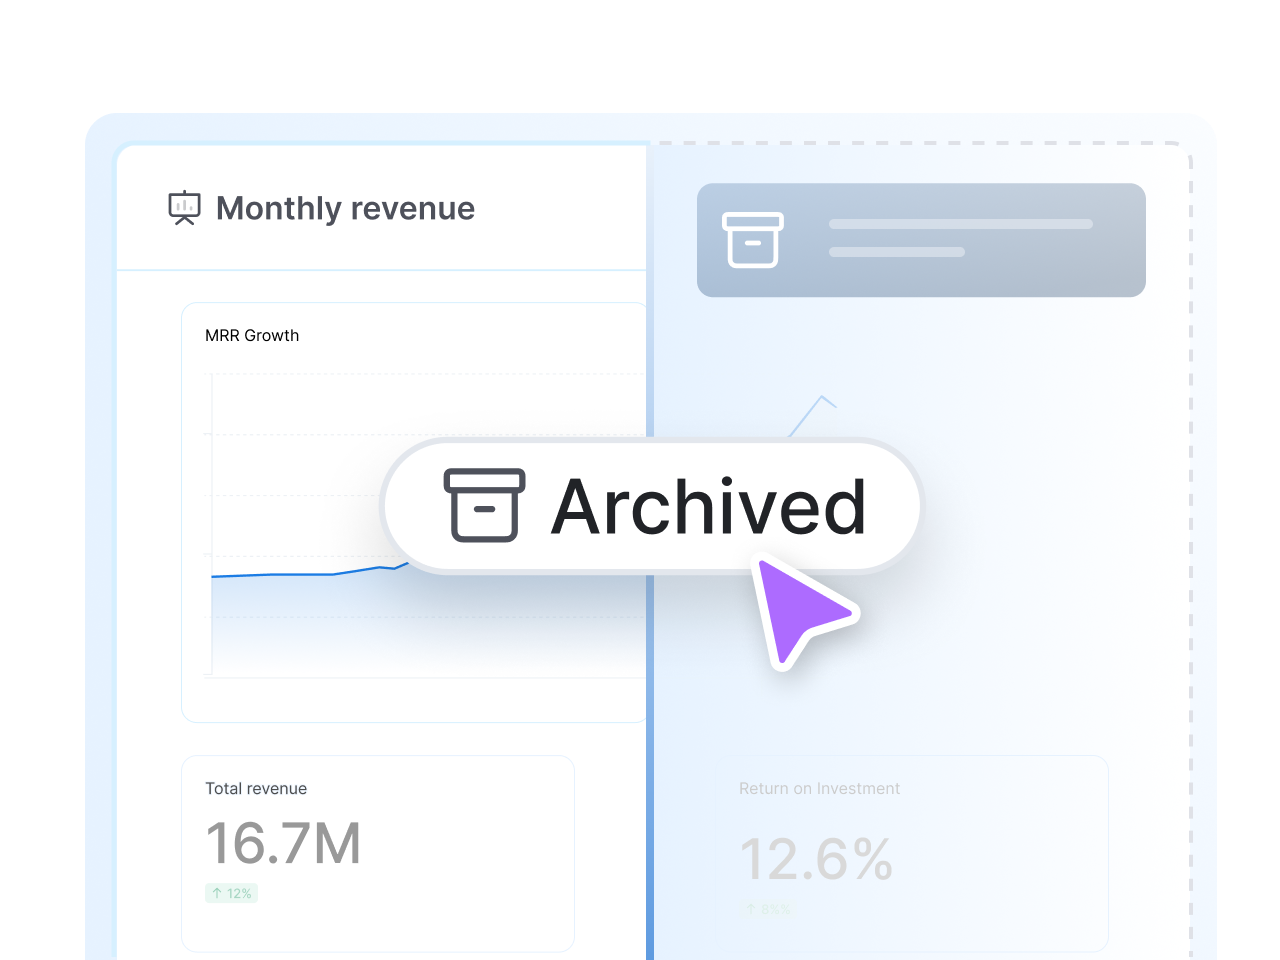
Retire stale content without losing it. Archived items drop out of search and pause their schedules, and Holistics flags what's gone unused so cleanup is easy.

Explore content archiving

Search, favorite & pin

Search by keyword or tag, star your favorites, and pin key dashboards to the homepage. People find what they need in seconds, no digging through folders.

Search & bookmark

Self-service the data team controls

Business users get to explore freely while the data team keeps control, through a shared semantic layer and central admin settings.

One definition of every metric

Metrics are defined once in a shared semantic layer and reused everywhere, so self-service always returns the official numbers rather than someone's private spreadsheet.

Explore the semantic layer

Row- & column-level security

Show each person only the rows and columns they're allowed to see, enforced centrally across every report and dashboard.

How the permission system works

Dynamic access with user attributes

Build one dashboard and let user attributes decide what each viewer sees, so you don't duplicate reports per team or client.

Set up row-level permission

Roles, groups & permissions

Control who can build, view, and share from one place. Roles and groups keep permissions consistent as your team grows.

Manage roles & groups

SSO, SCIM & 2FA

SAML SSO (Okta, Entra ID), SCIM auto-provisioning, and two-factor login bring your existing identity stack to your analytics.

Configure SSO & SCIM

Audit logs & compliance

Activity logs show who accessed what, backed by SOC 2, GDPR, and regional data residency.

See usage monitoring

FOR THE DATA TEAM

Built on a modeling foundation

Under the friendly drag-and-drop surface is a code-based semantic layer. Model your business logic as-code, version it in Git, and connect it to dbt, so self-service stays consistent as your data and team scale.

Trusted by teams worldwide

Hear from data-driven teams who've transformed their workflows with Holistics.

Excellent BI tool for customers looking for a Looker alternative. Coming from a Looker background, I was very familiar with its concepts of analytics-as-code, and we have achieved everything we needed for reporting.

Alex H

Head of Data, Pinter

avatar
The metrics dataset component is really critical for companies that don't have a real data team to build everything all the time. In the work I do, I recommend Holistics to people all the time.

Pedram Navid

Consultant/Founder, West Marine Data

avatar
The ability for everyone to explore: Massive win. The one feedback we've had over and over again from the whole company is “Man, how did you guys go through your process? Because you choose such a great tool.”

Guido Stark

Head of Data, Optimal Workshop

avatar
Holistics is the next big BI Tool. It took me 2 hours to build the same report in Holistics that I took 16 hours to build in Tableau.

Stephen Motherwell

Chief of Product, Ordo

avatar
Holistics became an excellent choice to get us going in BI without the typical huge annual expense. We have built visualizations in Holistics that took it way beyond the 'out-of-the-box' tools.

Seth L

Chief of Product, Oxbridge Health

avatar
As an analytics engineer, I was looking for a tool that allowed me a lot of data modeling flexibility and reusability. With Analytics as code, Holistics does a great job of being able to define data models and relationships using code.

Sterling P

Chief of Product, Mainspring Energy

avatar
They are great. They are continuously improving the platform and releasing new features, so we know that what we don't have right now will be at some point :)

Marta Garrido

Head of Data, MyRealFood

avatar
See all case studies
Holistics

Transform your data journey with Holistics today!