The Arc of Adoption
There's one last piece that might help you navigate the business intelligence tool space. You've already seen a quick history of tool development, and we've just given you a basic taxonomy of the BI landscape. This last section will help you understand the evolution of requirements that you should see in your organization.
What do we mean by this? Well, most companies go through a very similar arc of data adoption. They do this because data usage is determined by organizational culture, and organizations go through similar cultural changes when given access to data. Understanding what that process looks like will help you understand why so many tools advertise an ability to provide 'true self-service'. It will also help you prepare for future growth.
One: Ad-hoc Queries
In the beginning, the business people in your organization will have ad-hoc questions. This emerges naturally, and is as inevitable as the sun rising in the East.
How this happens is as follows: at some point in your company's life, a salesperson or marketing person or ops person will say something like "But our customers don't want that!" and someone will shoot back "How do you know?", and then everyone will turn to a data analyst to give them the answers they need.
How you serve these queries depends heavily on the tools you have available to you. If you have access to a centralized data warehouse, it is likely that you would write some ad-hoc SQL query to generate the numbers you need. If you operate in a more 'decentralized' data environment, you would have to find the right data sources, grab the subset of data that you need, and then analyze it in whatever tool you have sitting on your machine.

Two: Static Reports and Dashboards
Eventually, as more business people catch on to the idea of getting data to bolster their arguments (and as the company expands in complexity) a data team would begin to feel overwhelmed by the sheer number of requests they receive. The head of data then reaches for an obvious next step: a reporting solution to get some of the requests off his team's back.
This, too, is inevitable. Over time, data people will learn that there is a steady, predictable cadence to some of the requests they receive. For instance, at an early-stage company that we worked with, the head of data quickly realized that the product team had a certain set of metrics they wanted to look at on a weekly basis, while the marketing team had a natural tempo of requests once every three weeks.
This head of data began to look for a BI tool to create dashboards for those predictable metrics, in order to free up his team for the more ad-hoc requests that they received from other parts of the company. Once he had created those reports, his data team immediately began to feel less overwhelmed.
"We're very happy," he told us, "The product team and the marketing team each got their own dashboard, and once we set everything up, the number of requests we got from those two teams went down. We now try and give them a new report every time they ask for something, instead of running ad-hoc queries all the time for them."
Many companies realize the importance of having good reporting functions fairly quickly. If they don't adopt a dashboarding solution, they find some other way of delivering predictable data to their decision-makers. For instance, a small company we know uses email notifications and Slack notifications to deliver timely metrics to their businesspeople. The point is that the numbers reach them on a repeatable, automated basis.
Eventually, new hires and existing operators alike learn to lean on their 'dashboards'. This leads us to the next stage.

Three: Self-Service
It is perhaps ironic that more dashboard usage leads to more data-driven thinking ... which in turn leads to more ad-hoc requests! As time passes, business operators who lean on their dashboards begin to adopt more sophisticated forms of thinking. They learn to rely less on their gut to make calls like "let's target Japanese businessmen golfers in Ho Chi Minh City!", or "let's invest in fish instead of dogs!" This leads to an increase in ad-hoc, exploratory data requests.
The data team finds itself overwhelmed yet again. The data lead begins to think: "if only there was some way to let our business people explore metrics on their own!"
What happens next greatly depends on the business intelligence paradigm you come from. Some companies have experimented with SQL training for their business people. "Teach them SQL," they think, "And they will be able to get more sophisticated data from the SQL-oriented tools we have (like Redash, Mode or Metabase)."
Other companies buy into the self-service narrative sold by the 'second wave' of BI tools. This includes things like PowerBI's usage paradigm and Tableau Desktop's drag-and-drop interface. "Give them such tools," they think, "And they'll be able to help themselves to the answers they need, without bottlenecking on the data team."
Both approaches have problems, but the biggest problem is that they often lead to the metrics knife fight we've talked about at the beginning of this chapter. Different business users may accidentally introduce subtly different metric definitions to their analyses. These inconsistencies often lead to miscommunication, or — worse — errors of judgment at the executive level.

The Arc: Then and Now
The point we want to make here is that this arc is universal. It has happened to companies in the past, and it will continue to happen to new companies in the future.
The idea of the arc is sometimes known as a 'data maturity model'. Such models are often used by consultant-types to evaluate the data maturity of an organization's behavior. Here is an example of one, from Jon Bratseth:
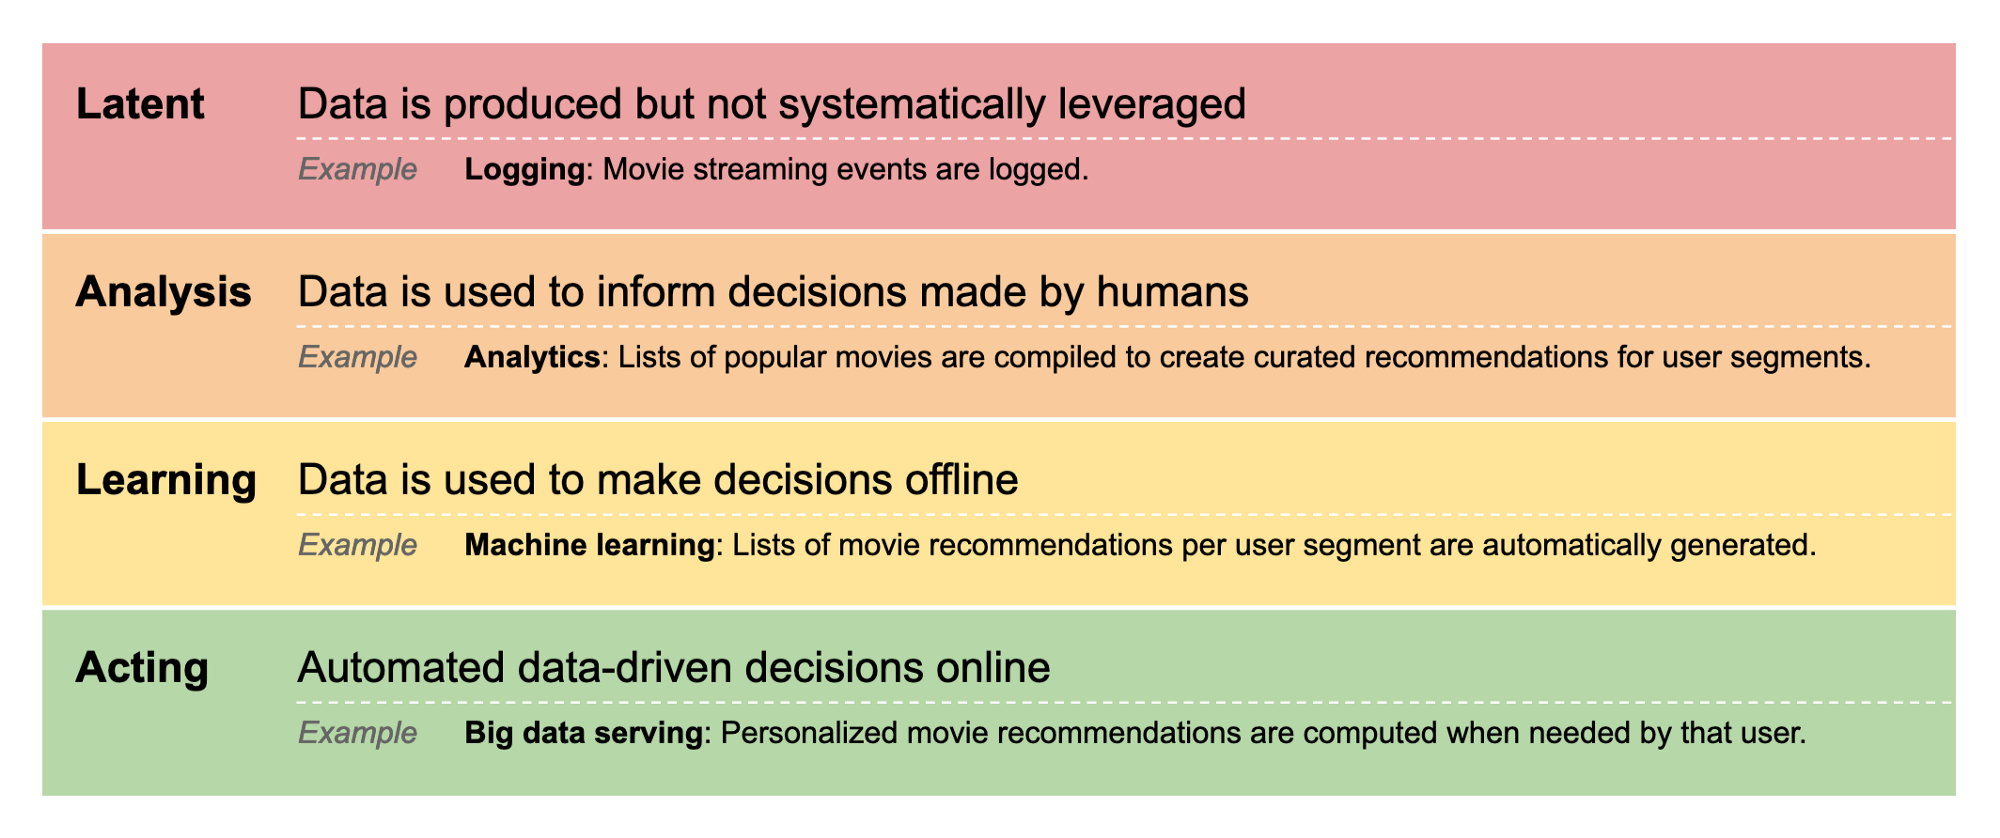
Notice how Branseth's model assumes that an organization must progress from latent, to analysis, to learning, to acting.
Another data maturity model (and one that we particularly like) is from Emily Schario of GitLab. Schario argues that all organizations go through the same, three levels of data analysis:
- Reporting — This is the lowest level. As Schario puts it: when you have no answers, you never get beyond looking for facts. Example questions at this level are things like: ‘how many new users visited our website last week?’ and ‘how many leads did we capture this month?’ Some companies do not get to this level, because they lack an organizational capability to systematically collect data in their business. Other times, they do collect the data, but they don’t spend any time paying attention to it. Reporting is the lowest level of data analytics; if you do not collect data or if you do not have the cultural expectation of using it, you’re not going to base your decisions on facts.
- Insights — Insights is the next level above reporting. If reporting is about gathering facts to report on them, insights are about understanding relationships between facts. This implies combining data from multiple sources. For example: the number of new customers who canceled their subscription this month is a reporting metric. If we combine this data with deals data in our sales CRM, however, we might learn that we have been targeting a bad subsegment of our market. This latter observation is an insight, and can lead to behavioral change among sales and product (‘don’t target or serve this market segment in the future; we’re not a good fit for them’).
- Predictions — Predictions come after insights. It is at this level that you begin to see sophisticated techniques like statistical analysis and machine learning. This makes sense: after your organization increasingly understands the relationships between various metrics, you may begin to make informed business decisions to drive outcomes that you desire. A famous example here is Facebook’s discovery that users who add at least seven friends in their first 10 days are the most likely to stick around. This single discovery drove an incredible amount of product decisions at Facebook — leading them, eventually, to win the social media race. Such predictive discoveries can only come after a reporting function and an insight-mining function are second-nature throughout the organization.
Such models can be useful because they show business leaders what is possible within their organizations. The fact that so many data maturity models exist tells us that there is some base truth here. It is interesting to ask why these models exist.
In other words: why does the arc occur?
The arc occurs because data-driven thinking is a learned organizational behavior. It spreads slowly throughout a company's culture. As a data team member, you are given front-row seats to this phenomenon.
Most people are not data-driven by nature. They have to learn it, like they learned reading or writing. In a sufficiently large company, however, you will find certain people who are naturally data-driven in their thinking; others that seem data-driven from the beginning may have come from more data-mature organizations and therefore seek to continue the practices that they were used to. Depending on the culture of your company, these attitudes will spread in your organization (or not!)
When viewed through this lens, the data capabilities that you build out in your team will have an impact on the spread of data-driven thinking in your organization. The more data capabilities you have, the more people will be exposed to the potential of using data to advance their arguments. The more data capabilities you build up, the more leverage you give to data-driven people in your company's culture to spread their way of thinking.
As a result, the amount of work that your data team has to do increases linearly with the spread of data-driven thinking in your company! That cycle looks something like this:

(Notice how this assumes that data-driven thinking will spread successfully throughout your org. There are other prerequisites for this to occur, of course, but we regard that as outside the scope of this book.)
The upshot is that if all goes well, your data team will find itself buried under a wave of ad-hoc requests. You will seek solutions to this problem. You will discover that dashboards and automated reports will buy you some time. But eventually, as your organization moves from reporting to insights to predictions, you would have to tackle this problem head-on.
This arc shouldn't surprise us. Spend even a small amount of time looking at industry conferences, or data thought leadership articles, or marketing materials from vendors, and you'll find that many of these professionals are obsessed over self-service as an ultimate goal. "Listen to us!" the thought leaders cry, "We will show you a way out of this mess!" To be clear, this is an understandable desire, because data-driven decision-making so often bottlenecks on the data team. Also to be clear: a majority of companies do not succeed in this effort. True self-service is a difficult challenge.
The most important takeaway from this section is that the arc is real. We've talked about the challenges of scaling data infrastructure in the past, but the flip side of that discussion is the idea that you must scale your BI tools to match the data consumption patterns in your company. Keep the arc of adoption in mind; nobody really escapes from it.
Solving the Self-Service Problem Today
How are things different today? Is it possible to do better than the previous generations of BI tools?
If you've read this far in the book, you can probably guess at what we think about this: unlike 'second wave' business intelligence tools, we think that data modeling at a central data warehouse is a solution to this problem. Define your business definitions once, in a modeling layer, and then parcel these models out for self-service. In this way, you get all the benefits of self-service without the problems of ill-defined, inconsistent metric definitions.
As far as we can tell, the only business intelligence tools to adopt this approach is Looker and Holistics. We expect more tools to adapt accordingly, however, especially if these ideas prove their worth in practice.
Will this approach win out in the end? We'd like to think so. We think that there are many advantages to this approach. However, as our intrepid data analyst Daniel has shown us, we cannot know what problems will fall out of this new paradigm. We will have to wait a couple of years to see.