Pivot Table is a concept that allows you to summarize and aggregate a set of data by different groups of fields. The resulting table is a summarized table like below:
The feature was first popularized from Lotus Improv, a spreadsheet program. Since then, it has become a very popular concept, present in ubiquitous programs like Excel, to data tools working with structured data.
Why Pivot Table?
--- * It helps you to summarize and categorize a large amount of raw data into meaningful insights in a single table (e.g. what are my quarterly sales figures this year, compared to last)? * It helps you create tabular insights quickly and concisely without using Excel functions or SQL
A Quick Example
Imagine that you have a Data Table regarding each and every transaction of different customers in different locations and across different times, for an E-Commerce company that contains hundreds or millions of rows of raw data.
You need to answer these 2 questions. How would you do it?
- The amount of products purchased by each customer
- The amount of products purchased in a specific date
It would be quite complicated if you want to generate this report with Excel, since you have to set column names, copy column user emails to another sheet, remove duplicates and execute a "SumIf" function to return the total quantity of each customer.
However, with Pivot Tables, it would be much easier, which you can see in the video below:
You can simply drag User Email to Row and Order Quantity to Values , just 2 clicks and it will give you a perfect report, with all the Data you need without using any formulas or functions.
Another example would be generating a report regarding Order status through time by gender
How It Works
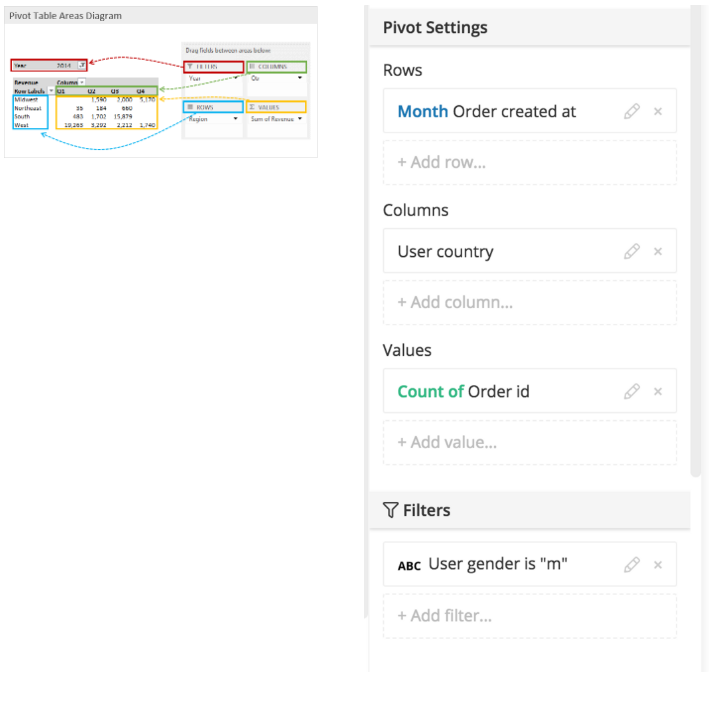
--- The concept is simple, you have a raw dataset, and you apply some transformations (called **pivoting**), to get the resulting pivot table. The raw dataset would usually be a spreadsheet of data.
Concepts:
Values : This usually takes a field that has numerical values that can be used for different types of calculations.
For example: the total number order.
Rows : used to apply a filter to one or more rows that have to be shown in the pivot table.
For example: if Category is dragged onto this area, then the other output table constructed will have values from the column " Category"
Columns : used to apply a filter to one or more columns that have to be shown in the pivot table.
For example: if Order Created At is dragged onto this area then the other output table constructed will have values from the column " Order Created At"
Filters : used to apply a filter to an entire table.
For example: Order Created before 15-09-2017
A closer look at the Pivoting mechanism
How to create Pivot Tables
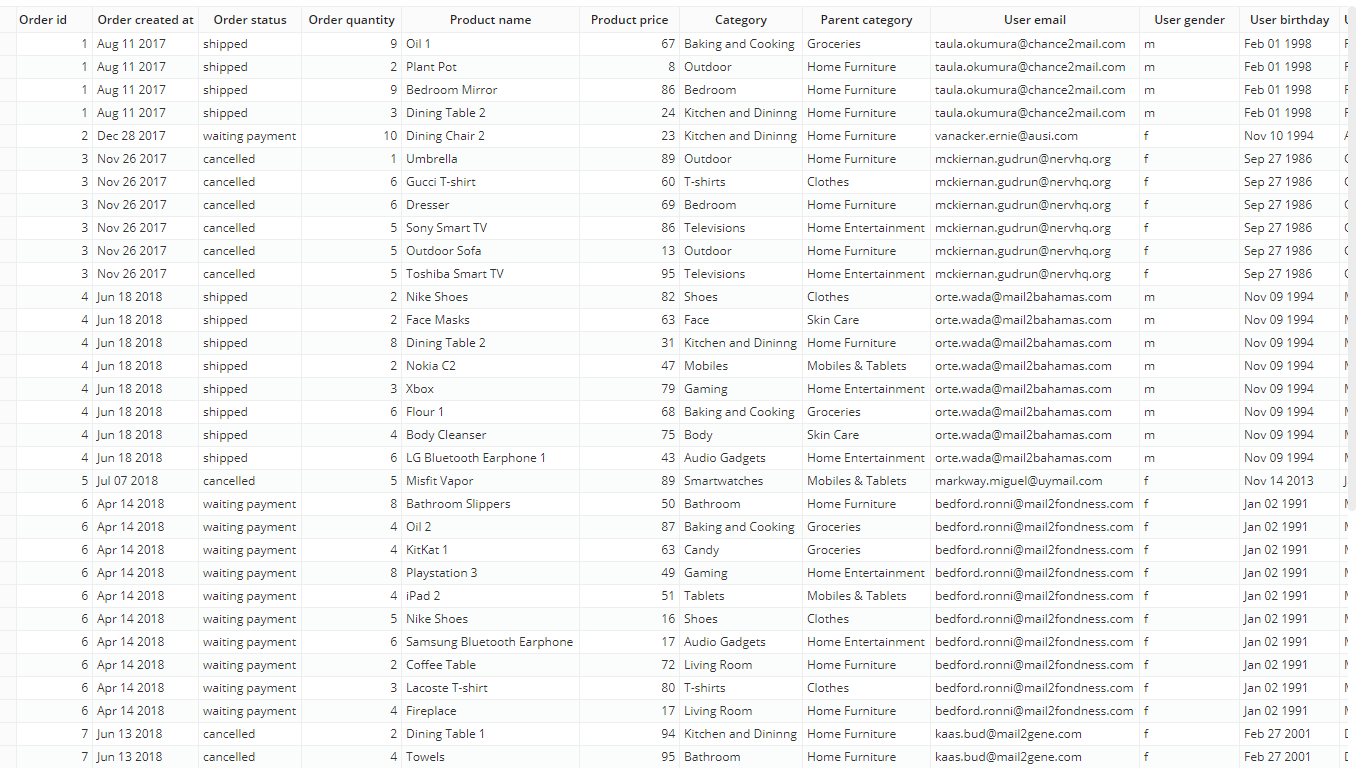
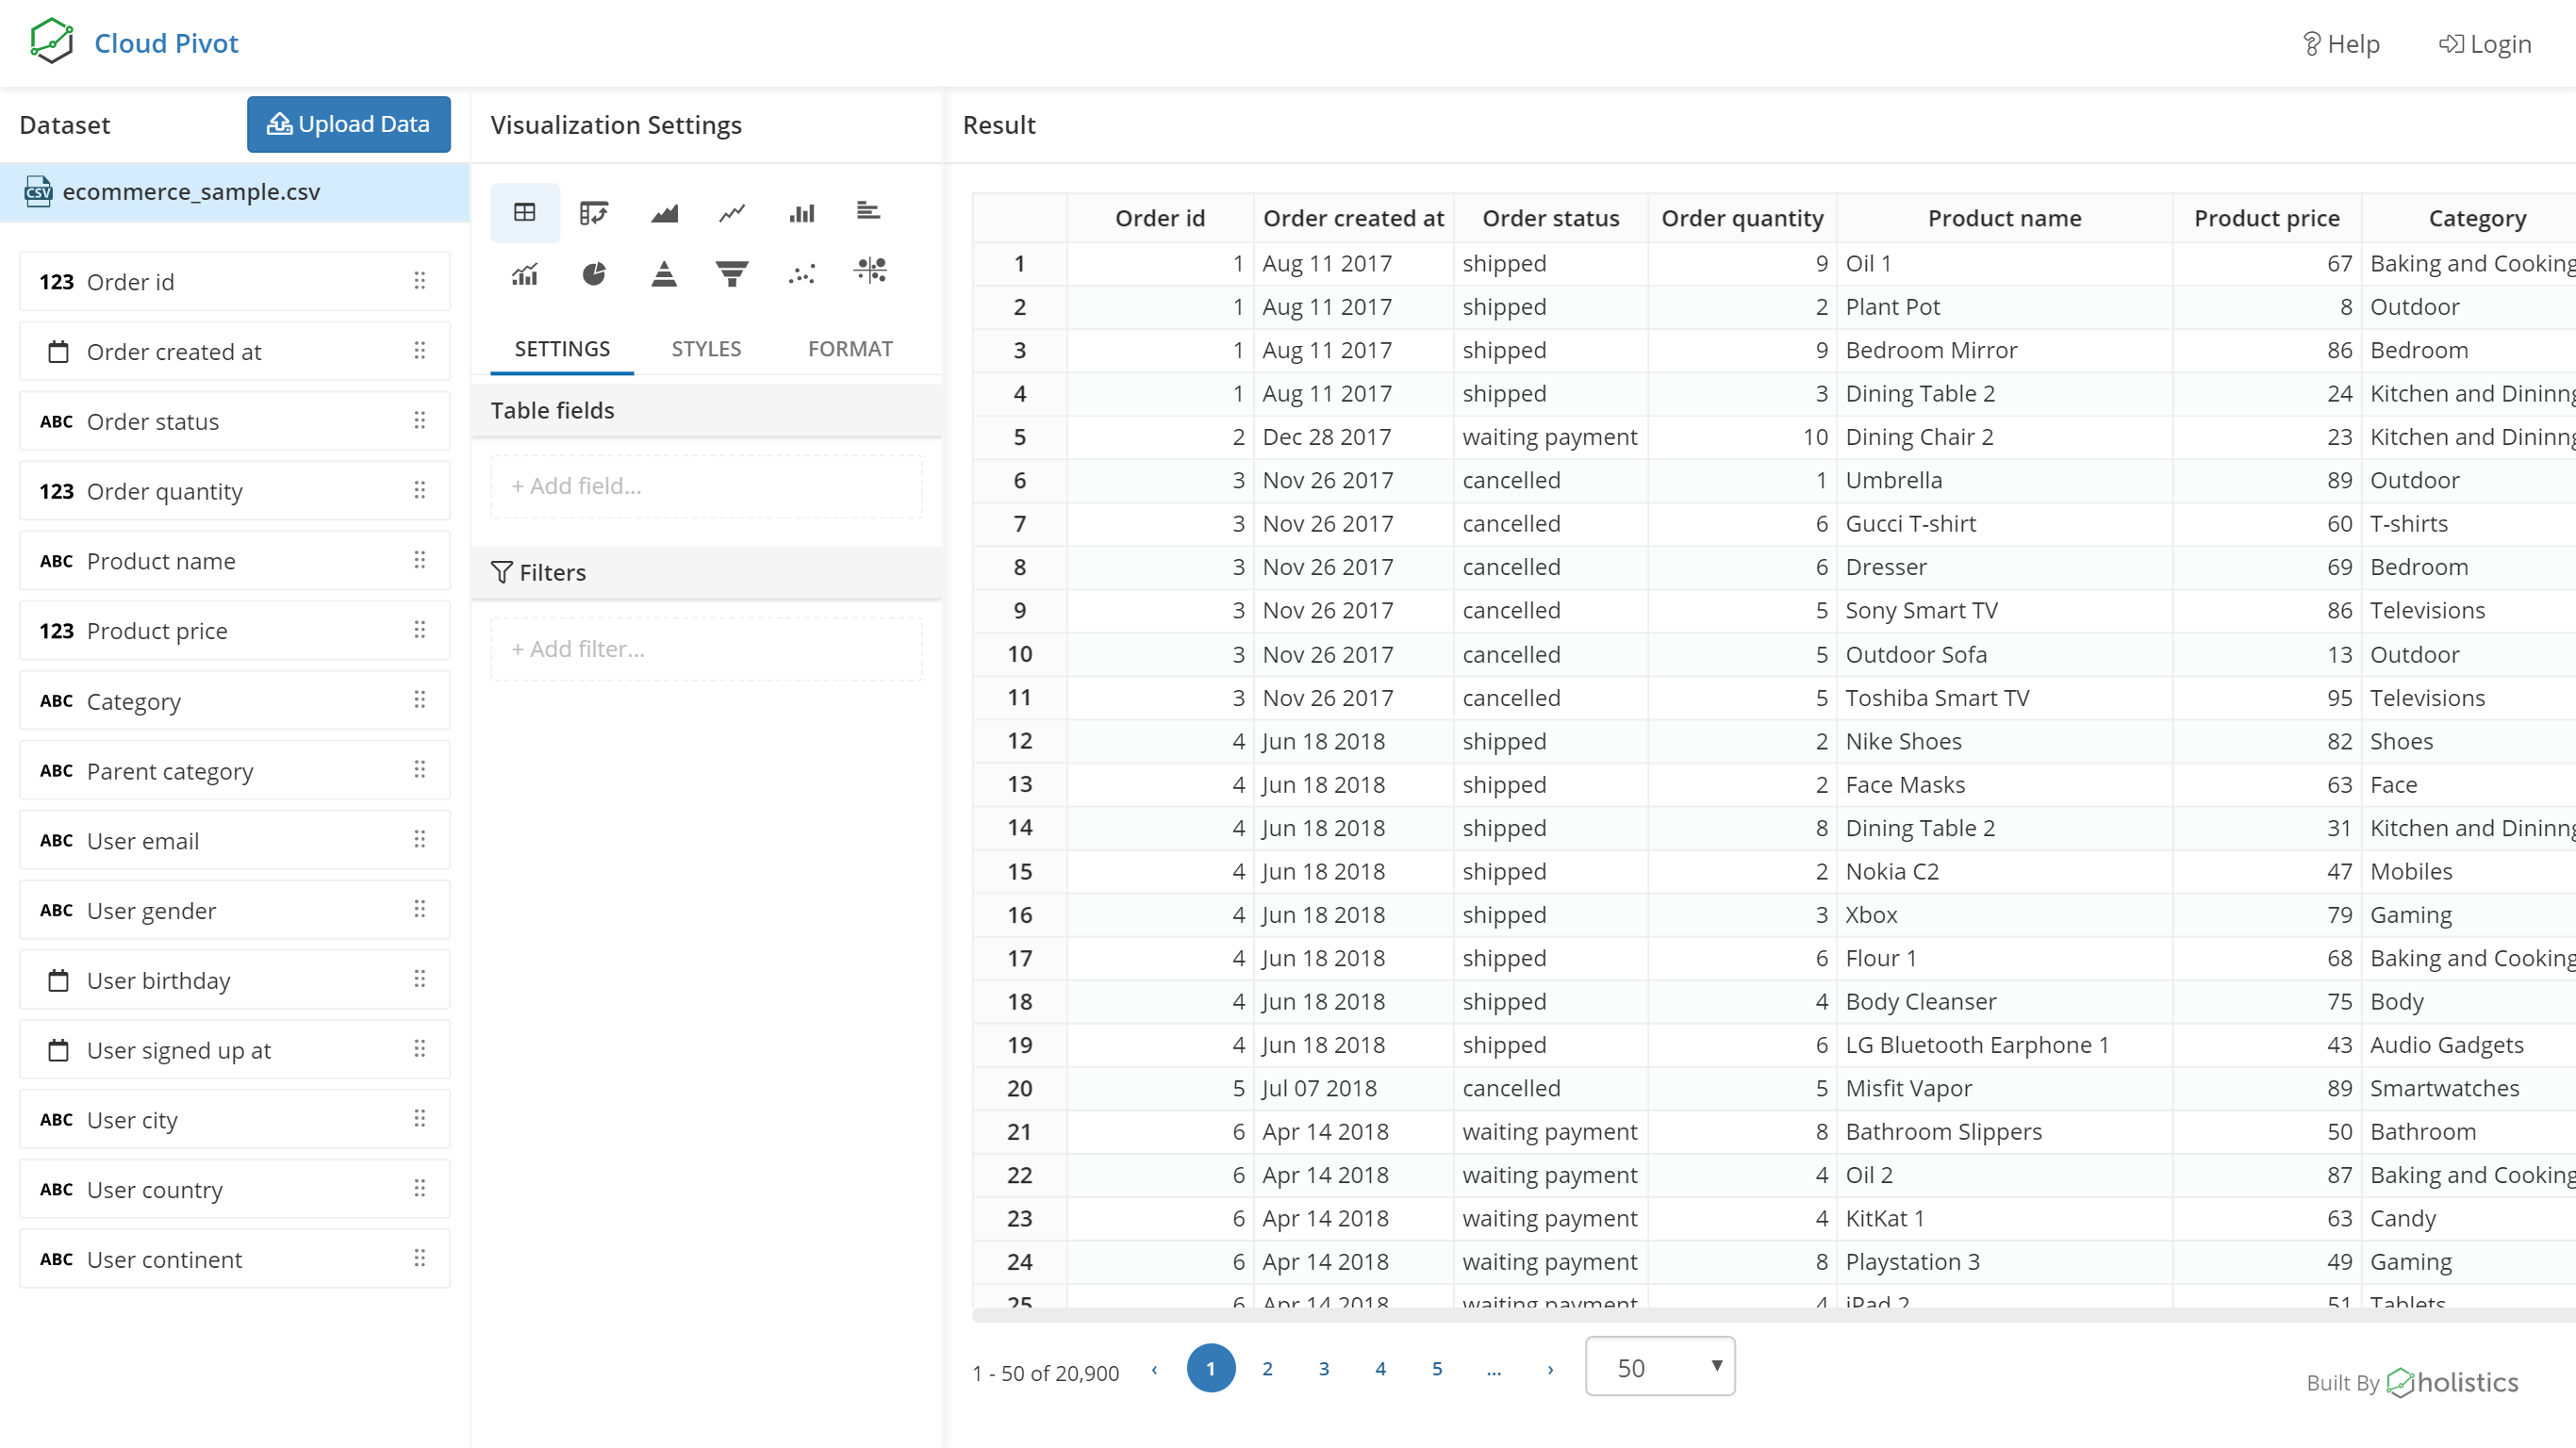
--- Take this example on the Cloud Pivot free tool. This example illustrates the transactions of an E-Commerce company which includes data like Product Information, Customer Information, Order Details and so on.
This is an example of a dataset that you need to pviot.
Example 1: How many products has each customer purchased?
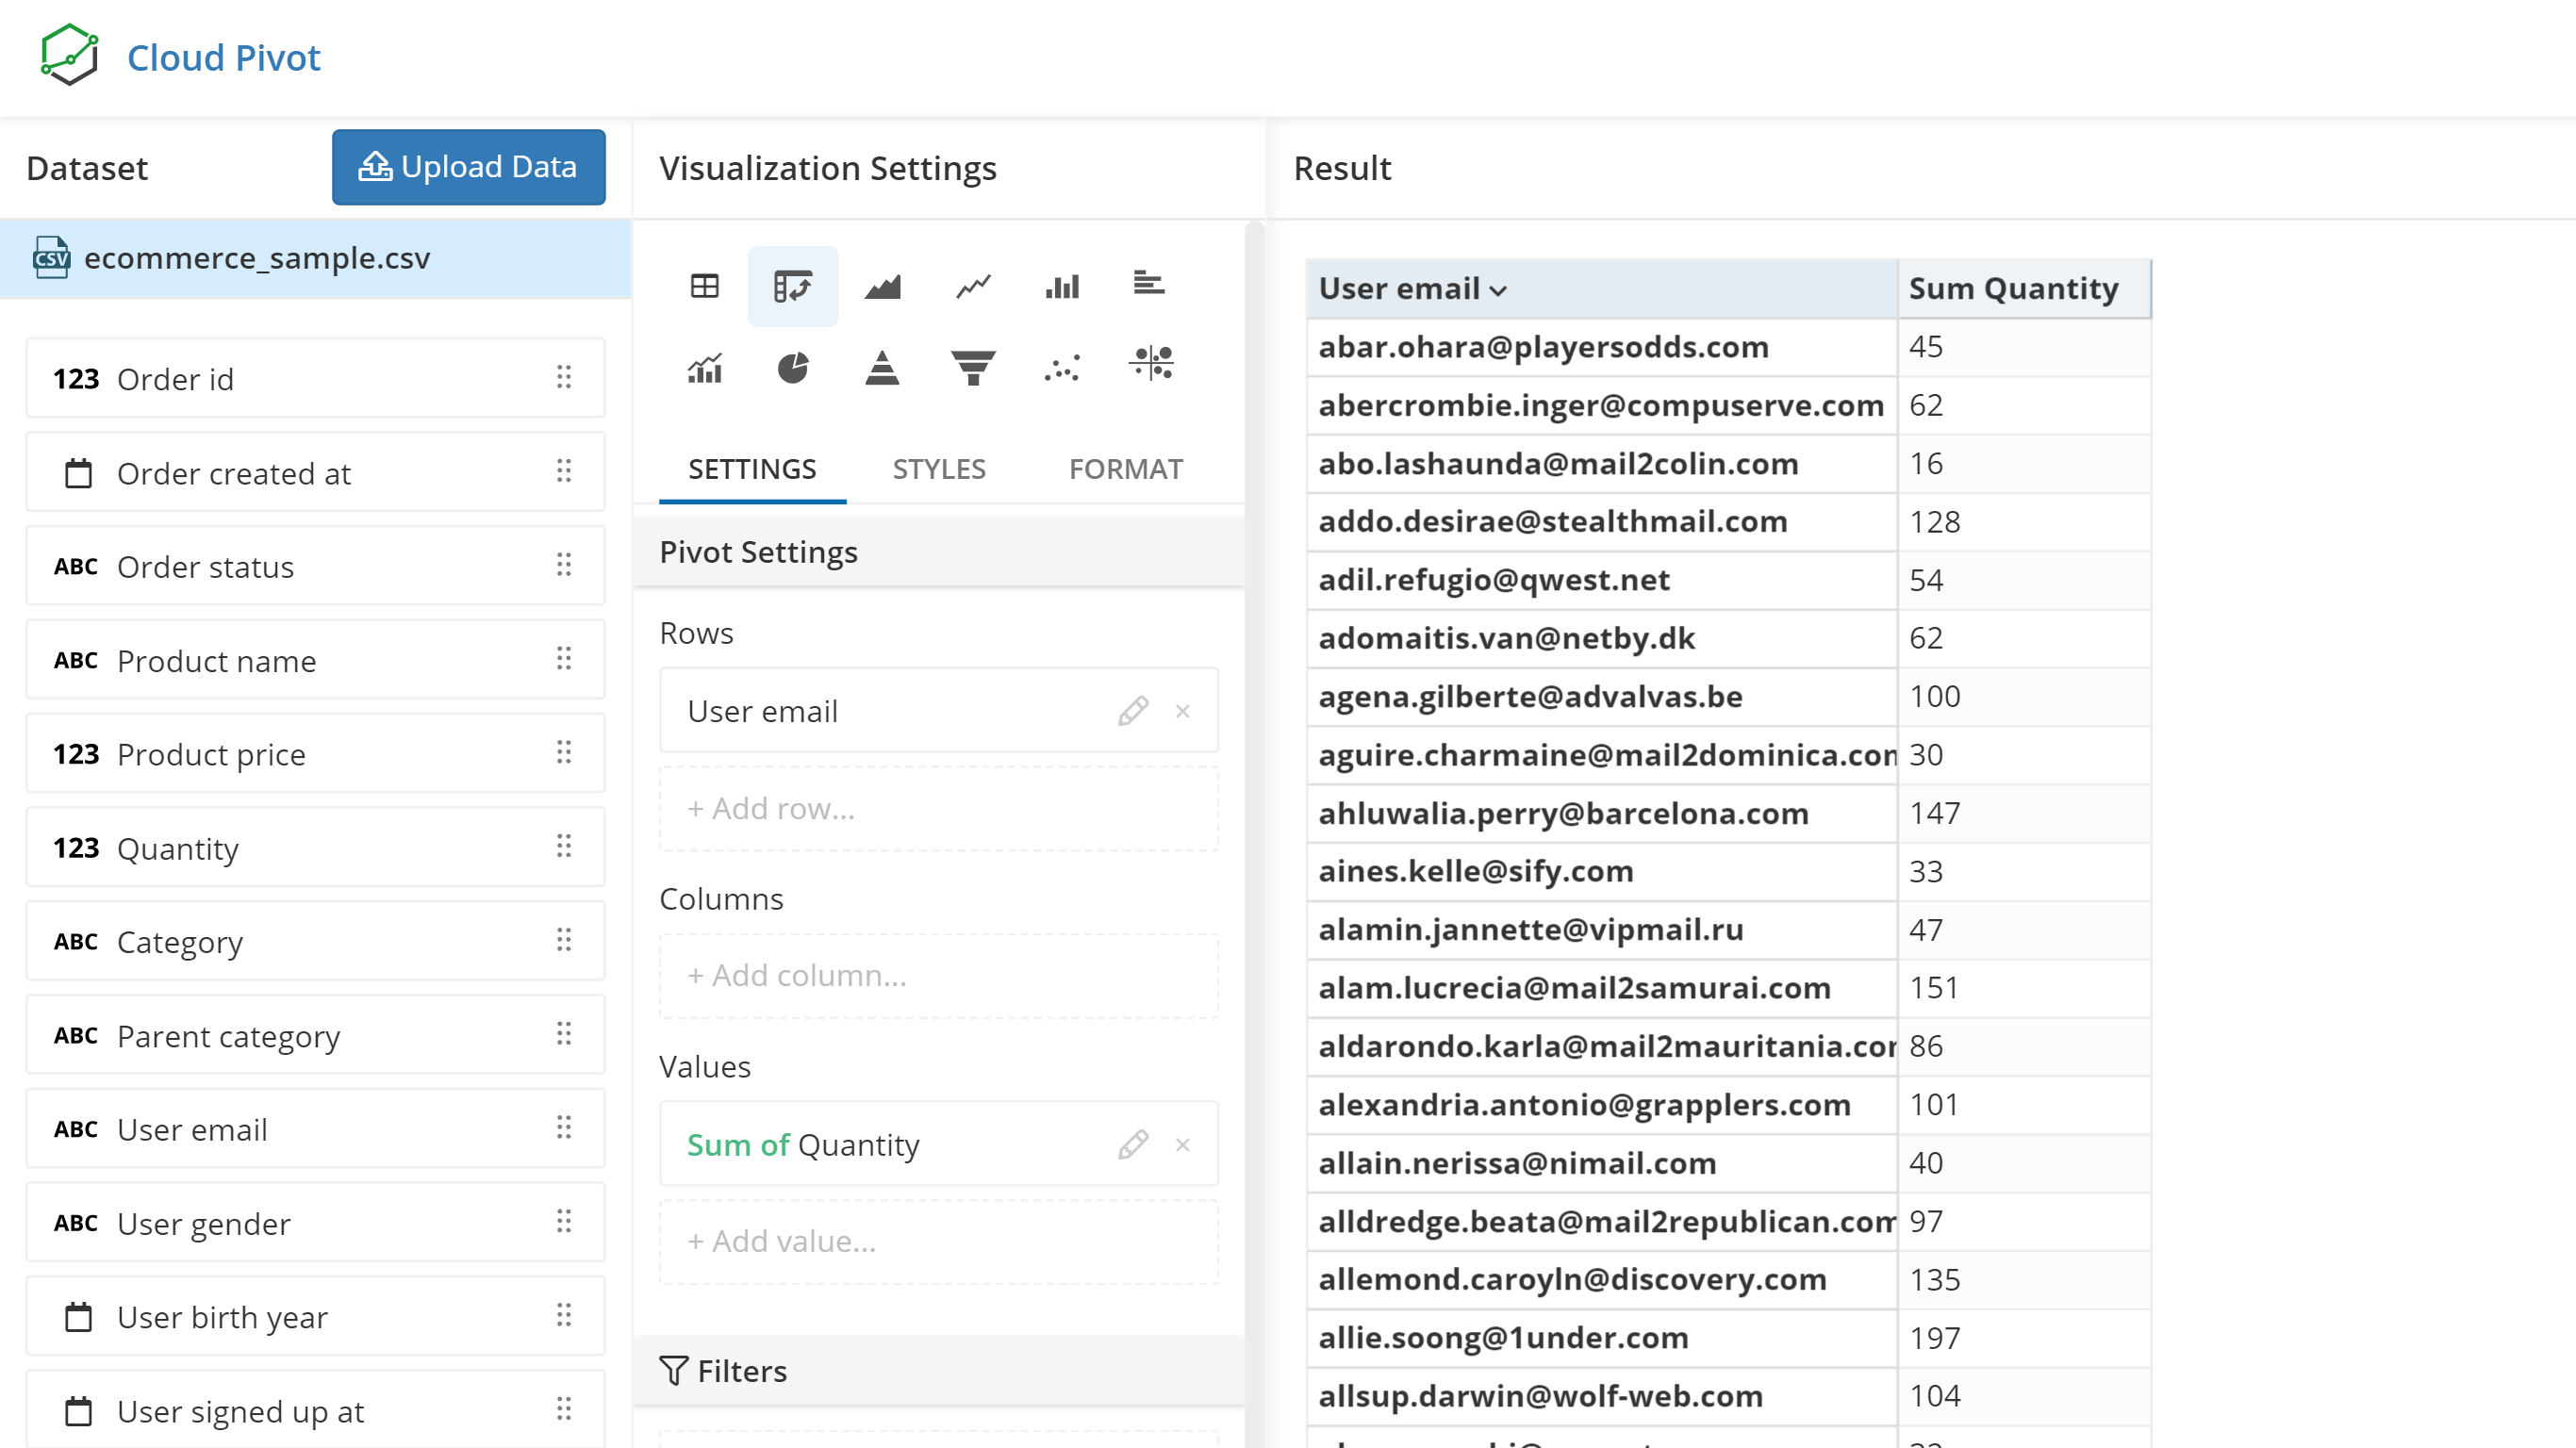
You need to define the table rows and values
- Add User Email to Rows Area
- Add Order Quantity to Values Area
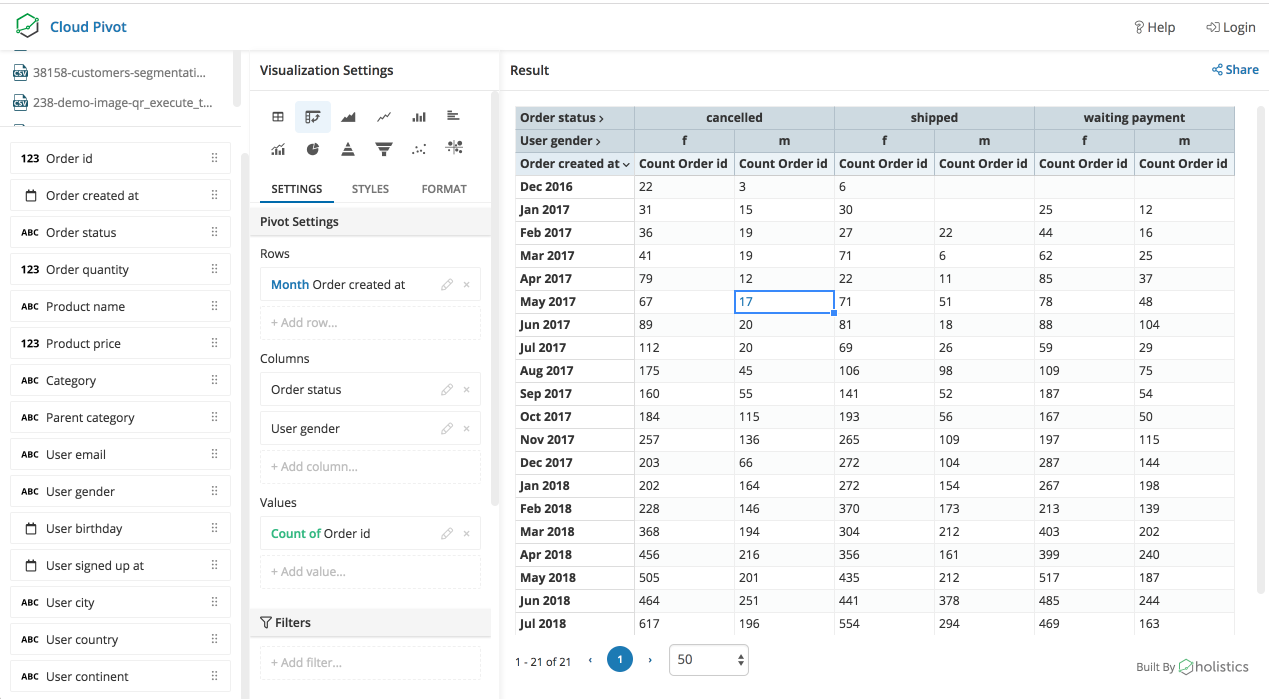
Just like that, the Pivot table has automatically aggregated the number of Orders (a Count of Order id) that each customer has made:
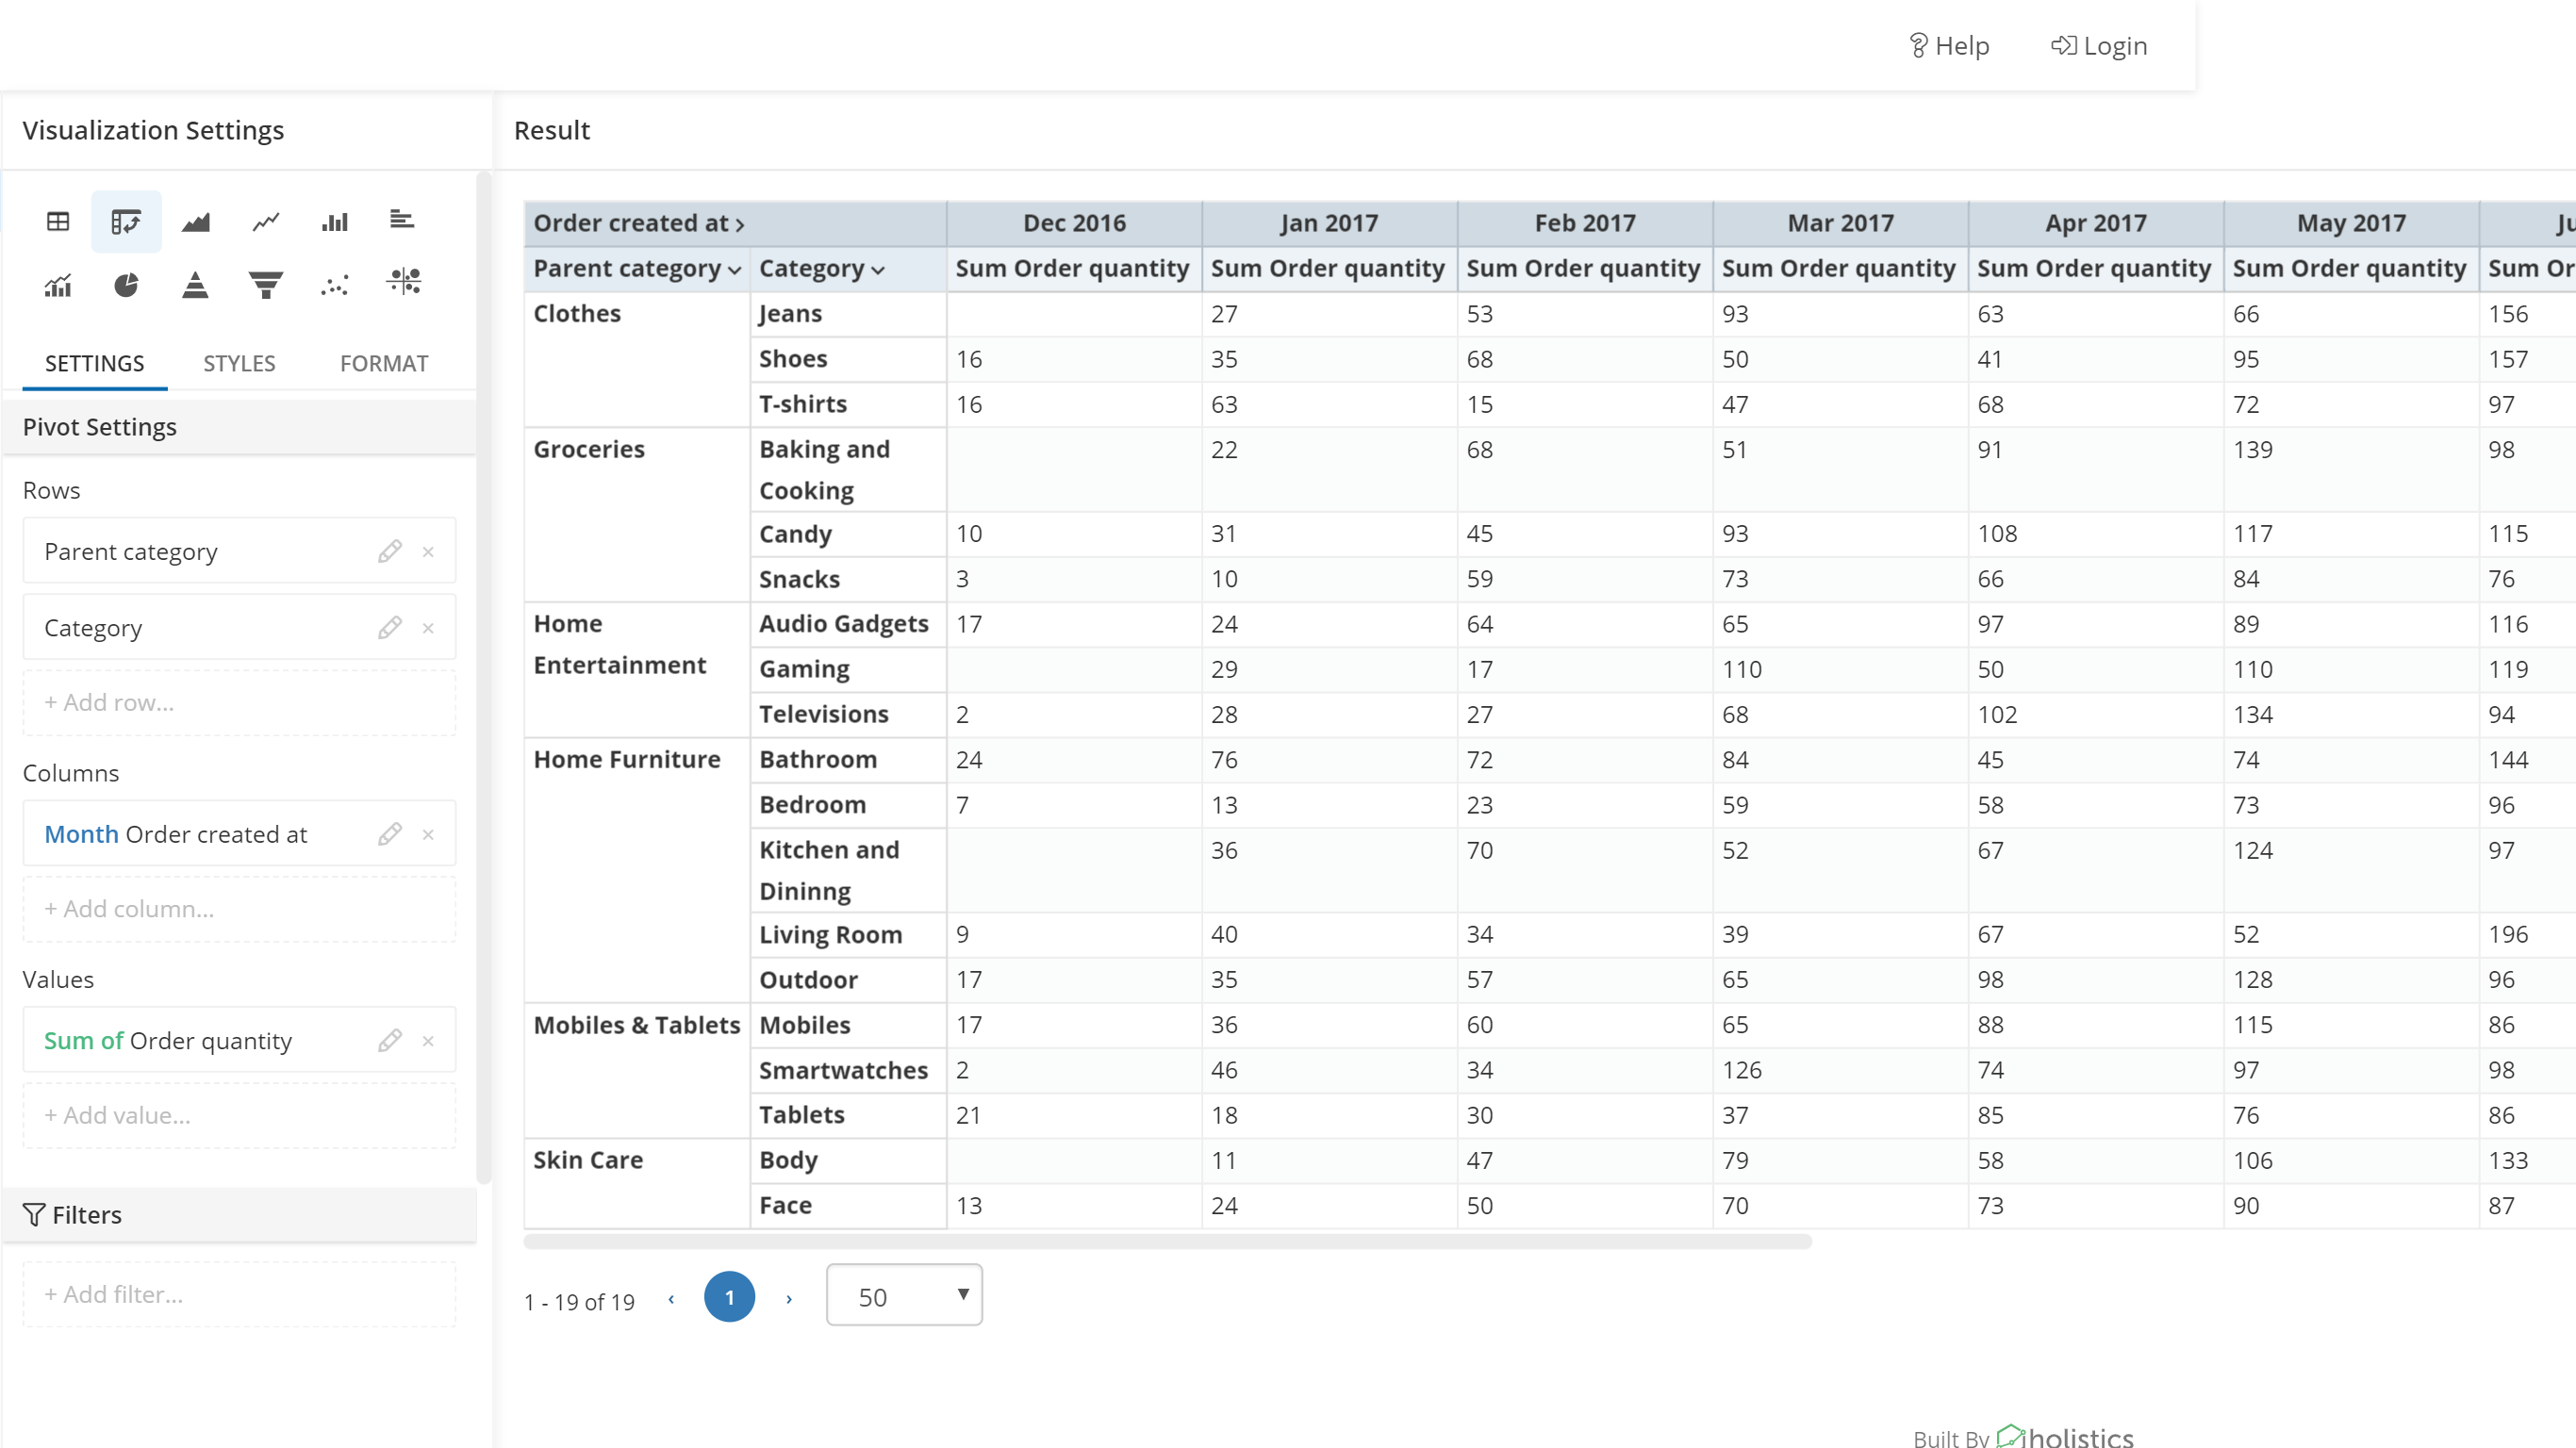
Example 2: The amount of each type of product that has been purchased through time
In this case, you would have to add Order created at to Column area.
FAQs
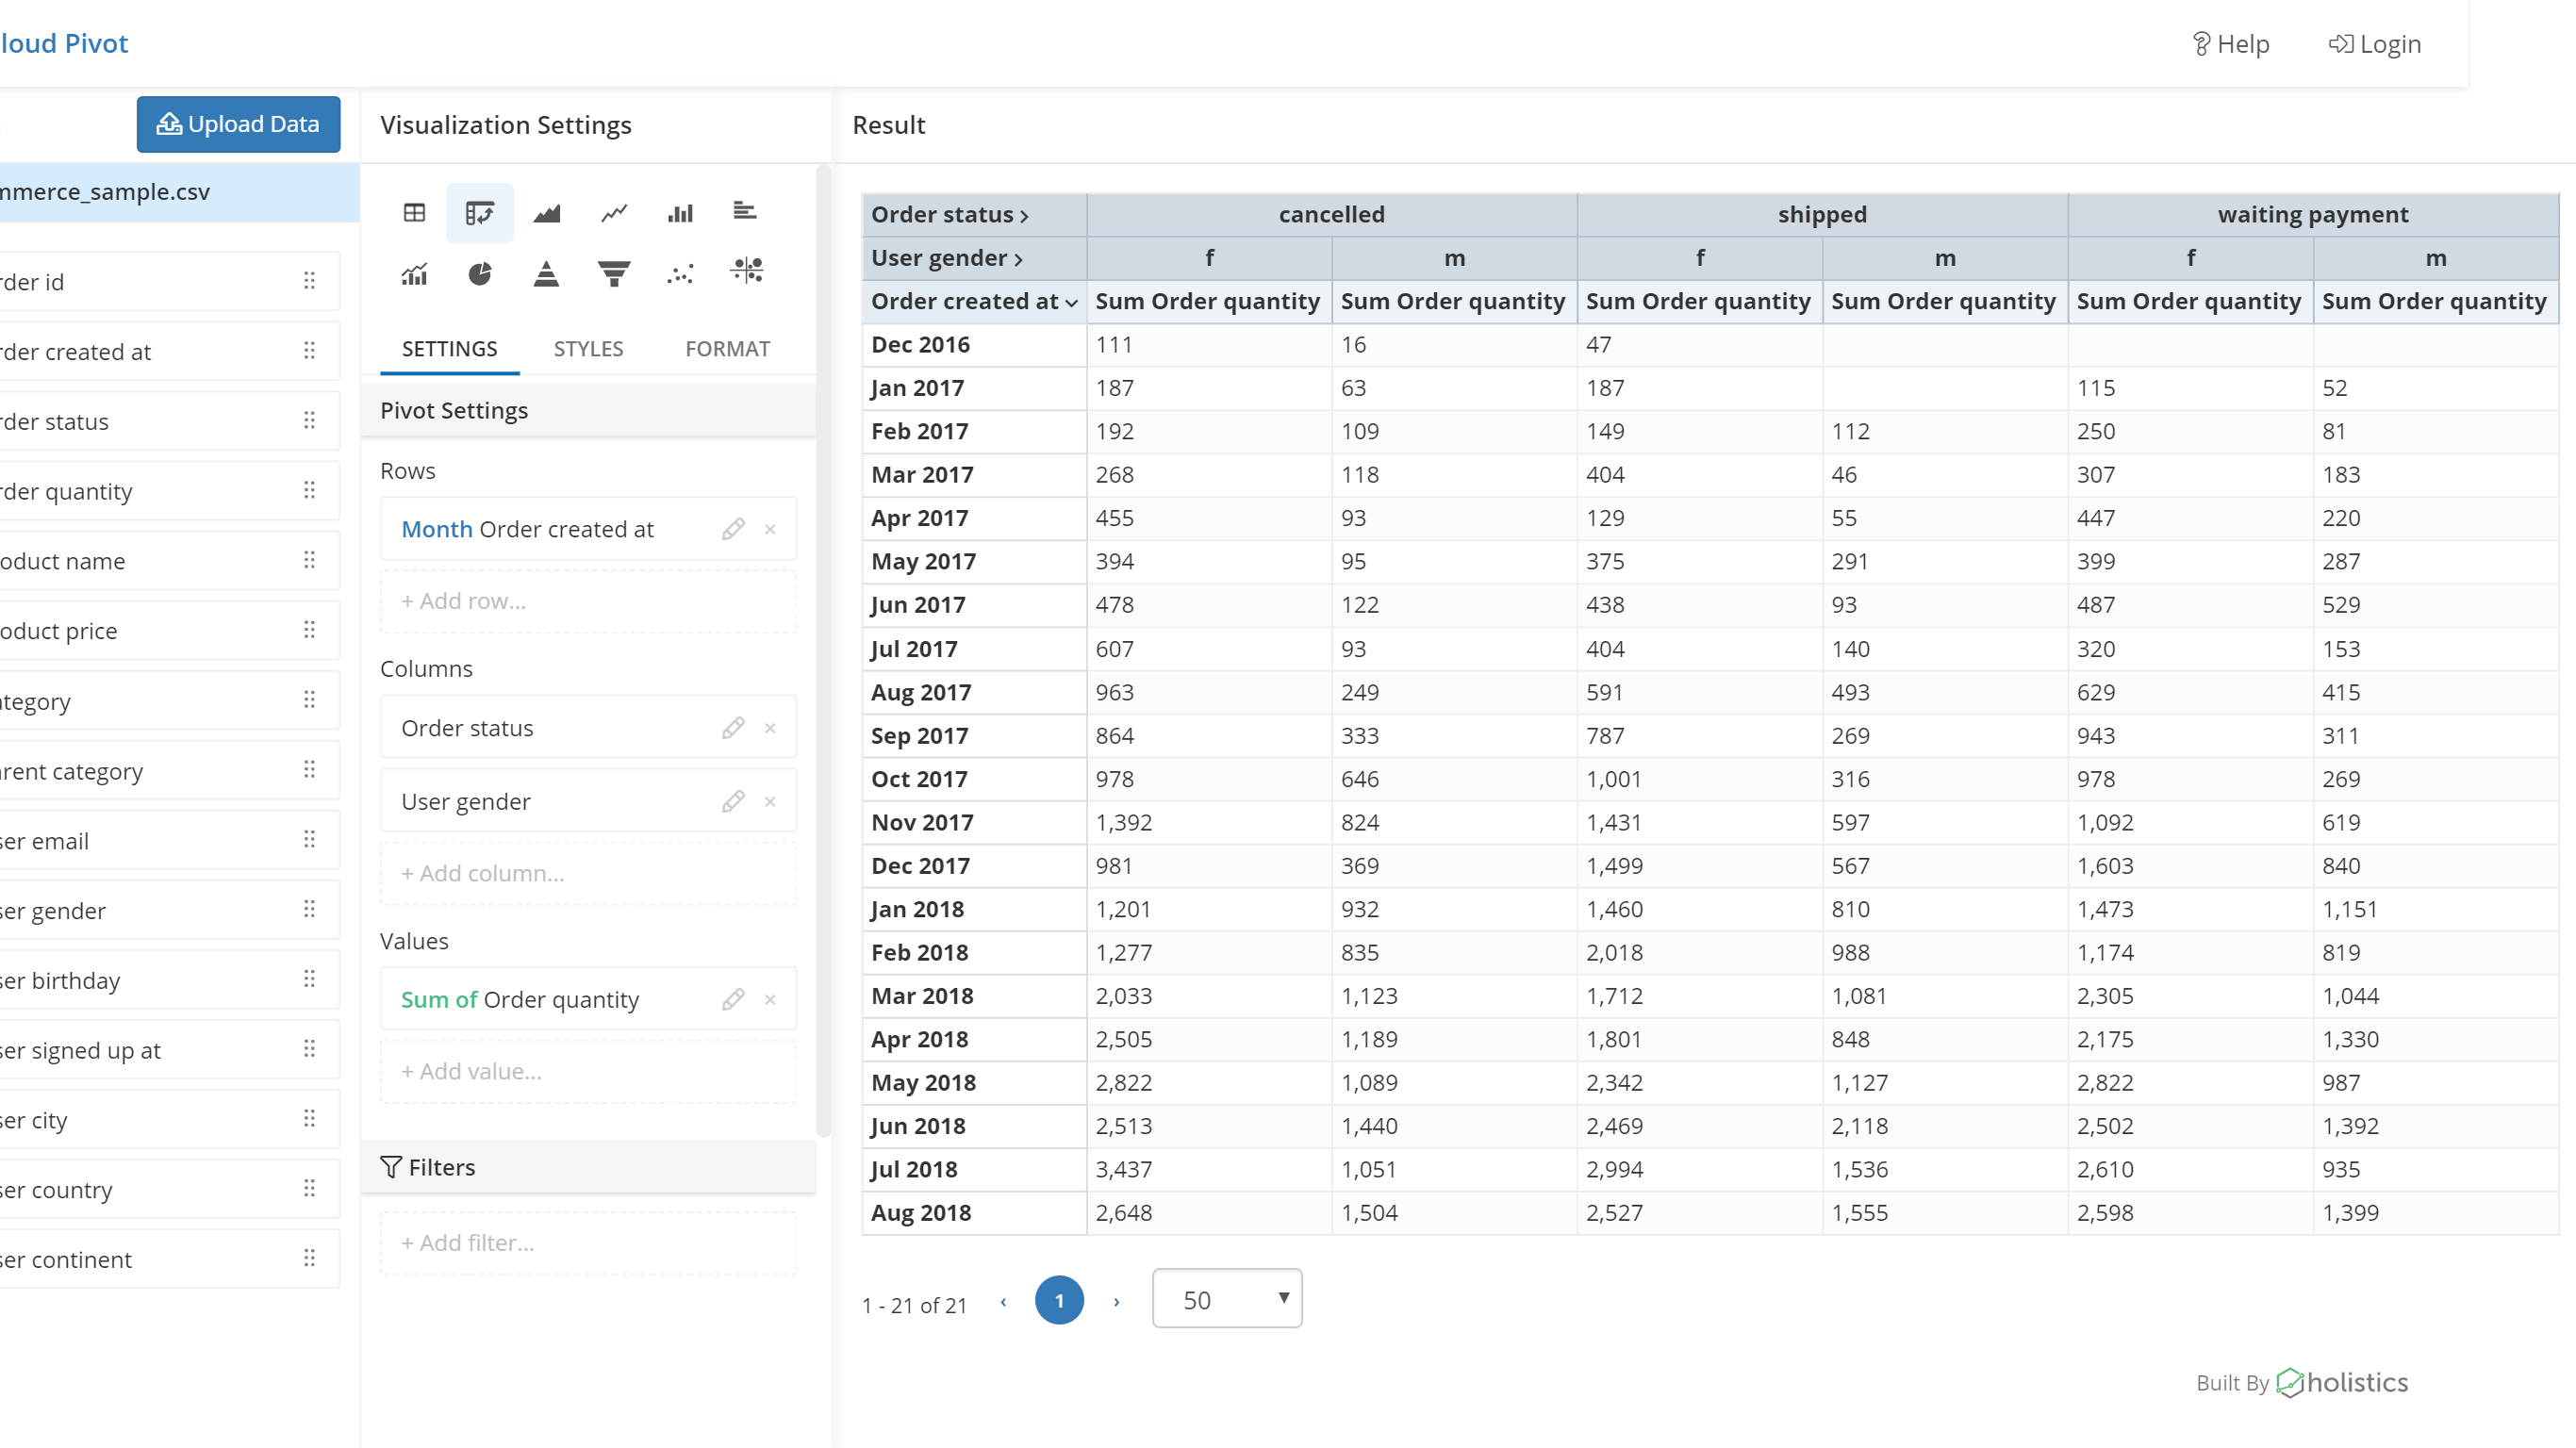
Blank Cell in your Pivot Table
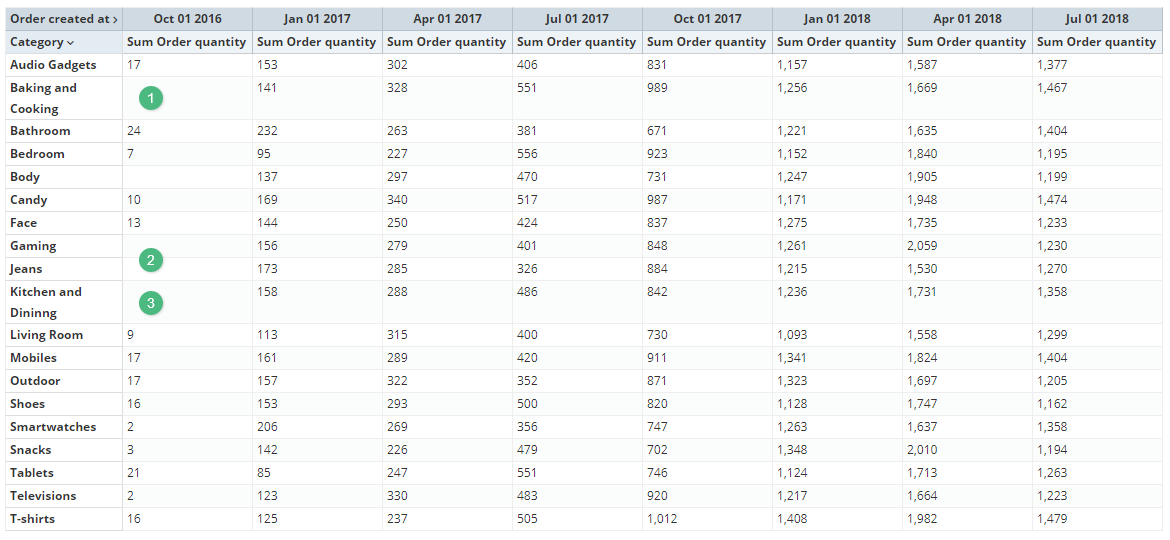
As you can see, the Pivot Table contains Blanks and this happens most commonly because the source data just does not contain an entry for that particular Sub-total. In the example above, this could be because the particular product category did not have any orders at Oct 01 2016.