Ship customer-facing analytics
in hours not months
Launch interactive dashboards your users will love with minimal engineering effort. Enterprise-grade security and support for multiple clients included.


Delight Users
Deliver interactive dashboards your users will love.
Retain Customers
Increase user engagement with full self-service experience.
White-Label Perfect
Match your brand so perfectly, customers think you built it.
Gain Competitive Advantage
Differentiate your product with advanced analytics.
Monetize Data
Enable new revenue streams with embedded analytics.
Scale Growth
Pricing that scales with your business needs.
Protect Enterprise Data
Built-in security and multi-tenancy.
Empower Developers
Minimal engineering effort required.
Ship Fast
Ship your reporting product quickly in hours, not months.
Interactive and Highly Customizable Dashboards
Build beautiful, pixel-perfect dashboards in Holistics with the innovative Canvas Dashboard. Style charts and dashboard components to match your application style with our Custom Themes.
Design flexible dashboards that match your app's look and feel
Build beautiful, pixel-perfect dashboards in Holistics with the innovative Canvas Dashboard.
Style charts and dashboard components to match your application style with our Custom Themes.
"I want to make more customized dashboards and engage our users even more. This feature really provides a wide array of possibilities on what can be designed in a dashboard"

Anders Kruse
Senior Data Scientist, Kristeligt Dagblad
Maintain with ease using reusable components
Parameterize your reporting widgets and dashboard components using variables, and reuse them anytime, anywhere.
No more manually recreating new dashboards for every new data request.
Full self-service BI experience for end users
Slice, dice, pivot your data, do free-style exploration to get insights with a familiar drag-and-drop interface.
Filter out irrelevant data, compare periods, drill through and down - all with just a few clicks.
A Developer Experience You’ll Actually Love
Other BI tools make building a great SSBI experience a pain. Holistics makes it easy, because it’s built for developers first. Holistics’ approach lets you set up a great experience quickly, cleanly, and maintainably.
Everything is saved as code
Use software engineering best practices for dashboard development.
Define reusable functions, govern with Git version control, perform code reviews and refactor at scale.
Perform code reviews of dashboard changes before publishing
Every change made is version controlled as code. Put them in a branch. Perform proper code reviews before pushing to production.
Your dashboard development deserves the same treatment as software development.
"We evaluated 19 platforms against our main requirements - embedding, git, no-code visualization. At each stage, Holistics has performed very well. Straightforward embedding, familiar end-user workflow, and flexible drill-through navigation are really exciting features."

Bob Adams
Sr. BI Analyst, Spoiler Alert
Better change management with Version Control
Know who changes what and when.
Review every update and undo any mistakes. Subject your dashboard to the same rigorous workflow as software engineering.
Integrate with your product with a few lines of code
Embed dashboards to your application with a few lines of code.
Our extensive row-level security with server-side security tokens (JWT) ensures each customer only sees their own data.
"What really excites me about Holistics is how little maintenance is needed for dashboards and embedding in the app."

Julia Fraquelli
Senior Product Manager, Raft AI
Multi-Tenancy That Keeps
Your Data Boundaries Bulletproof
Built-in user organization with strict data boundaries, workspace isolation, and seamless integration with your existing user system.
Secure Boundaries
Ensure users only access the data they’re authorized to see.
Workspace Isolation
Each team has its own workspace and can’t view dashboards created by others.
Seamless Authentication
Plug in your existing org and user structure by simply passing user_id and org_id.
We evaluated BI tools across the market. I went through an evaluation process, reviewing around 41 options, including mature companies, startups, open source solutions. During that process, I stumbled upon Holistics, tried it, and liked it.
— Staff Data Scientist at Aurora (NASDAQ-listed company)

5-minute walkthrough
Watch this video to learn how to implement a quick embedding dashboard with Holistics in just under 5 minutes.
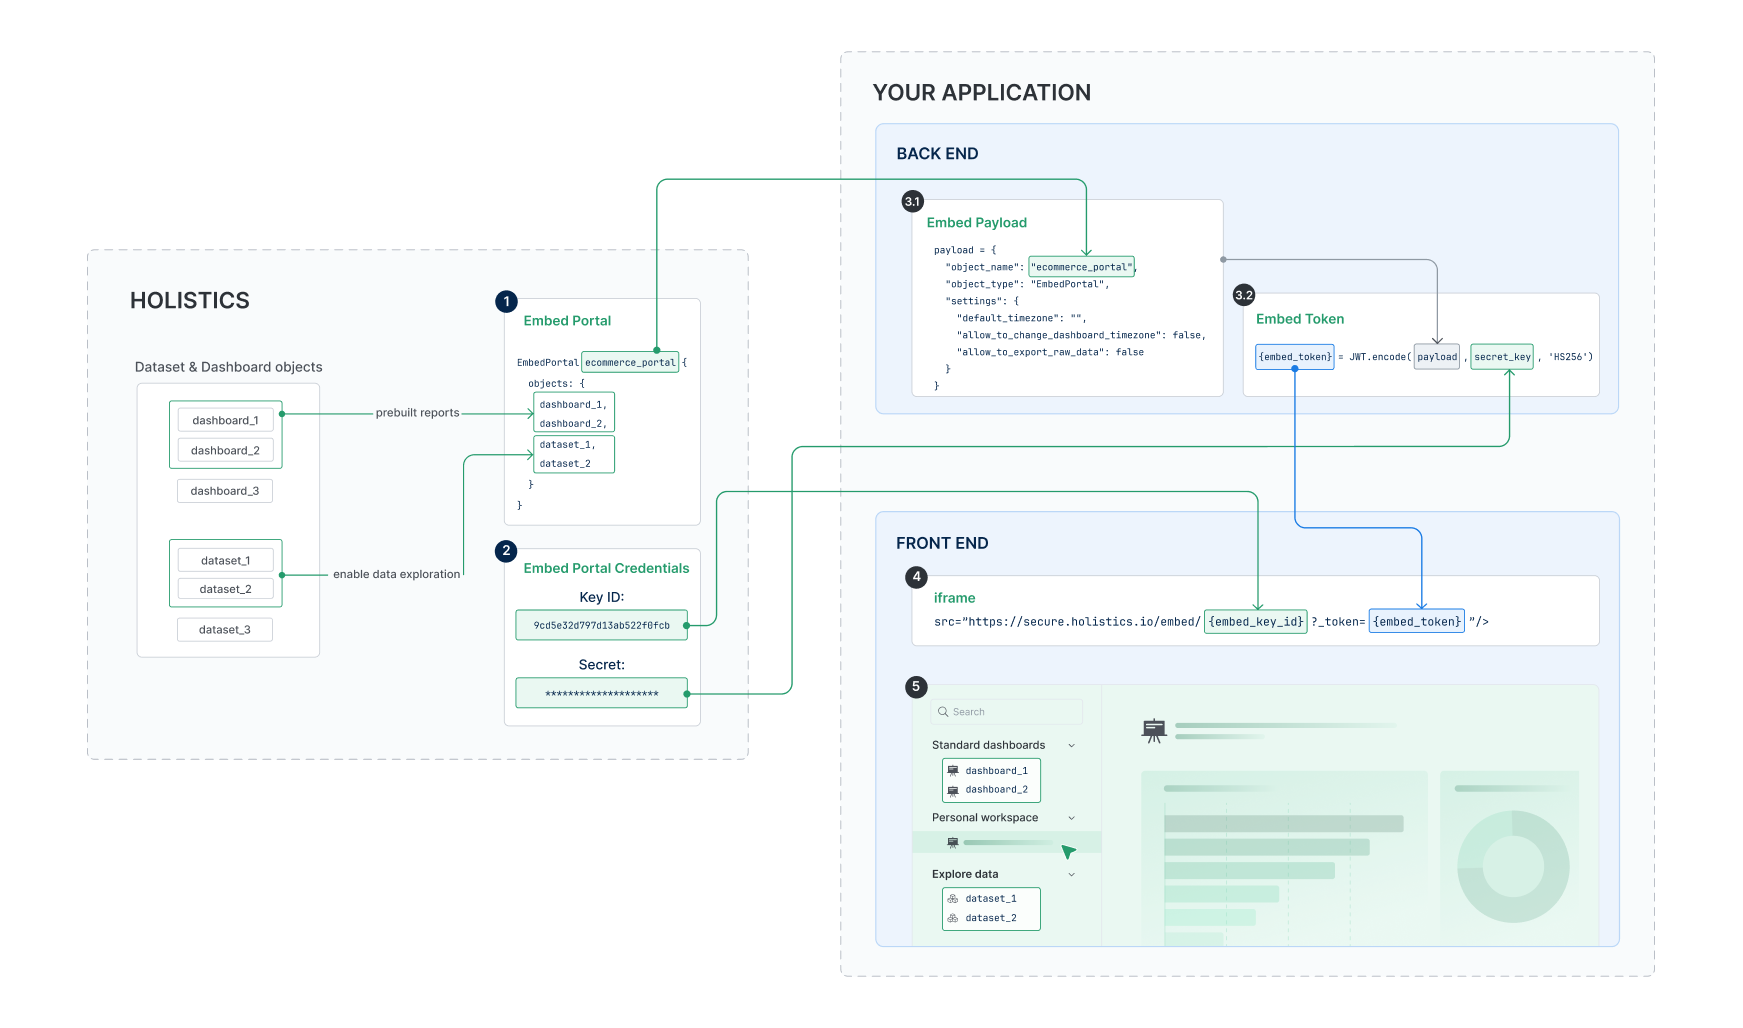
Embedded Analytics helps you create external dashboards for partners/customers to interact with as part of your own application, without compromising data access and security within 3 steps:
1. Setup Report/Dashboard Settings
2. Embed your Report/Dashboard
3. Share it with your customers.
Here's How Happy Our Customers Are
Want to share data beyond in-app reports?
If your customers request data beyond the in-app embedding reports, you can build custom reports inside Holistics and share them with customers without the need to grant them an account to access Holistics.
Shareable Links
Create password-protected shareable dashboards to share with customers. Set up strict access control so that each customer can only see their own data.
Email Reports
Deliver reports directly to customers mailbox.
Google Sheets or SFTP
Push data directly to spreadsheets or SFTP.
Frequently Asked Questions
How does Embedded Analytics work?
Still unclear? Schedule a Demo with us.
How do you make sure each of my client can only see their data?
The client_id is also securely encrypted so that no client can hijacks and see other client's data.
Do I need to upload my data to your platform?
What is your pricing like?
How long does it take to set it up?
What backend languages do you support?
We also have sample code in Ruby, Python, NodeJS, PHP, Elixir, etc.. to help you get started quickly.