





Holistics' Features

Come battery-included with powerful functionalities that enable a truly self-service experience for teams.

Filter by:

Self-Service BI Powered by a Semantic Modeling Layer

Define metrics and data relationships centrally to enable true Self-Service BI with consistency and confidence.

AI-assisted Self-service

Empower users to answer their own questions faster with AI-guided insights and recommendations.

Learn more

Interactive Dashboard

Monitor and analyze key metrics with Filters, Drill-through, Exploration, Date Drill and Cross-filtering.

Learn more

Self-service Report Builder

Explore data with a simple drag-and-drop interface and create your own reports with minimal technical support.

Learn more

Mobile-Friendly

Ensure your dashboards look good across screen sizes.

Learn more

Complex Visualizations

Metric Sheets, Geo Maps, Retention Heatmap and Conversion Funnel.

Learn more

Report Export

Export reports as tabular data (CSV, Excel) and PDF.

Feature preview Learn more

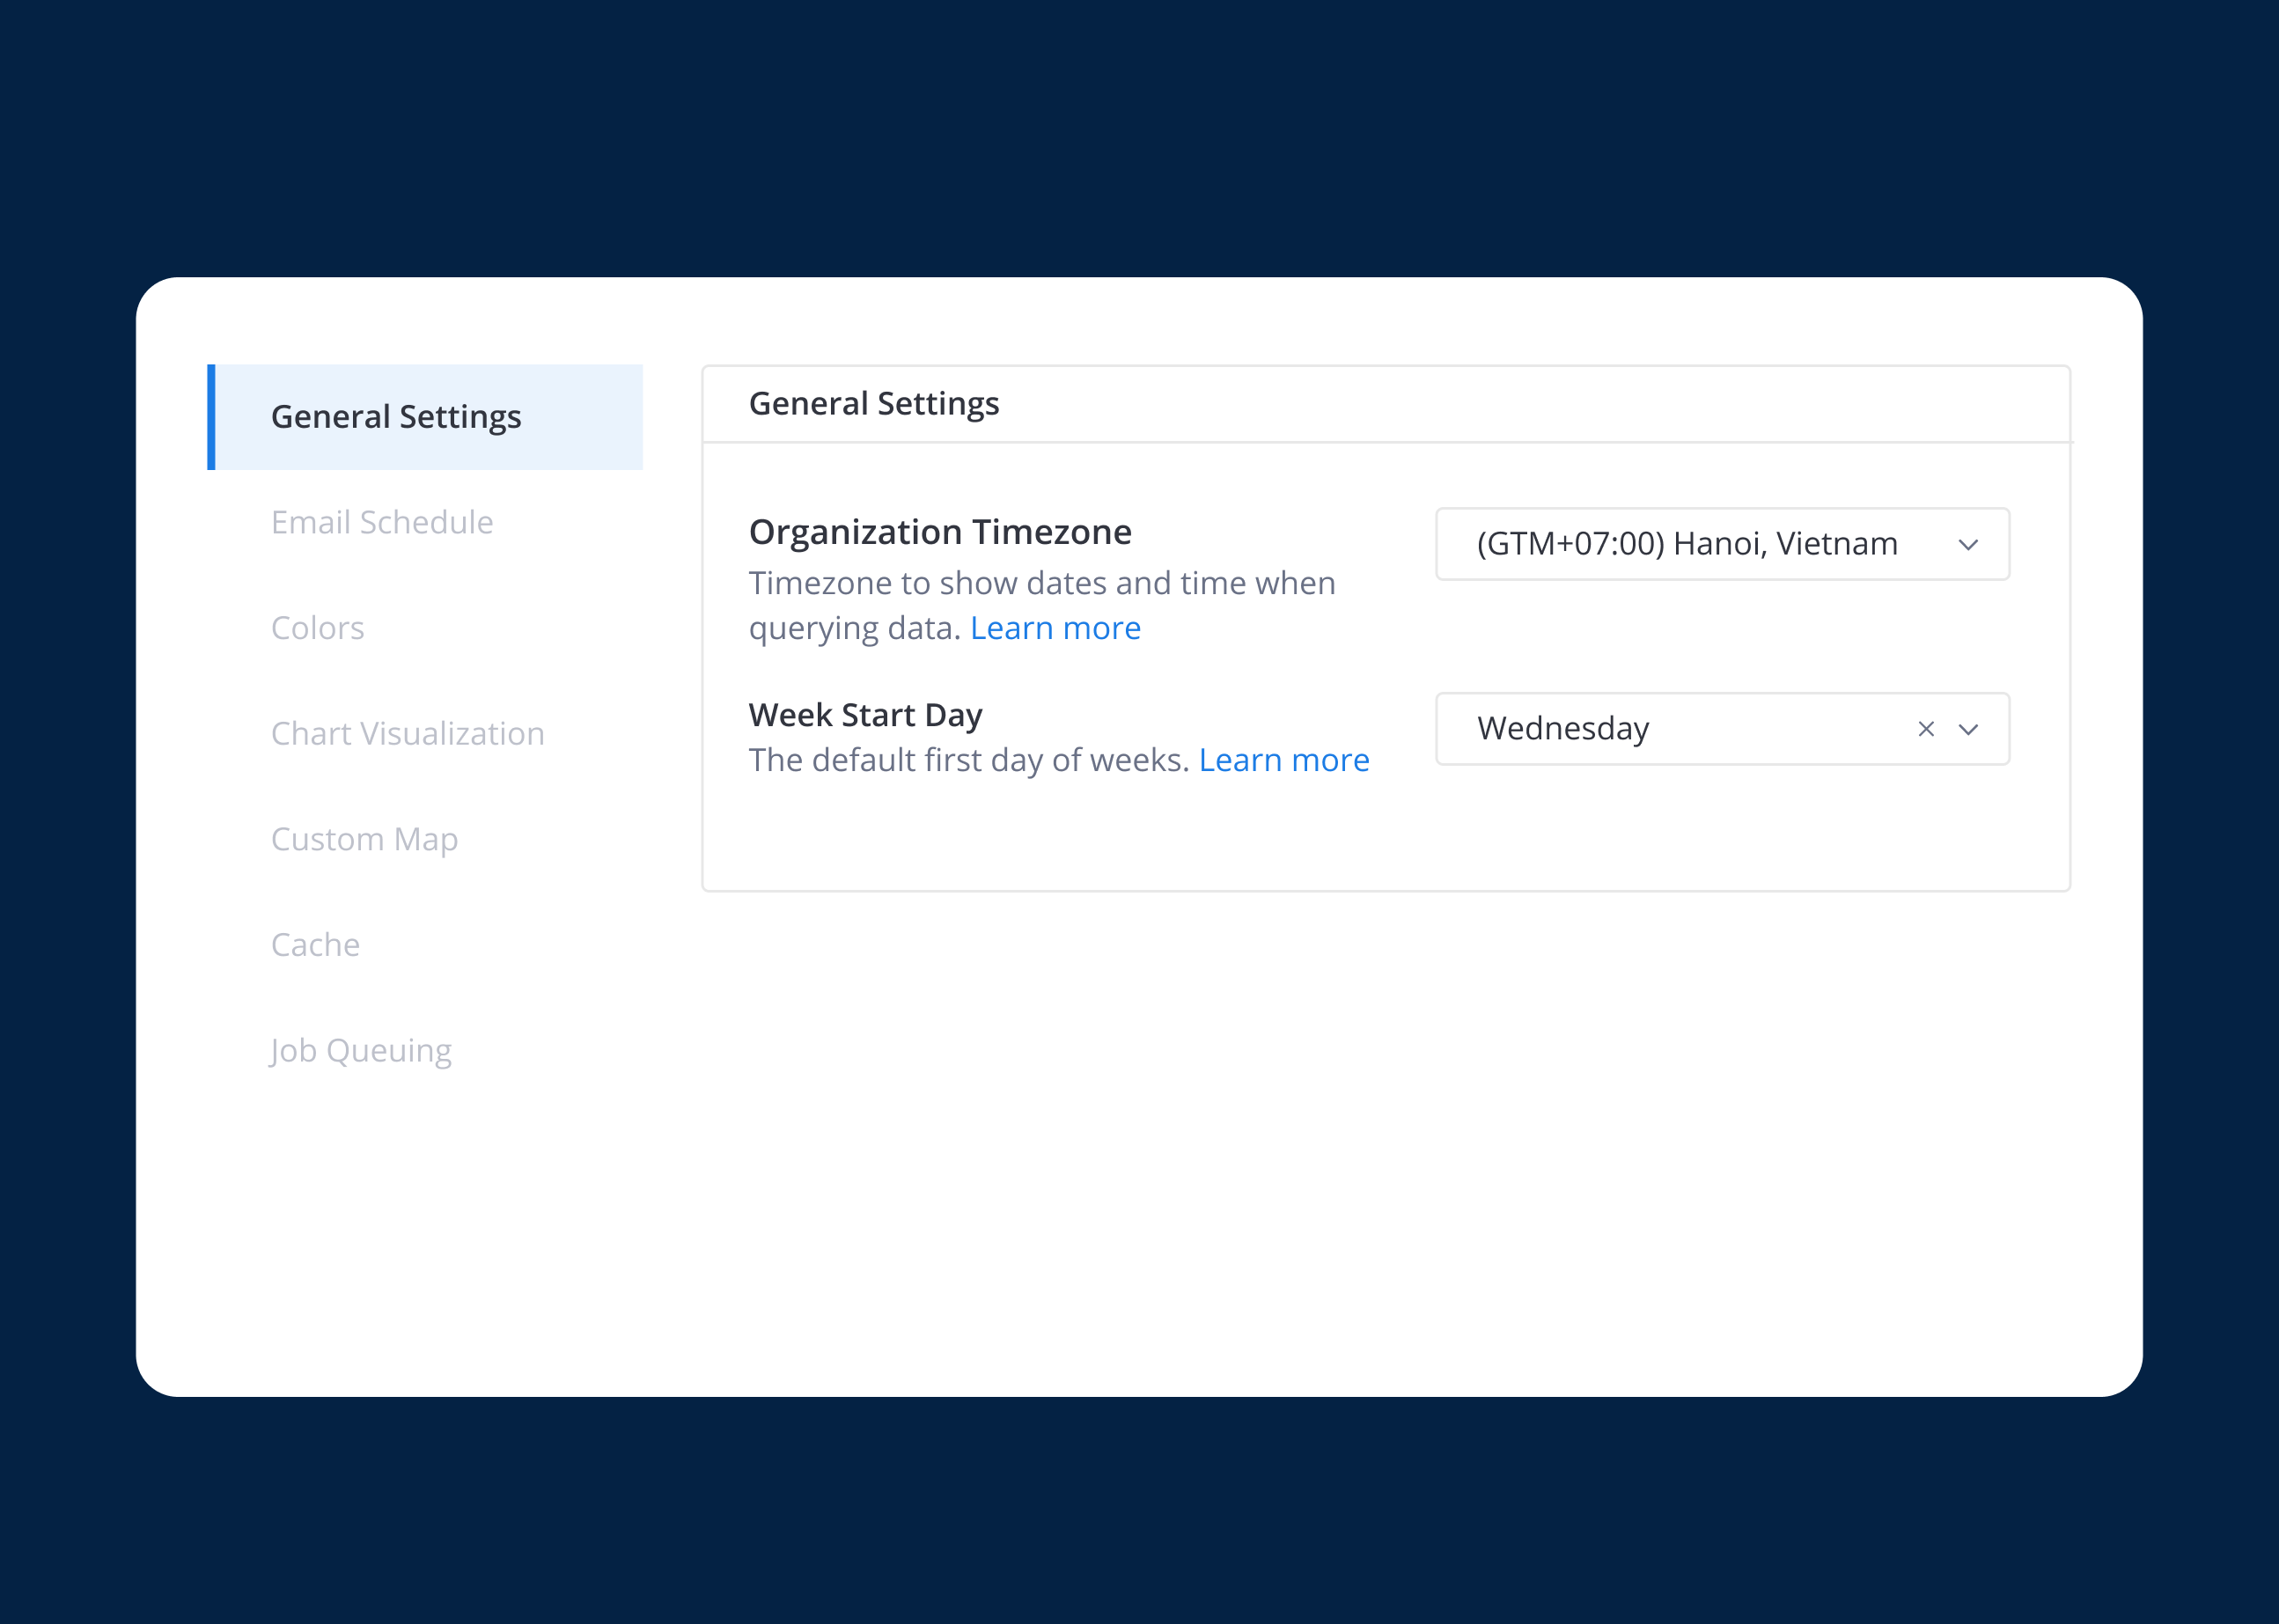
Smart Timezone

Automatically convert datetime values to your business timezone or user's local timezone.

Feature preview Learn more

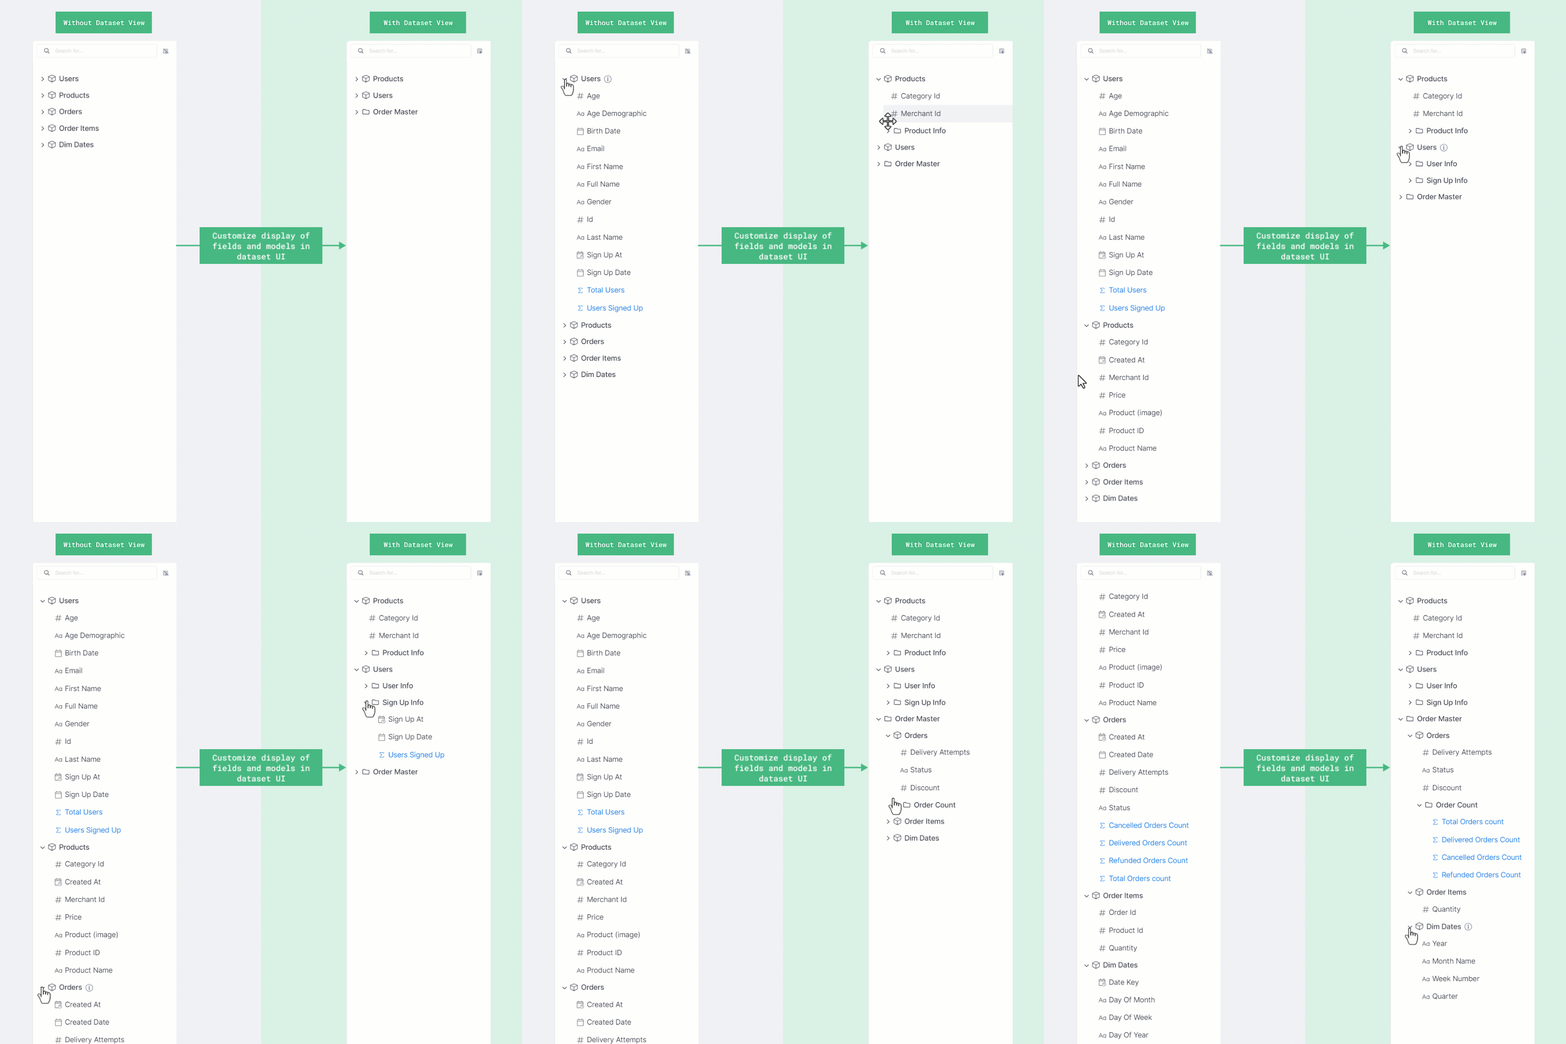
Dataset Custom Views

Give business teams the power of curated datasets to enable self-service analytics.

Feature preview Learn more

Filters

Instantly zoom in on the data that matters most.

Learn more

Cross-filtering

Make a selection in one chart and see all related visualizations update dynamically for better insights.

Learn more

Date Drill

Seamlessly drill down from years to seconds to uncover time-based patterns.

Learn more

Drill-through

Go from high-level summaries to in-depth details with a single click.

Learn more

Drill-down

Break down a data value by specific dimensions with just a few clicks.

Learn more

View Underlying Data

Quickly see what makes up a value at the most detailed level.

Learn more

Table Interactions

Personalize your analysis by customizing, sorting, and manipulating table data with ease.

Learn more

Period-over-Period Comparison

Compare current performance to previous weeks, months, or years.

Learn more

Trend Line

Automatically highlight trends and movements in your metrics over time.

Learn more

Reference Line

Quickly compare performance against key targets or benchmarks.

Learn more

Percent of Total

Quickly see the distribution of a measure by specific dimensions, such as sales percentages by country or product category.

Learn more

Moving Calculations

Smooth out fluctuations with moving average, or calculate cumulative sum over time.

Learn more

Analytics As-Code

Centralize business logic and metrics with unified as-code semantic layer.

As-Code Data Modeling

Store and version analytics logic in Git, enabling full programmatic control.

Learn more

As-Code Dashboard

Build interactive dashboards with programmatic customization and Git-based version control.

Learn more

As-Code Metrics (AQL)

Build composable, reusable metrics to ensure consistency and solve analytics problems faster.

Learn more

Git-based Version Control

Capture every change in Git, allowing users to trace history and restore a previous version if necessary.

Learn more

Data Transform

Transform data into reusable models for consistency and better performance.

Data Catalog

Centralize all data definitions for a whole company.

Data Lineage

Trace the lineage from model to dashboard for improved traceability.

Programmable BI

Apply software engineering best practices into your data analytics stack.

As-code Reusability

Apply software engineering principles to data teams with Holistics’ reusability functions, enabling you to build analytics products that meet immediate needs and scale with your business in the long run.

Feature preview Learn more

Dynamic Data Sources

Dynamically switch data sources based on who is viewing the dashboard.

Feature preview Learn more

CI/CD

Integrate analytics with your build system for better data quality.

Feature preview Learn more

API as first-class citizen

First-class API support to integrate Holistics with your workflow.

CLI

Command-line tools to pull data and trigger jobs.

Data Delivery

Share insights with stakeholders with a single click

Shareable Links

Create and share secure dashboard links for seamless collaboration.

Learn more

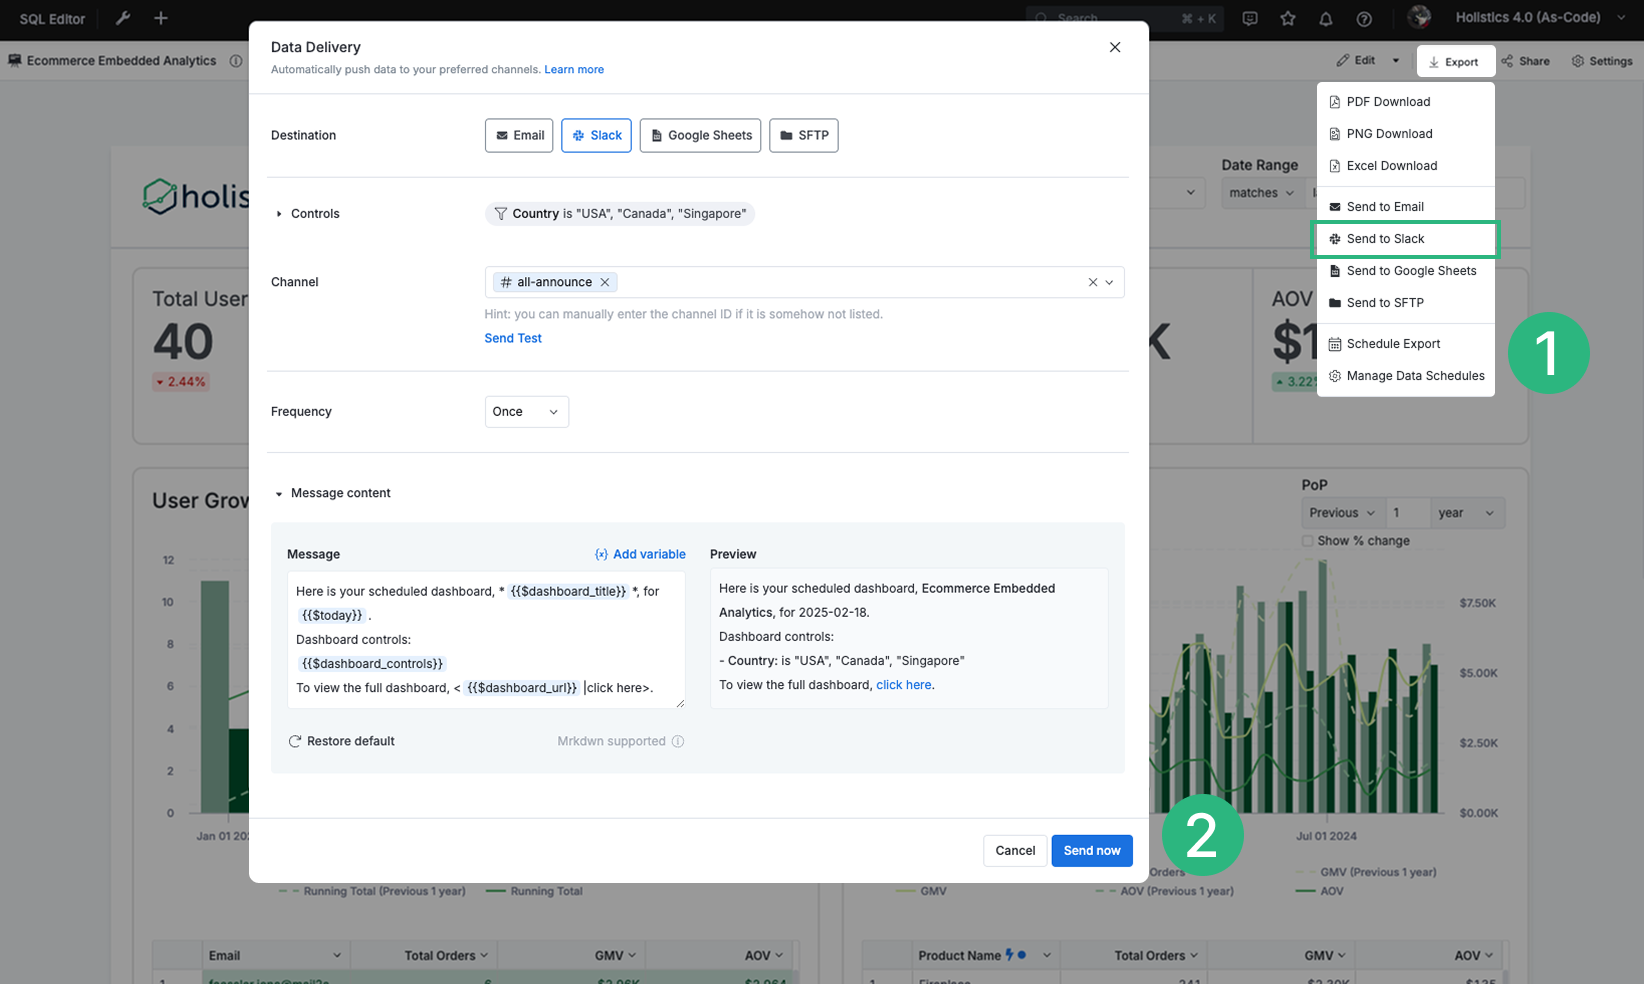
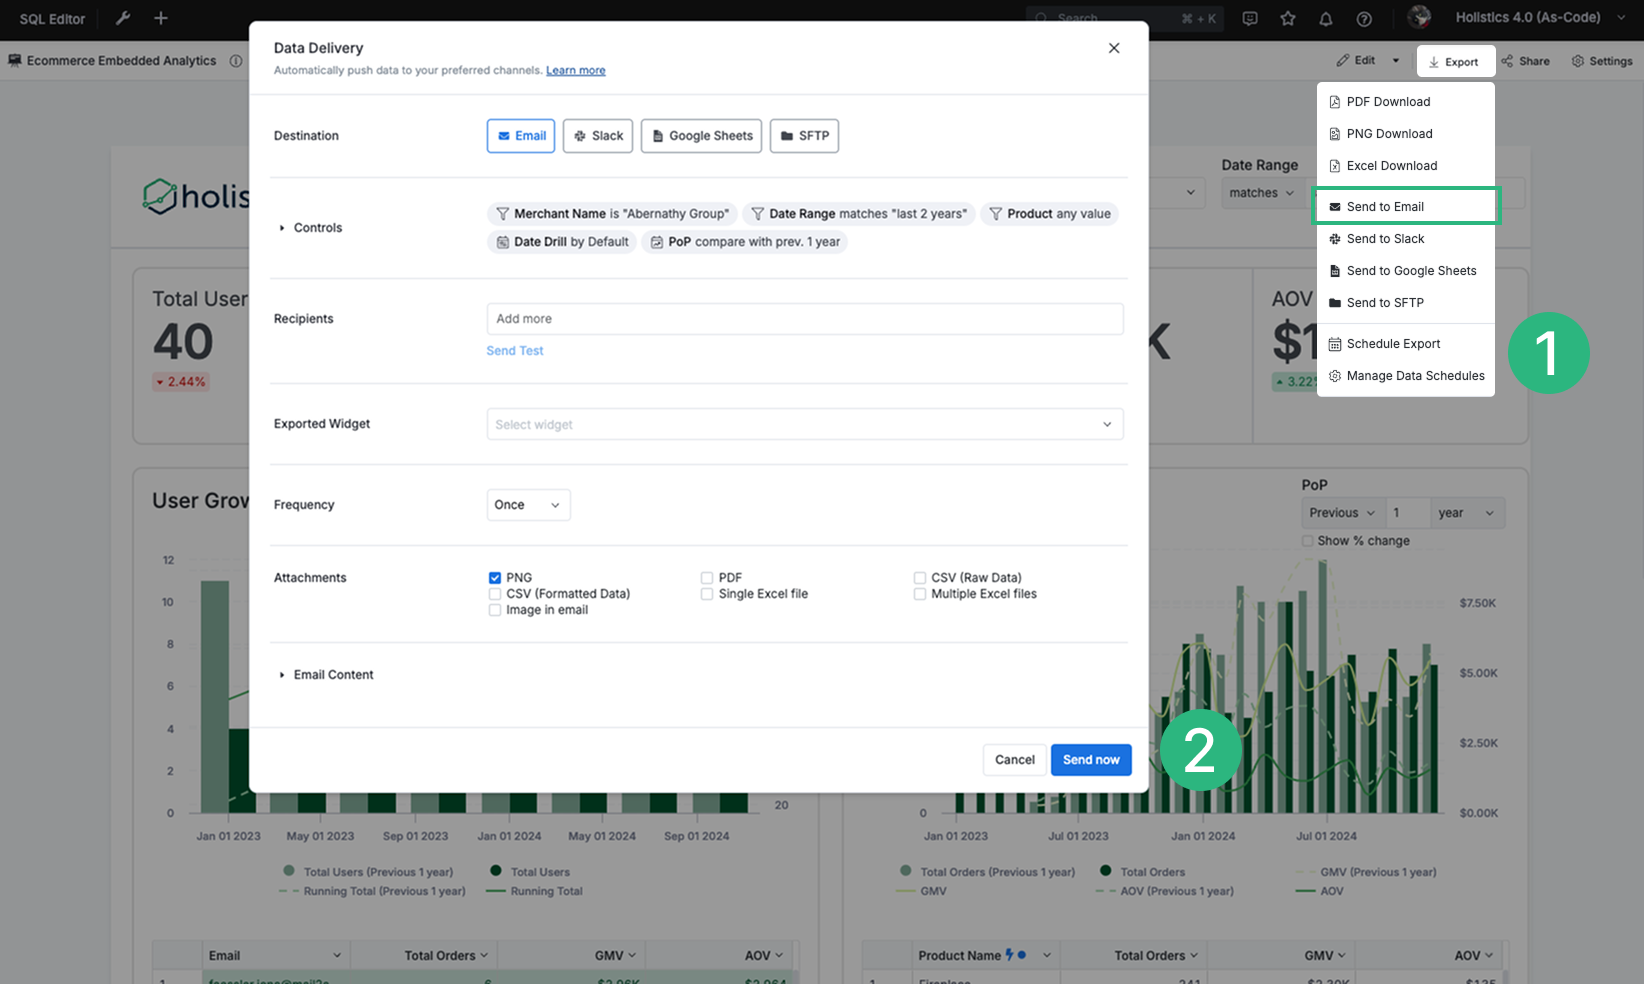
Data Schedule

Automatically deliver reports to Email, Slack, Google Sheets, or SFTP.

Learn more

Data Alert

Receive notifications when your data meets predefined conditions.

Feature preview Learn more

Public Embed

Easily embed interactive dashboards into your apps or websites for viewers without direct Holistics access.

Learn more

User Access Control

Simplify and improve data security across your company

User Roles and Groups

Control which actions users are allowed to perform in Holistics.

Feature preview Learn more

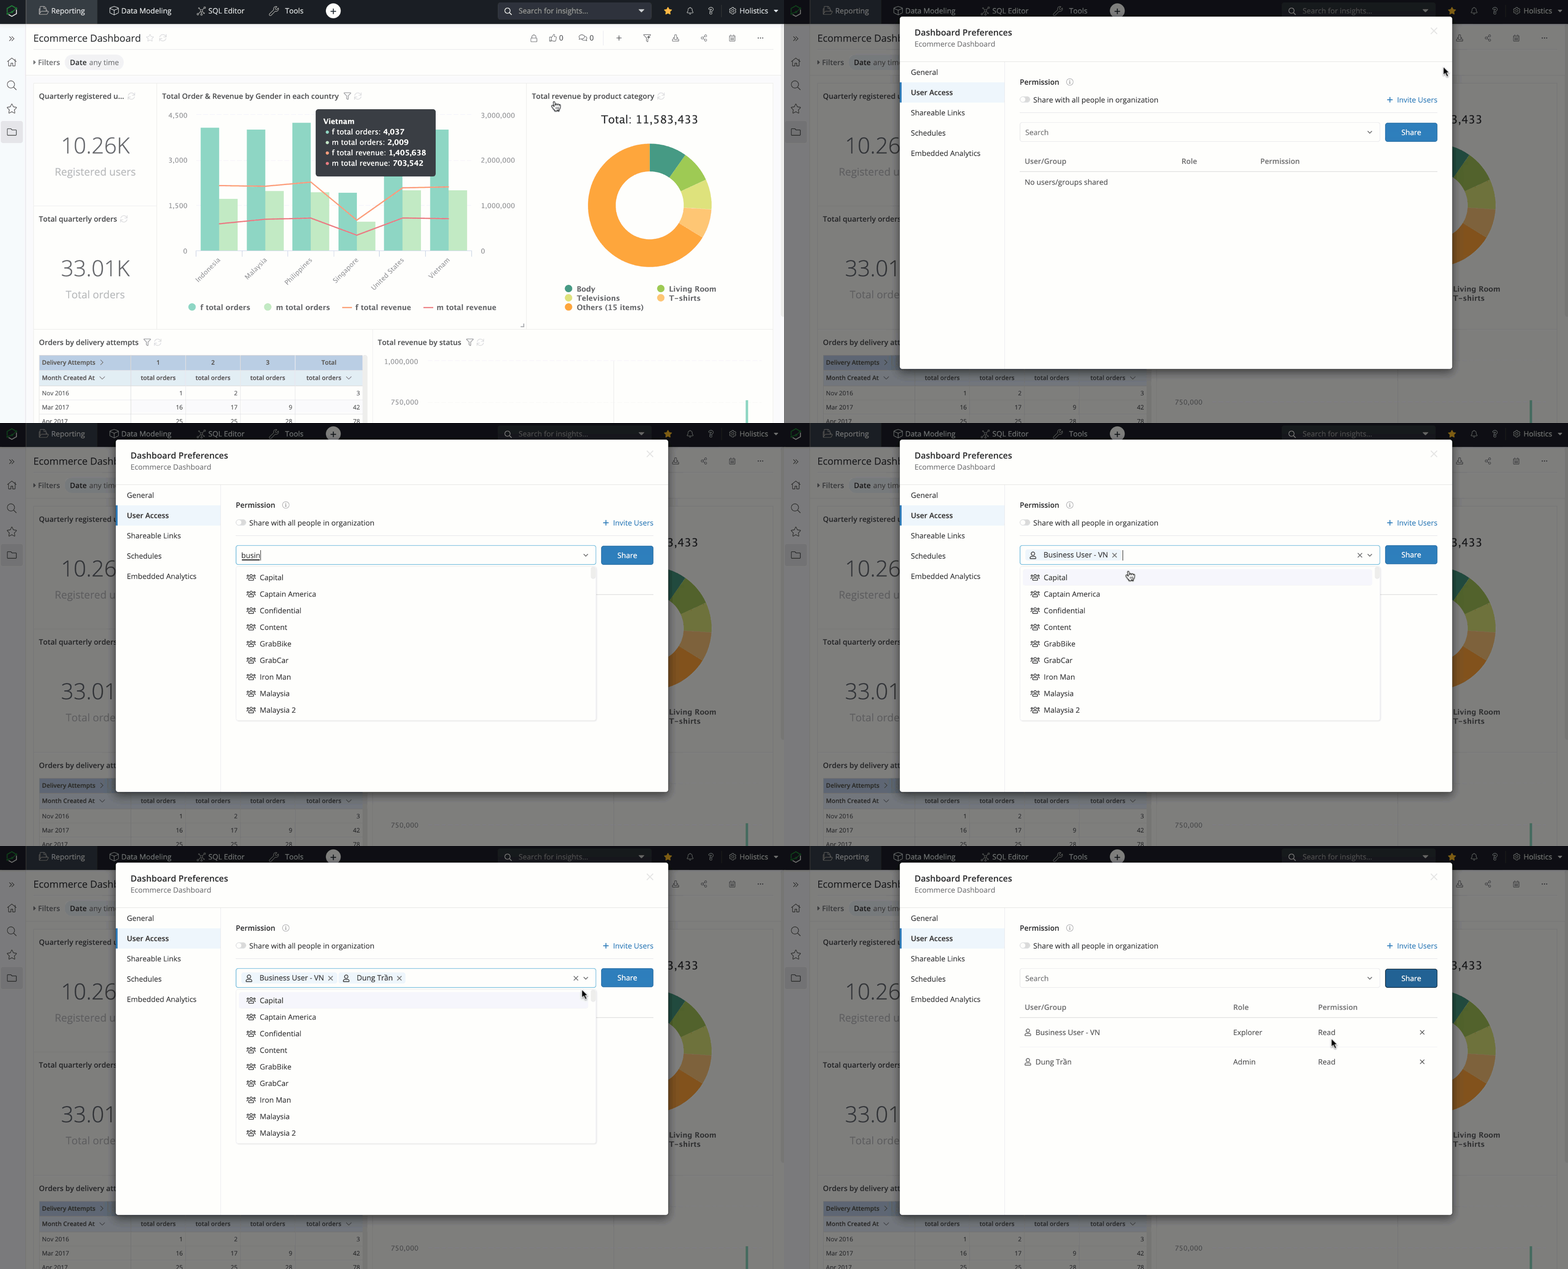
Resource Access Control

Control who gets access to specific reports and data sources.

Feature preview Learn more

Row-level Permission

Restrict the display data available to different users.

Feature preview Learn more

Column-level Permission

Allow sensitive data columns to only a certain group of users.

Feature preview Learn more

Security & Administration

Other settings for better administration

Monitoring & Debugging

Monitor and troubleshoot job issues.

Feature preview Learn more

Custom SSO

Allow users to access multiple applications through a single login.

Feature preview Learn more

Google Login

Log in to Holistics by Google Account.

Feature preview Learn more

Two-factor Login

Set up an extra layer of security for your analytics account.

Learn more

Client Reporting

Give your clients all the insights they need

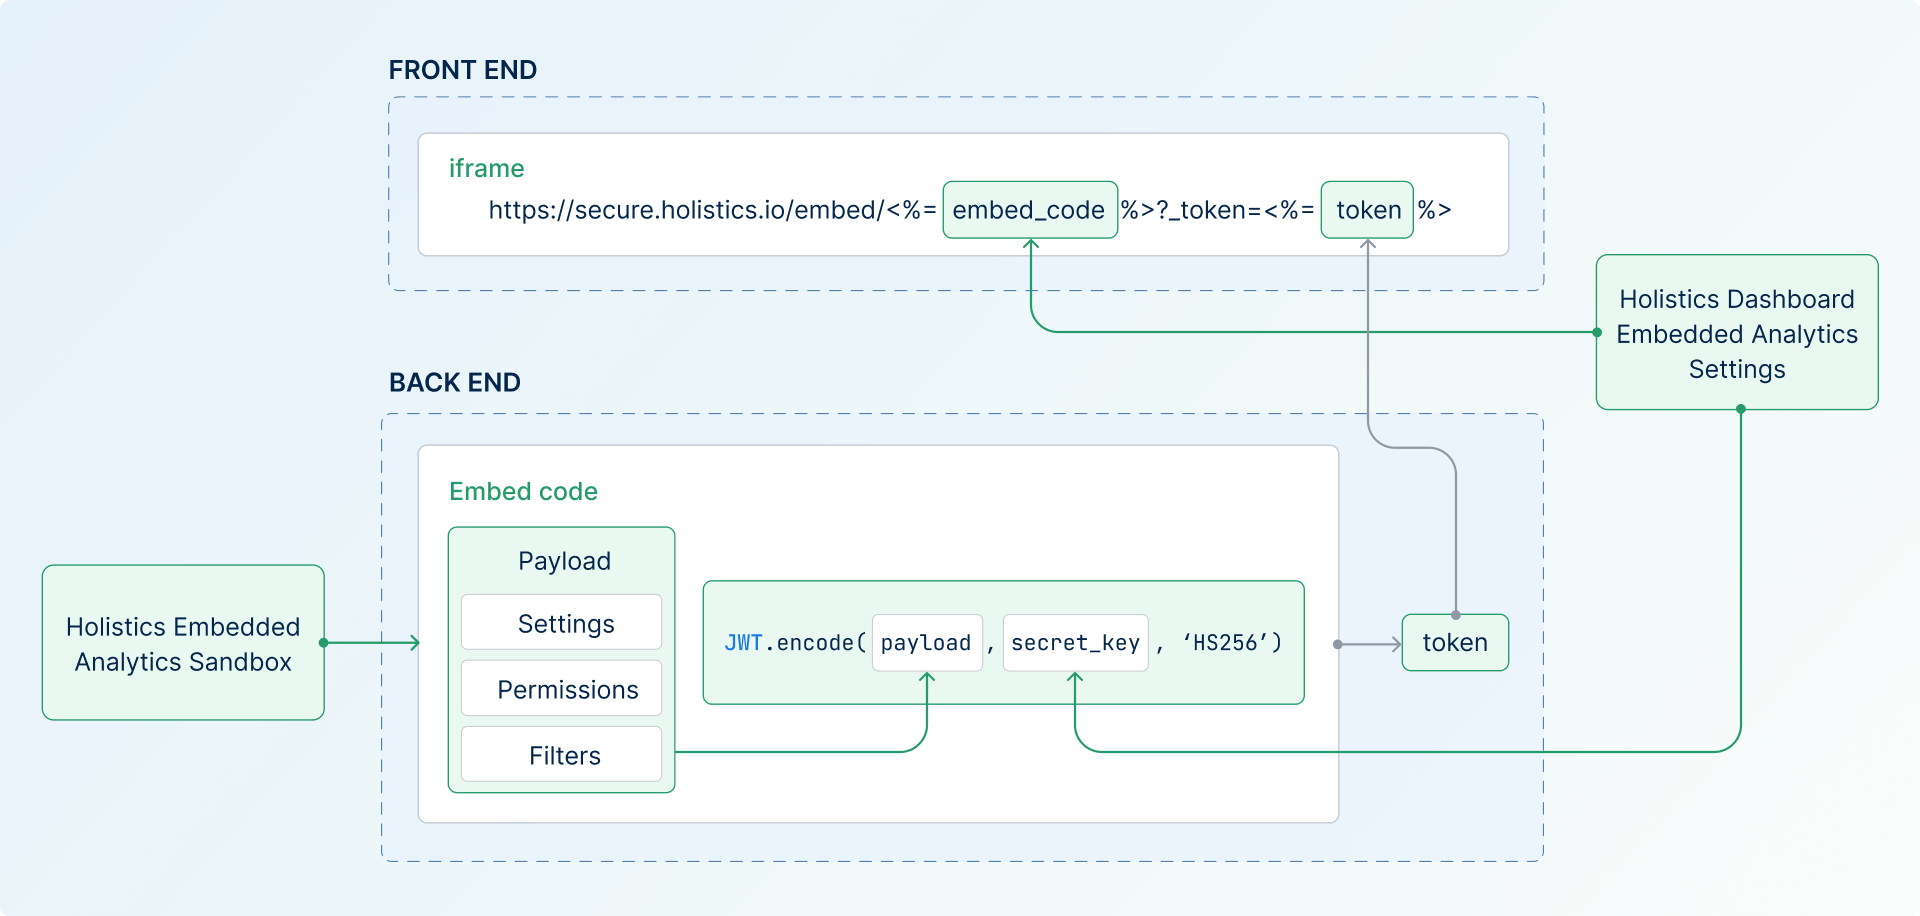
Embedded Analytics

Embed Holistics charts directly to your application.

Feature preview Learn more

White Label

Deliver reports and dashboards directly to stakeholders mailbox.

Row-level Permission

Restrict the display data available to different users.

Feature preview Learn more

Report Export

Export reports as tabular data (CSV, Excel) and PDF.

Feature preview Learn more

Shareable Links

Create and share secure dashboard links for seamless collaboration.

Learn more

Data Schedule

Automatically deliver reports to Email, Slack, Google Sheets, or SFTP.

Feature preview Learn more

Trusted by teams worldwide

Hear from data-driven teams who've transformed their workflows with Holistics.

Excellent BI tool for customers looking for a Looker alternative. Coming from a Looker background, I was very familiar with its concepts of analytics-as-code, and we have achieved everything we needed for reporting.

Alex H

Head of Data, Pinter

Alex H
The metrics dataset component is really critical for companies that don't have a real data team to build everything all the time. In the work I do, I recommend Holistics to people all the time.

Pedram Navid

Consultant/Founder, West Marine Data

Pedram Navid
The ability for everyone to explore: Massive win. The one feedback we've had over and over again from the whole company is “Man, how did you guys go through your process? Because you choose such a great tool.”

Guido Stark

Head of Data, Optimal Workshop

Guido Stark
Holistics is the next big BI Tool. It took me 2 hours to build the same report in Holistics that I took 16 hours to build in Tableau.

Stephen Motherwell

Chief of Product, Ordo

Stephen Motherwell
Holistics became an excellent choice to get us going in BI without the typical huge annual expense. We have built visualizations in Holistics that took it way beyond the 'out-of-the-box' tools.

Seth L

Chief of Product, Oxbridge Health

Seth L
As an analytics engineer, I was looking for a tool that allowed me a lot of data modeling flexibility and reusability. With Analytics as code, Holistics does a great job of being able to define data models and relationships using code.

Sterling P

Chief of Product, Mainspring Energy

Sterling P
They are great. They are continuously improving the platform and releasing new features, so we know that what we don't have right now will be at some point :)

Marta Garrido

Head of Data, MyRealFood

Marta Garrido
See all case studies