


Detailed Head-to-Head Comparisons
Explore detailed comparisons between specific tool pairs for more in-depth analysis.
Over the years, we've received over hundreds of RFPs (Requests for Proposal) from a wide range of prospects and customers, from small businesses to international Fortune 500 companies. This has given us valuable insight into how data teams evaluate BI tools, the key questions they ask, and the capabilities they prioritize.
We’ve distilled those insights into a BI comparison matrix and used it to compare today’s leading BI platforms side by side.
Because every team’s priorities look a little different, we’ve also shared a Google Sheet version you can copy, adapt, and use directly with any vendors you’re assessing.
Our approach:
We understand we might come across as biased, since we're also a vendor selling BI solution. Rather than claiming neutrality, we'll let the content below speak for itself.
Found an inaccuracy or want your tool added? Use this form.
| Dimension | | |  Power BI Power BI | |  Sisense Sisense |  Domo Domo |  Omni Omni |  Thoughtspot Thoughtspot |
|---|---|---|---|---|---|---|---|---|
| Demo Playground Availability and quality of demo playground for testing the tool before purchase. | ||||||||
| | ❌ No free trial. Sales-led demo model for enterprise clients. source | |||||||
| Pricing Structure Pricing model and cost structure of the BI tool. | ||||||||
| | User & Capacity Based Free account, user-based licenses, and capacity-based pricing for enterprise. source | Platform & User-Based Platform pricing for core instance plus user-based pricing for Developer, Standard, and Viewer roles. source | User-Based Custom Pricing Customized solutions based on users, data size, hosting type, and usage intensity. source | Consumption-Based Credit System Pay for what you use with credit system and base user fee starting at $750/year per user. source | ❌ No information available. | User-based or Usage-based ThoughtSpot offers subscription options starting at $25 per user per month, or a usage-based model at $0.10 per query. source | ||
| | $9,000+/year Entry plan starts at $800/month. Enterprise plans available for larger teams. source | Contact Sales No pricing estimate available. Contact sales for a custom quote. source | $9,000+/year Power BI pricing starts at $14 per user per month for the Pro plan (annual billing) and $24 per user per month for the Premium plan. source | $35,000-150,000/year Base cost starts at $35,000-60,000/year. Average mid-sized company cost is $150,000/year. source | $40,600-327,000/year Essential $40,600-60,000/year, Advanced $69,600-138,000/year, Pro $109,000-327,000/year. source | $50,000-200,000/year Small businesses $30,000/year, enterprise-level organizations can exceed $100,000 annually. source | ❌ No information available. | $140,000/year On average, organizations report paying around $140,000 annually for ThoughtSpot licenses and usage, according to Vendr. source |
| Visualizations Chart and visualization capabilities of the tool. | ||||||||
| |  Hundreds of native chart types including bar, pie, line, area, matrix, and advanced visuals. source | Drag-and-drop canvas with diverse visualization options including tables, charts, and maps. source | Out-of-the-Box Charts Library of out-of-the-box charts, maps, and widgets for quick dashboard building. source | 150+ Native Chart Types Over 150 native chart types including pie, line, bar charts, maps, scatter plots, and Gantt charts. source |  Broad set of native visualizations including AI summary, area, bar, line, KPI, maps, and tables. source |  Multiple measures, faceted groupings, layers, and manual disaggregation capabilities. source | ||
| |  Custom visuals from AppSource marketplace and self-developed using PBIViz tools. source | Custom plug-ins for visualizations through Looker Marketplace with community and partner options. source | Extensive Customization Customize visuals and dashboards with no-code design approach for personalized layouts and themes. source |  Custom visuals via Markdown including iFramed external content like YouTube, Maps, and Twitter. source |  Custom charts are available via Vitara Charts. source | |||
| | Custom Theming Comprehensive theming with custom CSS for brand alignment and styling. source | Theming for Branding Custom styling and branding with white-labeling for client-ready embeds. source |  Custom styling through JSON themes with color palettes, typography, and branding. source | Embedded Interface Branding Customize Looker interface to match branding for external analytics and custom applications. source | Branded Experiences Interactive visualizations matching product look and feel with complete white-labeling in Pro plan. source | Personalized Branding Extensive custom styling and branding with user-friendly no-code design interface. source |  On-brand embedded analytics with basic theming controls, full CSS customization not detailed. source | ❌ No global theming or white-label styling documented for native charts. |
| |  Smart Narratives, embedded text summaries, and Copilot for conversational insights. source | Narrative Dashboarding Craft compelling data stories with automated narratives and insightful text summaries. source | AI-Powered Narratives Sisense Intelligence features assistant and narrative generation for natural-language exploration. source | AI-Enhanced Data Stories Conversational AI (AI Chat) for natural language questions and automated alerts for key data changes. source | AI Highlights Auto-surfaces insights on Liveboards for narrative exploration and data storytelling. source | |||
| Ease of Use & Self-Service How user-friendly and self-service oriented the tool is for non-technical users. | ||||||||
| | Interactive Dashboard Exploration Drilldowns, filters, and click-through exploration for data analysis. source | Interactive Drilldowns Drilldowns, filters, and click-through exploration for deeper data insights. source | Drill-to-Row-Level Detail Expand filters and drill down to row-level detail for comprehensive data comprehension. source | Interactive Dashboards Interactive no-code dashboards for exploration with filtering capabilities. source | Interactive Data Exploration Interactive dashboards with filters and customizable views for intuitive data analysis. source | Drill-down, filtering, and ad-hoc exploration directly from Liveboard interface. source | ||
| |  Ask Data feature for natural language queries and immediate visualizations. source | Q&A Visual AI-assisted natural language queries using Q&A visual for instant answers. source | Marketplace Content Discovery Discover pre-built content, blocks, and custom plug-ins through Looker Marketplace. source | Natural-Language Exploration Sisense Intelligence features assistant and narratives for natural-language data discovery. source | AI-Driven Data Exploration AI Chat for natural language questions and instant actionable insights through conversational AI. source | Content Discovery Find & manage content with dashboard search capabilities for content discovery. source | Analyst Studio Hub Central hub for organizing reports, Liveboards, and data objects discovery. source | |
| | Calculated Fields Extensive built-in calculation capabilities for common business metrics and KPIs. source | AI-assisted DAX calculations with point-and-click analytics for common operations. source | Table Calculations & LookML Standard calculations via Table Calculations. Complex analyses require LookML modeling. source | Quick Functions Natural language support for contribution, pastYear, and difference calculations via AI Assistant. source |  Self-serve calculated fields in Analyzer without complex dataflows or advanced Beast Modes. source |  AI-powered table calculations reducing formula friction with smart assistance. source |  Robust set of built-in aggregation functions for custom calculations. source | |
| |  User-friendly interface with drag-and-drop functionality and guided report creation. source |  User-friendly report canvas with drag-and-drop builders and guided tours. source | Drag-and-Drop Canvas Intuitive drag-and-drop canvas for creating visually appealing dashboards. source | Visual Report Builder Build dashboards with out-of-the-box charts, maps and widgets, using a visual report builder. source |  Worksheets for data prep and intuitive Analyzer for report building and visualization. source |  Workbook interface for exploration and building with field picker and model promotions. source |  Layered visuals, mark selection, and drag-and-drop style report building. source | |
| |  Natural language queries with AI assistant for data exploration and insights. source | 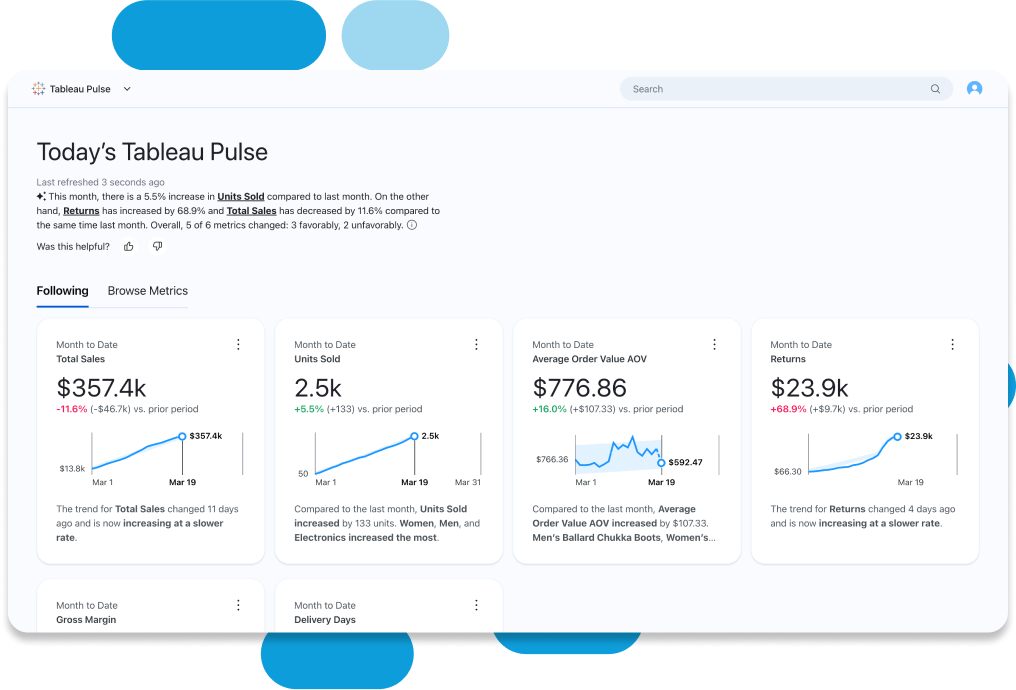 AI-powered features including natural language queries and automated insights. source | AI insights, auto-charting, natural language queries, and Key Influencer visual. source | Gemini AI Assistant AI assistant for visualization creation, formula building, data modeling, and report generation. source | 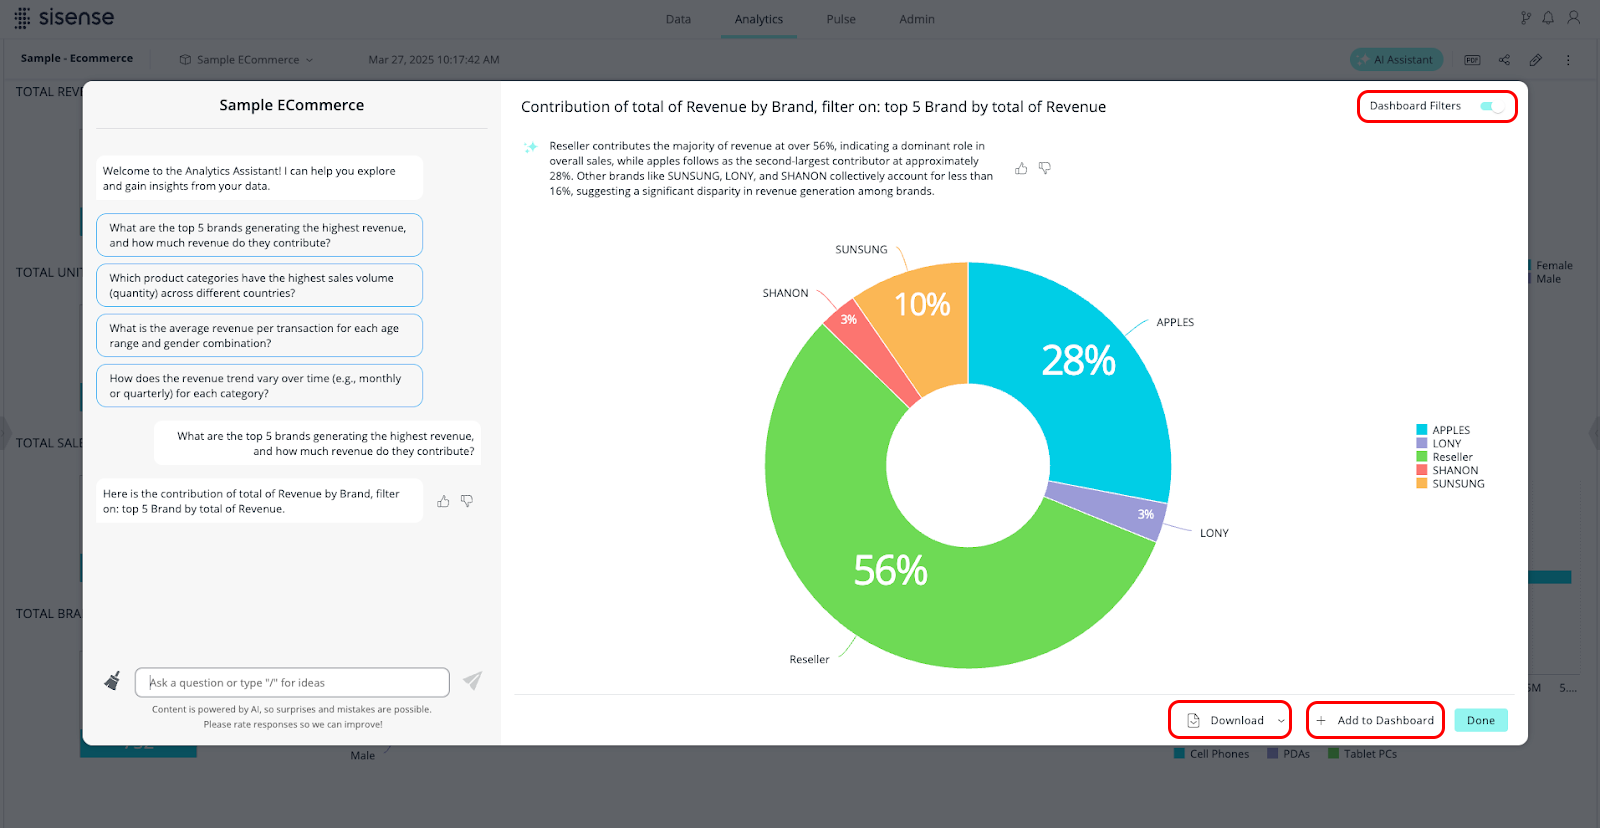 Natural language queries with limitations: no calculated fields, no query history retention. source | AI-Driven Data Exploration AI Chat for natural language questions and instant actionable insights through natural language. source | ||
| Data Delivery How data and reports are delivered to end users. | ||||||||
| | Comprehensive Alerts Advanced alerting system with customizable thresholds and multiple notification channels. source | Custom Alerts Custom alerts and scheduled subscriptions for timely information delivery. source | Data-Driven Alerts Create subscriptions and data-driven alerts based on insights for individual users and teams. source |  Custom notification messages with rebranded emails and custom SMTP server support. source | Automated Alerts Automated alerts for key data changes to keep users updated on important information. source | Schedule & Alert Native scheduling and alerting capabilities, specific channels not detailed. source | Scheduled Jobs Schedule Liveboard jobs for automated delivery and subscription management. source | |
| | Secure Sharing Internal RBAC sharing and external distribution with multiple export formats. source | Enterprise Sharing Enterprise-grade sharing with granular permissions and secure distribution options. source |  Secure sharing via Teams, PowerPoint, Excel with PDF, CSV, Excel export options. source | Content Sharing Guide Comprehensive documentation and guidance for effective content sharing within the platform. source | ❌ No explicit sharing or distribution features mentioned in documentation. source | ❌ No explicit sharing or distribution features mentioned in documentation. source | Governed Sharing Document-level permissions and content sharing with governance controls. source | |
| Embedded Analytics Capabilities for embedding analytics into other applications. | ||||||||
| | Iframe + API Basic dashboard embedding and self-service embedding for report creation. source |  Supports iframe embedding, REST API, and JavaScript API for integration. source | Azure PaaS Power BI Embedded as Azure PaaS for embedding interactive reports into applications. source | API-Driven Embedded Powerful embedded capabilities with robust API coverage for extensive data experiences. source | iFrames, APIs & SDKs iFrame embedding across all plans with REST API and Compose SDK for React, Angular, Vue. source | Embedded Analytics Embed analytics into any application, portal, or website to extend data reach and deliver insights. source | 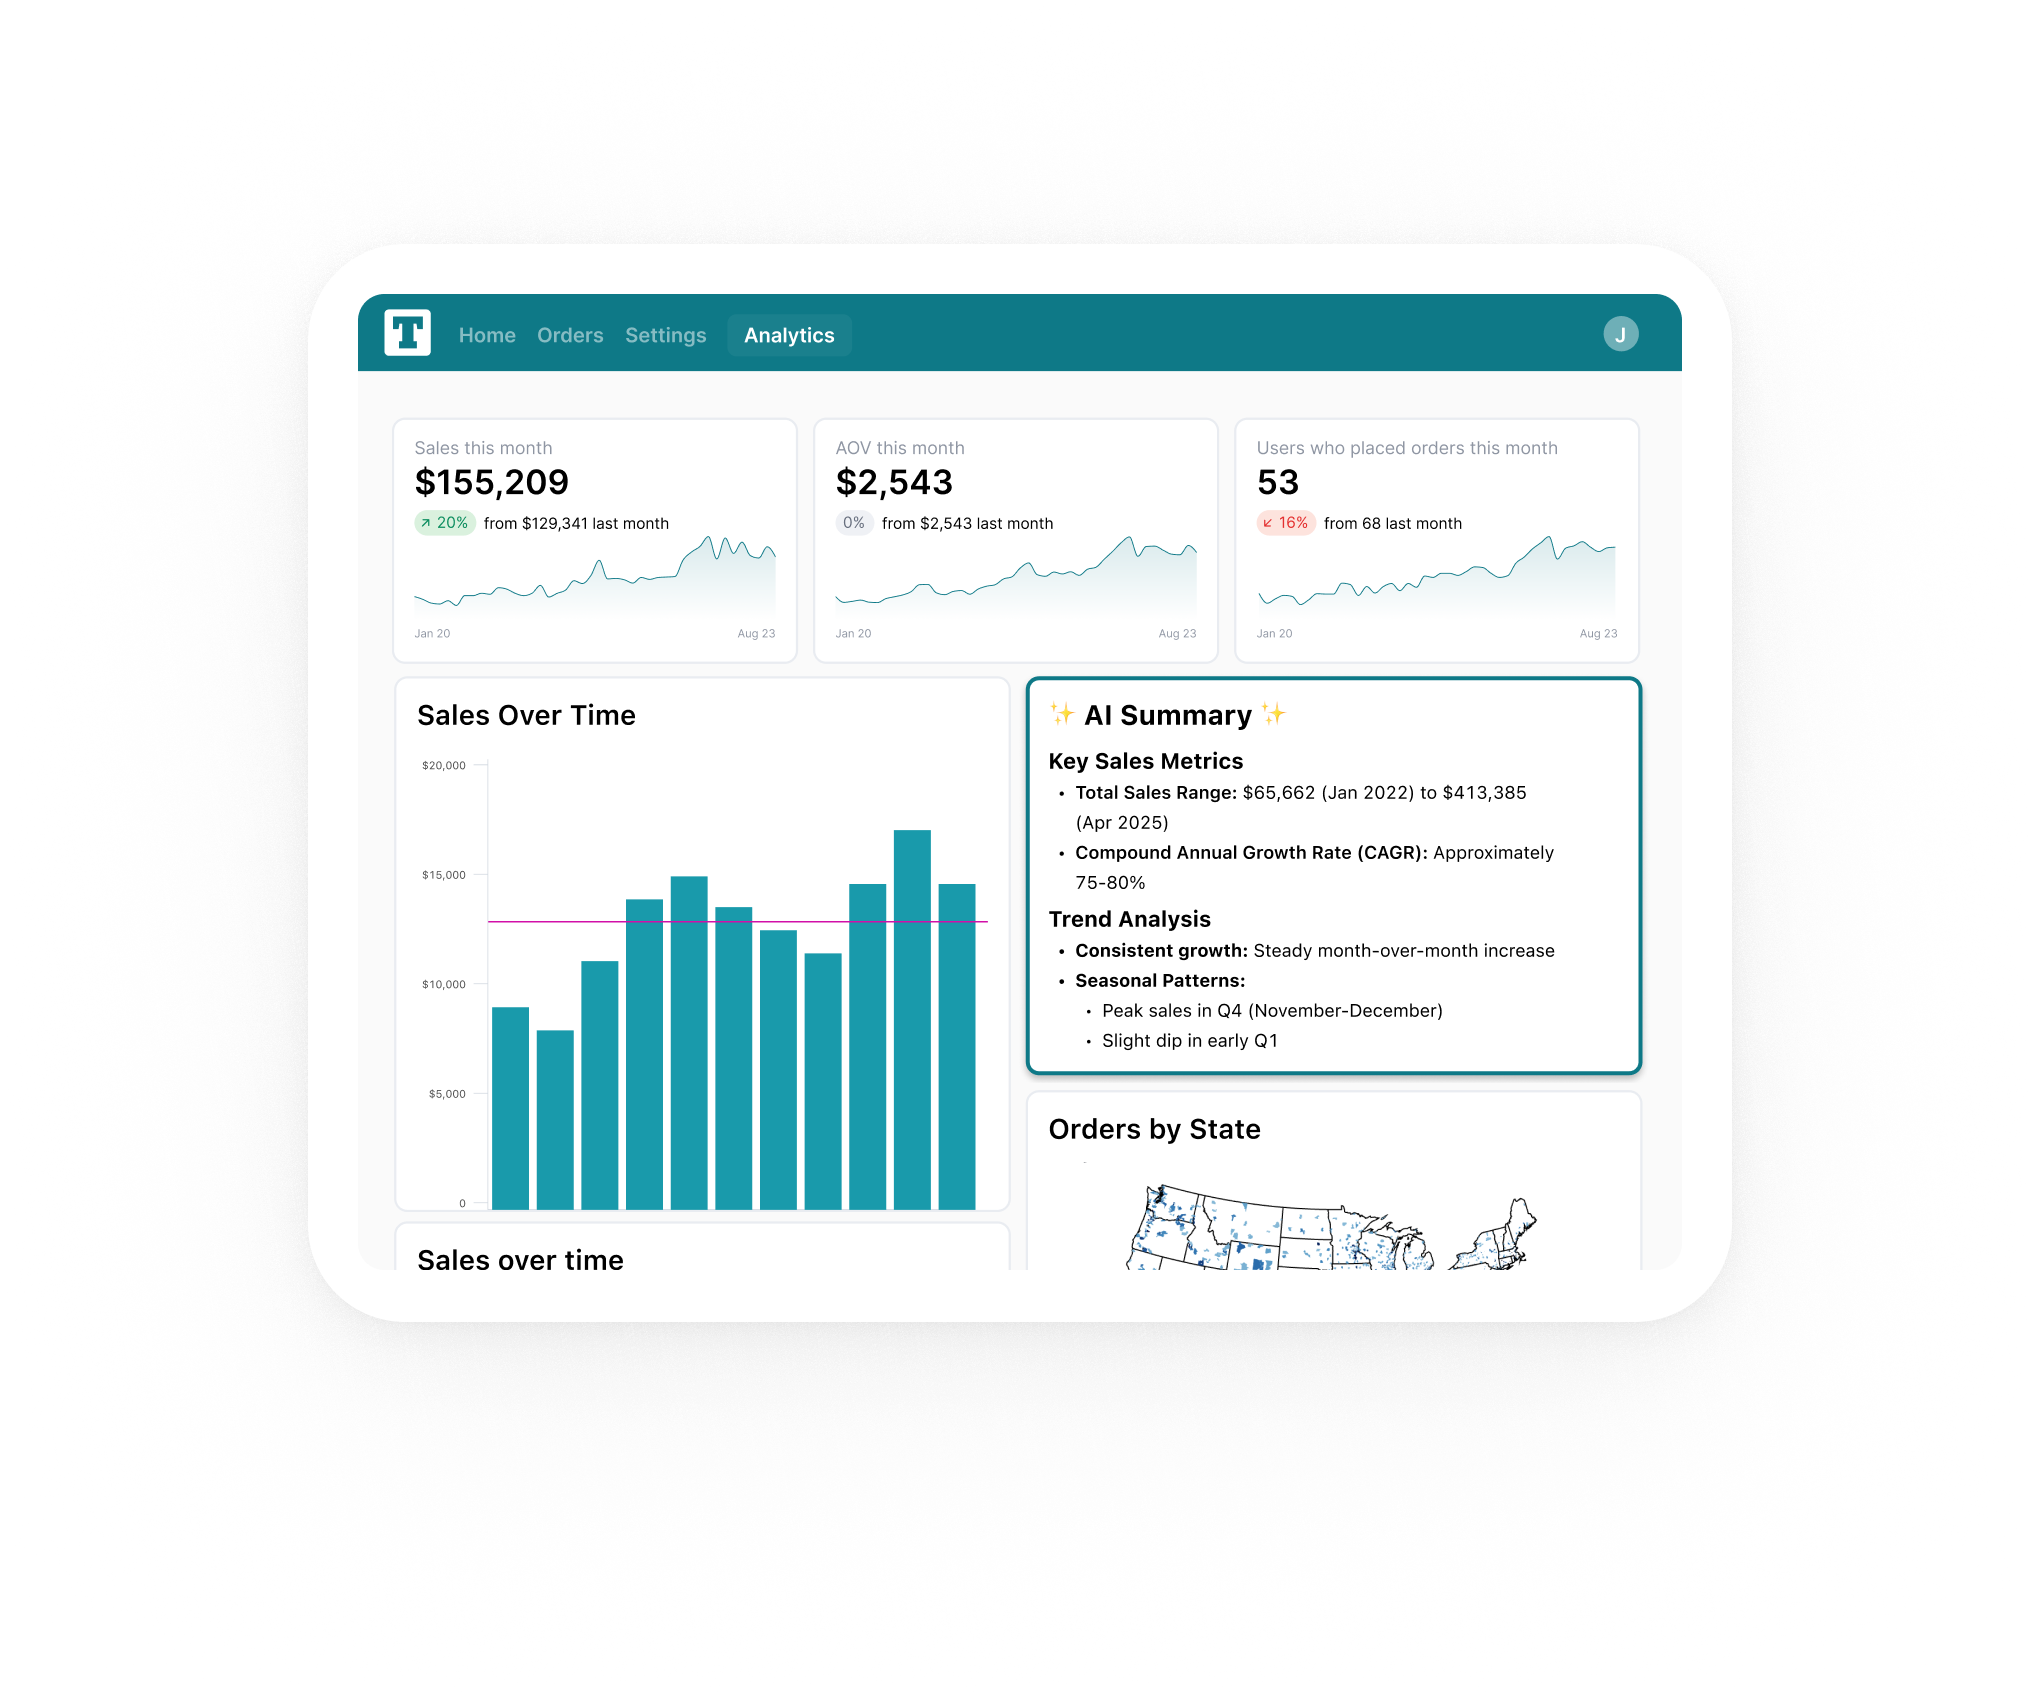 Dedicated embed capabilities for customer-facing reports with on-brand integration. source | Visual Embed SDK Embed Liveboards and visualizations via SDK with event handling capabilities. source |
| | Branding Options Customizable branding and theming for embedded analytics with CSS customization. source | Custom Styling Custom styling and branding of dashboards using themes and color palettes. source | Embedded Interface Branding Customize Looker interface to match branding for external analytics and custom applications. source | Customizable White-Labeling Complete white-labeling in Pro plan with limited options in lower tiers for OEM scenarios. source | Custom Branding White-labeling and custom theming for embedded content to reflect brand's look and feel. source | On-brand embedded analytics with AI assistant branding controls, full theming API not detailed. source | Customization framework Teams can whitelabel and customize ThoughtSpot embedded using style customization framework and custom CSS. source | |
| | Self-Service Embedding Embedded users can create and edit their own reports and dashboards. source | Limited Self-Service Basic self-service capabilities for embedded users with appropriate licensing. source | ❌ No direct embedded report builder for end users in embedded context. source | ❌ No embedded report builder for end users in embedded context. source | Intuitive Dashboard Designer Dashboard Designer feature with Basic in Essential plan and Advanced in higher tiers. source | Self-Serve Analytics Simple drag-and-drop tools for teams to create visualizations within embedded content. source | Customer Self-Service Customers can build customizable dashboards and natural language queries within embedded product. source | ❌ No information available. |
| Reliability & Performance System reliability, performance optimization, and monitoring capabilities. | ||||||||
| | Advanced Optimization Comprehensive query optimization with caching, incremental refresh, and performance tuning. source | Import Mode Import mode, pre-aggregation, and summary tables for performance optimization. source | In-Database Architecture In-database architecture optimizing performance by directly querying cloud databases in real time. source | Proprietary Elasticube System Proprietary Elasticube system for data storage and processing with scalable analytics and low latency. source | ❌ No specific information on query optimization, caching, pushdown, or pre-aggregation mentioned. source | Caching Controls Admin and user caching controls with visualization performance improvements. source | ❌ Not available. | |
| | Enterprise Monitoring Enterprise-grade monitoring with comprehensive performance insights and alerting. source | ❌ No explicit built-in monitoring, freshness indicators, or error alerts. source | System Activity Explores System Activity Explores provide insights into user interactions, content engagement, and query performance. source | .png) Web Access Token usage statistics and monitoring with REST API support. source | Automated Alerts Automated alerts for key data changes, but no explicit freshness indicators or error alerts mentioned. source | Admin Analytics In-app workbook analytics for administrators to monitor usage and system efficiency. source | ❌ No information available. | |
| Semantic Modeling Data modeling and semantic layer capabilities. | ||||||||
| | Tableau data model provides semantic layer capabilities with calculated fields and parameters. source |  Semantic modeling with OneLake data hub for single source of truth. source |  Universal semantic modeling layer as single source of truth with LookML modeling language. source | Data Modeling & Unified Data Data modeling capabilities with intuitive workflows for unifying data across sources into actionable visualizations. source | Magic ETL Magic ETL and Worksheets provide GUI-based transformations and analyst-level data shaping. source |  Workbook queries become reusable model views with parameters and governed topic management. source | Spotter Model Readiness Column naming, synonyms, indexing guidance for semantic model context. source | |
| | Limited Version Control Basic version control through Tableau Server/Online with limited branching capabilities. source | Git Integration In Power BI Desktop, enable the preview feature to save reports as .PBIP projects and check into Git, while Microsoft Fabric provides native Git integration. source |  Git-based version control for data models with proprietary dashboard versioning capabilities. source |  Git integration for developers with version control capabilities and marketplace add-ons. source | ❌ No information about Git version control for managing semantic models or BI artifacts mentioned. |  Branch mode for safe changes with Git integration for versioned development workflows. source | Git Integration Data teams can govern Liveboards, Answers and TML changes via Git Integration. source | |
| | Manual Sync Manual metadata management with limited automated synchronization capabilities. source | ❌ No explicit automated metadata sync from dbt or data warehouses. source | ❌ No explicit automated metadata syncing from dbt or other warehouses into semantic layer. source | ❌ No explicit automated metadata synchronization from dbt or data warehouses mentioned. source | ❌ No explicit automated metadata synchronization from dbt or data warehouses mentioned. |  Early implementation of dbt Semantic Layer integration, marked as work-in-progress. source | ❌ No information available. | |
| | Limited Code Support Limited code-based management with some API capabilities for automation. source | ❌ No explicit analytics-as-code for dashboards or models. source | LookML Analytics-as-Code LookML modeling language enables code-based definition of dimensions, measures, and business logic. source | Pro-Code to No-Code Pro-code, low-code, and no-code capabilities for building dashboards with JavaScript and Compose SDK. source | ❌ No information about defining dashboards or models in YAML/DSL formats or CI/CD workflows mentioned. | ❌ No information available. | ||
| Security and Governance Security features and governance capabilities. | ||||||||
| | Enterprise Security Comprehensive RBAC, SSO, and group-based access control for enterprise environments. source |  Microsoft security standards with data governance and sensitivity labeling. source | Unified User Management Unified user management with SSO via Google Cloud IAM and role-based access control. source | Trust & Security Enterprise-grade security in Pro plan with marketplace add-ons for data governance and SSO. source | Enterprise-Level Security Enterprise-level security, compliance, and governance with SSO and encryption capabilities. source | Role-Based Permissions Multiple permission roles including Restricted Querier, Modeler, Connection Admin, and Organization Admin. source | SSO Authentication Link sharing requires authentication via sign-in or SAML integration. source | |
| |  Built-in compliance features with audit logs and monitoring for regulatory requirements. source | ❌ No explicit audit compliance features mentioned in documentation. source | System Activity Explores System Activity Explores serve as audit logs for monitoring platform usage and system efficiency. source | ❌ No explicit audit compliance features mentioned in documentation. source | Multi-Framework Compliance ISO 27001/27018, SOC 1/2, HIPAA, HITRUST certifications with responsible disclosure program. source | ❌ No audit logs or compliance documentation available in provided materials. | ❌ No information available. | |
| | Advanced Security Advanced data masking, encryption, and security features for enterprise data protection. source | ❌ No explicit data masking or encryption features mentioned. source | ❌ No explicit data masking or encryption features mentioned in documentation. source | ❌ No explicit data masking or encryption features mentioned in documentation. source | BYOK Encryption Bring Your Own Key encryption with customer-managed key rotation and data access revocation. source | ❌ No data masking or encryption features documented in provided materials. | ❌ No information available. | |
| | Enterprise Monitoring Enterprise-grade security monitoring and logging with comprehensive visibility. source | ❌ No explicit monitoring or logging capabilities mentioned. source | System Activity Explores System Activity Explores provide insights into user interactions, content engagement, and query performance. source | ❌ No explicit monitoring or logging capabilities mentioned in documentation. source | ❌ No explicit monitoring or logging capabilities mentioned in documentation. source | AI Data Security Dedicated AI data security configuration, general monitoring/logging not detailed. source | ❌ No information available. |
Explore detailed comparisons between specific tool pairs for more in-depth analysis.