Lean Analytics Part 1: An Introduction to Analytical Thinking
In the first part of our comprehensive summary of Lean Analytics, we examine the basics of analytical thinking, explore six startup business models, and examine the metrics that matter the most to each.

Lean Analytics is a 2013 book by Alistair Croll and Benjamin Yoskovitz, designed and written for the lean method of startup development. It consists of four parts:
- An introduction to analytical thinking.
- An overview of key metrics and benchmarks to pay attention to for six different types of business models.
- An explanation of the different kinds of data one will encounter through the lifecycle of a startup.
- Methods to introduce data-driven decision-making in an organisation — which is split between methods for B2B companies, B2C companies, and ‘intrapreneurs’ — a fancy term the Lean Startup people use to describe those who are starting something new inside an existing large company.
In this post, we’ll summarise Part 1 and 2, which covers a concise overview of thinking analytically in the pursuit of building a business. We'll also summarise the key metrics and benchmarks to pay attention to for six different types of business models, though this will be made available in the form of a downloadable PDF document. In the next post, we’ll summarise Parts 3 and 4.
This summary will be spread over two posts. It is intended to be comprehensive, which means that you can read this series as a replacement to the book.
An Introduction to Analytical Thinking
What is the purpose of analytics? The purpose, Croll and Yoskovitz assert, is to protect you from lying to yourself. Lean Analytics is written for the entrepreneur in mind, and entrepreneurs are notoriously famous for their optimism.
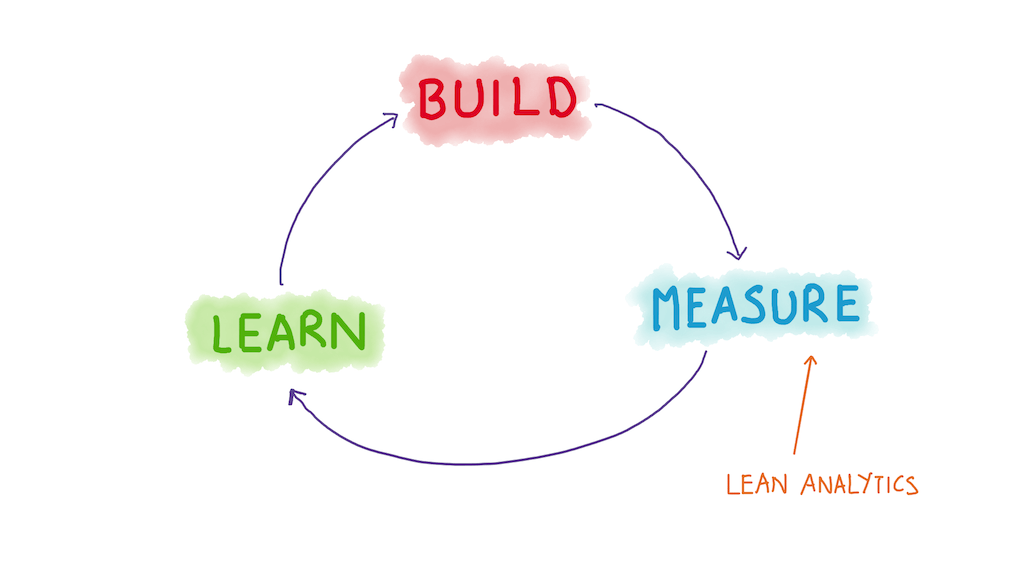
It’s helpful to remember that Lean Analytics lives within the context of the Lean Startup movement, originally popularised by Eric Ries’s 2011 book The Lean Startup. The core idea of that book is that startups are better served if they execute all their operations using something Ries calls a ‘Build - Measure - Learn’ cycle — that is, build something small, give it to users, measure it, and then learn from those measurements to build the next small thing. Ries argues that you can apply this methodology to every activity over the lifetime of a startup: from product idea to early sales processes, from small firm business problems to large corporate departments pursuing challenging strategic initiatives across a bunch of different bets.
Lean Analytics covers the ‘Measure’ step of this ‘Build - Measure - Learn’ cycle.

What makes for a good metric?
The authors assert that a good metric consists of four properties:
- A good metric is comparative — that is, you are able to compare metrics across different dimensions. For instance, being able to compare numbers to another time period, a different group of users, or to metrics from different competitors is more useful than a number standing on its own.
- A good metric is understandable — if it’s difficult to remember and difficult to discuss, it’s nearly impossible to turn that insight into a change in your company’s culture.
- A good metric is a ratio, or a rate — ratios are easier to act on. As we’ll see later, some of the most actionable metrics are ratios of some measure against another measure. In addition, Croll and Yoskovitz point out that ratios are good for measuring factors that are somehow opposed to each other. This is helpful when you want to pair indicators.
- And finally, a good metric changes the way you behave. This is the ultimate test for whether a metric is actionable. If it doesn’t change the way you behave — well, why measure it?
In practice, a metric that changes the way you behave does it through one of two ways:
- It is an ‘accounting’ metric, like daily sales revenue, that helps you make better predictions of the future.
- It is an ‘experimental’ metric, like the results of an A/B test, that helps you decide for one version of your product versus another.
I’ve written elsewhere about the principle of pairing indicators (that is, you want to pair an metric with the opposite of that metric) — but Lean Analytics merely points out that many metrics come in pairs, like conversion rate (% of people who buy something) and time-to-purchase (how long before they buy). They urge founders to be on the lookout for ‘natural’ pair of indicators in their businesses.
The authors point out that you need to keep five things in mind when picking metrics to measure:
- Qualitative vs quantitative metrics. There’s an old quote about ‘not everything that counts can be counted’, and it applies to your metrics as well. Some metrics can only be captured qualitatively. Just because it can’t be measured, doesn’t mean that it isn’t a metric.
- Vanity vs actionable metrics. Vanity metrics make you feel good. Actionable metrics change your behaviour.
- Exploratory vs reporting metrics. Exploratory metrics are speculative; you’re trying to discover unknown insights by looking at the data you’ve collected. Reported metrics keep you abreast of day-to-day operations.
- Leading vs lagging metrics. Leading metrics predict the future, lagging metrics explain the past. Leading metrics are more difficult to find, but better, because they allow you to act before it is too late.
- Correlated vs causal metrics. If two metrics change together, they’re correlated. If one metric causes another metric to change, they’re causal. It’s really difficult to prove causality, but incredibly powerful: for instance, if you discover that tweaking some parameter of your product leads to higher revenue, you basically have the power to increase your revenue by doing more of it.
A Framework for Analytics
After explaining how to think about metrics, Croll and Yoskovitz then introduce an organising framework for startup analytics.
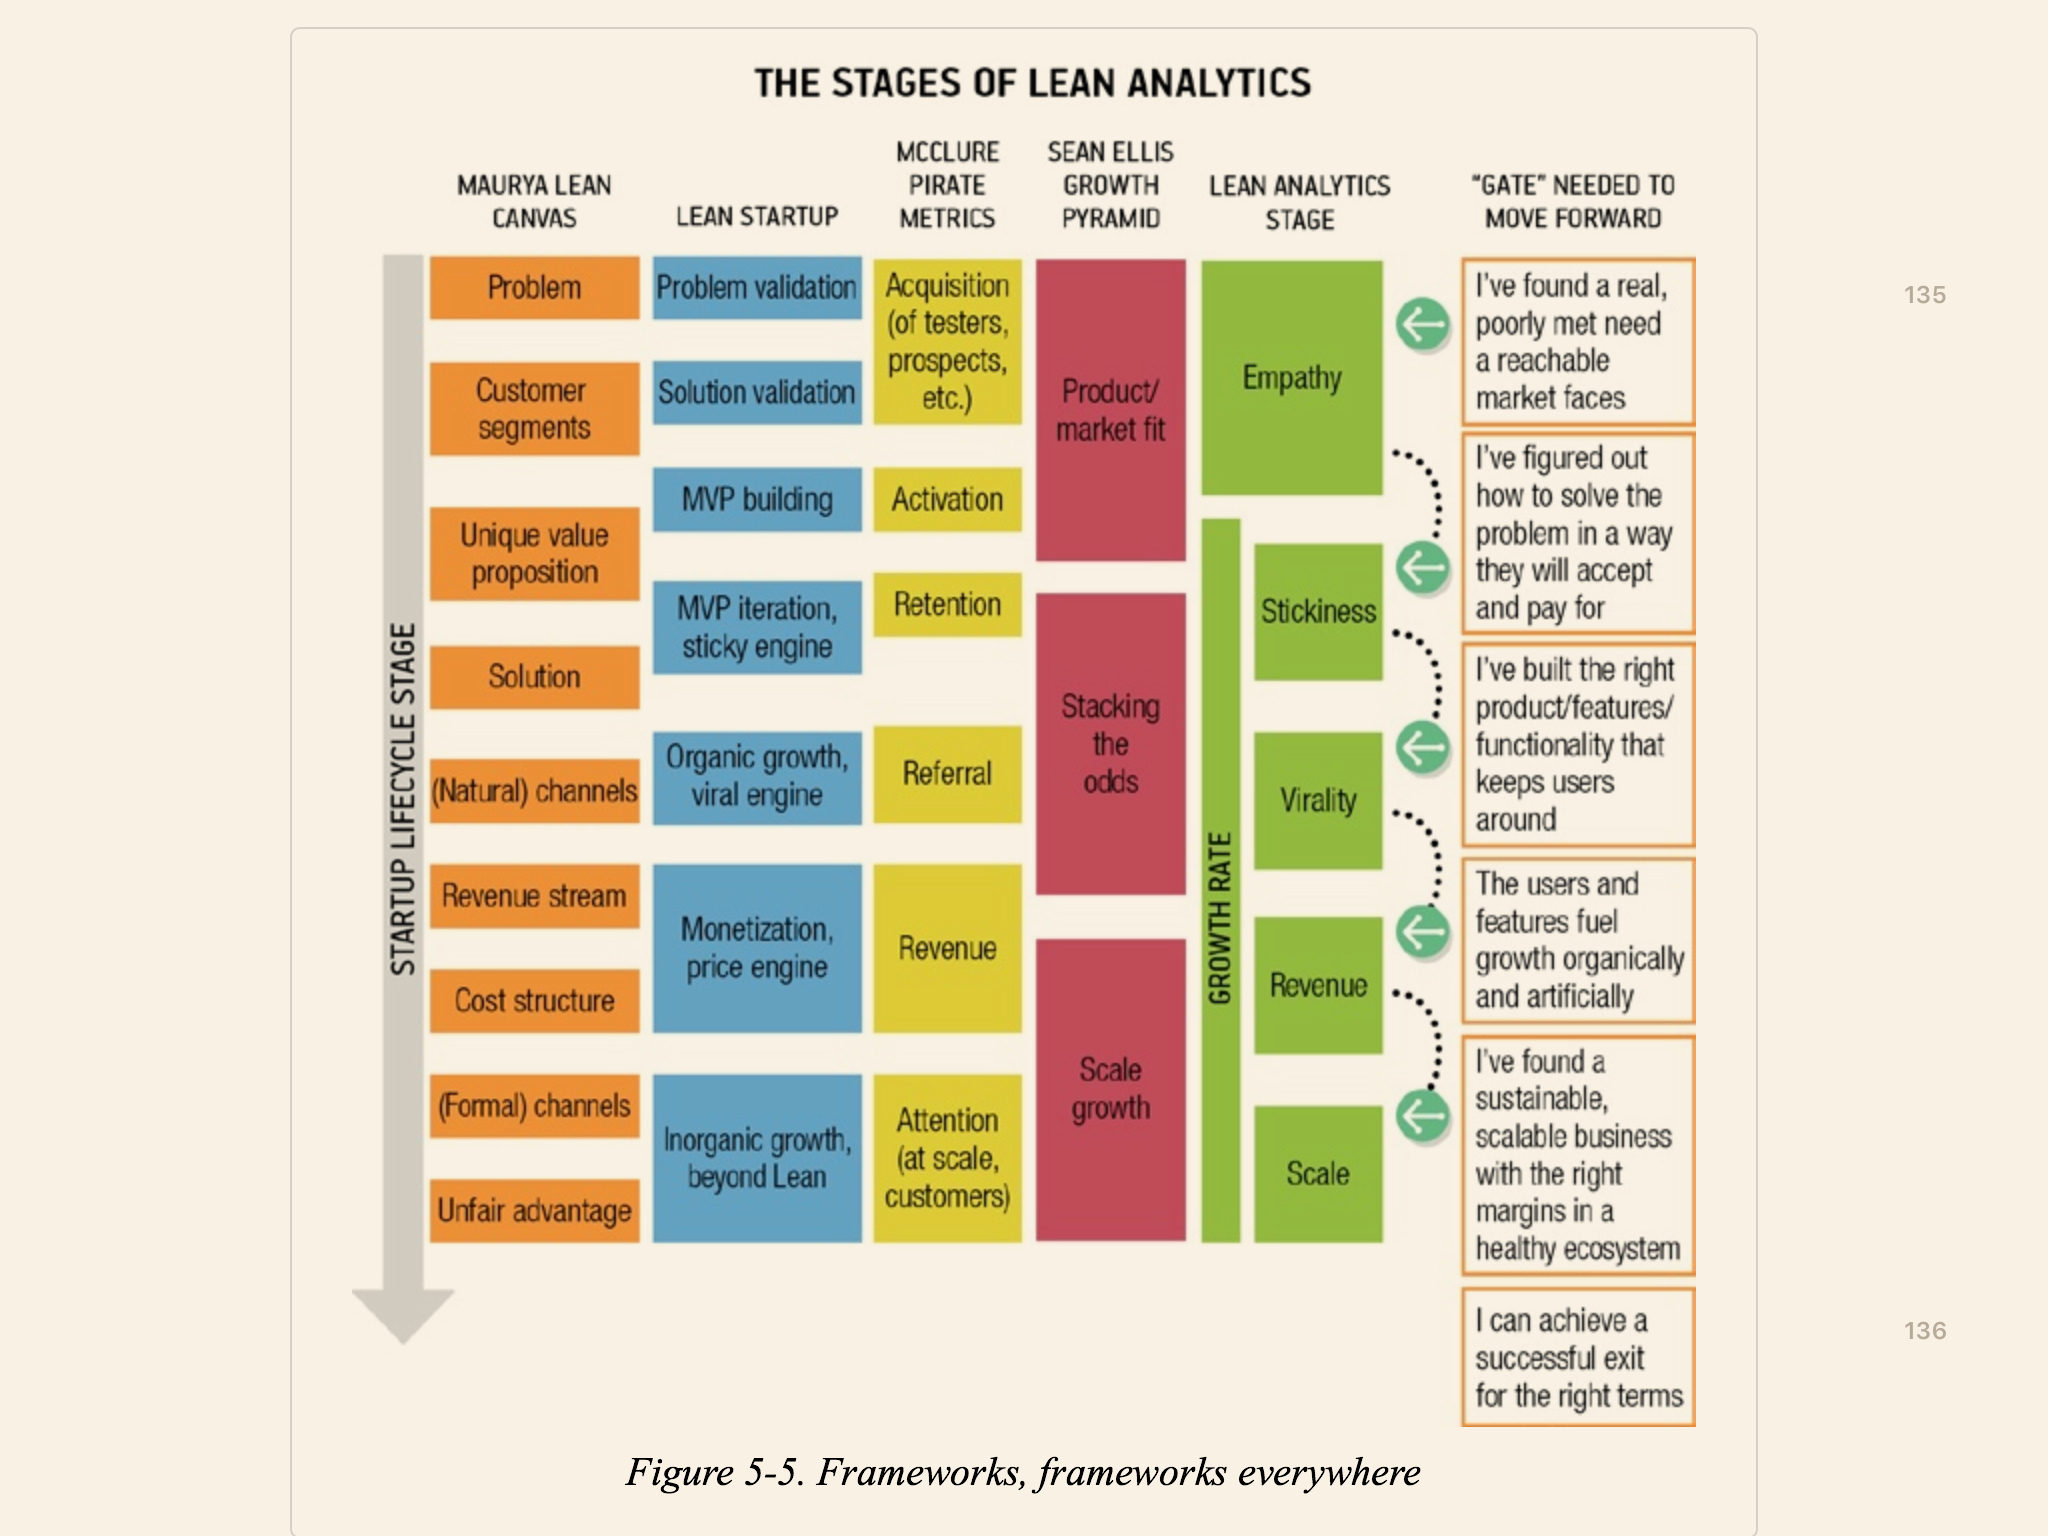
Why do you need an organising framework for startup analytics? Well, one reason is that different stages of startup growth will see you focusing on different things. Croll and Yoskovitz explain that many good frameworks already exist, and that together, they capture several fundamental truths about the startup journey. In Lean Analytics, they’ve decided to synthesise the findings from four frameworks in particular (which I’ve linked to below, for convenience):
- Dave McClure’s AAAR ‘pirate’ metrics.
- Ash Marya’s Lean Canvas.
- Sean Ellis’s Startup Growth Pyramid.
- And finally, The Long Funnel — which is Croll and Yoskovitz’s name for old-school funnel analysis (more on that here).
The analytics framework presented in Lean Analytics takes many of the stages in the above four frameworks and combines them into a single framework with five stages:
- Empathy — You’re looking for a real, poorly-met need that can be found in a reachable market. Once you do so, you’re figuring out how to solve their problem in a way customers will accept and pay for.
- Stickiness — You’re looking for the right mix of products/features/functionality that will keep users around.
- Virality — You’re looking for ways to fuel growth organically and artificially.
- Revenue — You’re looking for a scalable and sustainable business with the right margins in a healthy ecosystem.
- Scale — You’re looking to scale up the business on all fronts.

Croll and Yoskovitz note that a) they believe these stages are experienced by most startups in most industries, and b) they urge the reader to think of these stages as ‘gated’ — that is, you have to pass the one you’re on before you get to move to the next one in the framework. This then implies that ‘lines in the sand’ exist for each of these stages — hit a certain set of numbers, and you can comfortably move on to the next stage.
The authors note that they’ve used the framework to organise much of the content of the book. We’ll explore the metrics for each stage at a latter part of this summary, as you’ll see in a bit. But a second-order implication immediately makes itself clear: because the startup journey consists of several ‘gated’ stages, you can simplify the chaos of execution by simply focusing on a single metric at a time, picking that metric based on the stage that you’re currently in.
This leads us to …
The One Metric That Matters (OMTM)
Croll and Yoskovitz open this chapter by observing that startup founders are often ‘like magpies — that is, they chase the shiniest new thing they see.’ Focusing on one metric above all others provides a uniquely powerful sense of focus across the entire company — a focus that is much needed in the early stages of a company’s life.
Which metric should you pick? As I’ve mentioned earlier, the OMTM you choose depends on which stage of the startup journey you’re at. But the authors have an additional piece of advice on this topic: pick a metric from the riskiest portion of your business.
For instance, if you’re at the Empathy stage, your biggest risk is identifying a problem that nobody cares about. If you’re at the Stickiness stage, your biggest risk is building a solution that isn’t good enough for users to use you for the long term. If you’re at the Virality stage, your biggest risk is that you are unable to find good lead acquisition channels. And on it goes.
Croll and Yoskovitz tell us that they use OMTM as a measure of competence amongst the startups they advise and invest in:
At Year One Labs, one of the litmus tests for us as advisors and investors was the clarity with which a team understood, and tracked, their OMTM. If it was on the tip of their tongues, and aligned with their current stage, that was a good thing. If they didn’t know what it was, if it was the wrong metric for their stage, if they had several metrics, or if they didn’t know what the current value was, we knew something was wrong.
There are four good reasons to pick a single metric and to focus on it to the exclusion of everything else:
- First, picking and using a OMTM gives you a single metric that answers the most important question you have. When you’re running a startup, you’ll be trying to answer a hundred different questions about business execution, and attempting a million different things. This is confusing, and ineffective. Croll and Yoskovitz argue that it’s a lot more effective if you pick a single metric to focus on. Identify the riskiest areas of your business as quickly as possible, and figure out where the most important question is within that area.
- The OMTM forces you to draw a line in the sand. Picking a metric implies picking a goal to hit. After all, you need a way of defining success.
- It focuses the entire company. Avinash Kaushik has a name for trying to report too many things: ‘data puking’. Having an OMTM focuses your entire company. Croll and Yoskovitz urge you to display this metric prominently throughout your entire company, using web dashboards, on TV screens, and in regular emails.
- It inspires a culture of experimentation. There’s this old Silicon Valley quote that goes ‘you make what you measure’. This is true of the OMTM — by focusing fanatically on a single metric, you push your team to run experiments to move the metric upward.
There’s a powerful example of an OMTM in this chapter: in the restaurant business, the one metric that matters is the ratio of staff costs to gross revenues for the previous day. When staffing costs exceed 30% of gross revenues, that’s bad because it means you’re either spending too much on staff, or not deriving enough revenue per customer. This ratio works because:
- It’s a simple number.
- It’s immediate: you can generate it every night.
- It’s actionable: you might not be able to renegotiate ingredient costs, change your menu, or redo your lease agreement immediately. But you can make changes to staffing or encourage upselling the very next day.
- It’s comparable: you can track it over time, and compare it to other restaurants in your neighbourhood or category.
- It’s fundamental — it’s fairly well known, and reflects two basic facets of the restaurant business model.
When you’re coming up with a OMTM for your business, you should aim to have something as descriptive and as actionable as the restaurant staff costs to gross revenues ratio. That’s how powerful it should be.

Of course, unlike the restaurant business, startups go through multiple phases of growth, which mean that the metrics you’ll have to look at would differ depending on which stage you’re at. But the OMTM works just as well for this. Croll and Yoskovitz point out that the OMTM model has a squeeze toy effect — that is, in the pursuit of optimising the one metric that matters for your current stage, you will stress the metrics for another part of your business that isn’t doing so well. This tells you what to focus on next — perhaps even what to turn into your next OMTM.
For instance, if you’ve been optimising the number of enrolments in your gym, you might find out that you’ve topped out in your given market, and are facing a declining rate of new signups. An obvious next step would be to focus on reducing costs per customer so you can turn in a larger profit.
The Components of a Business Model
How do you grow a business? Croll and Yoskovitz quote Sergio Zyman, Coca-Cola’s CMO, who said that “marketing is about selling more stuff to more people more often for more money more efficiently.” They go from that to conclude that business growth comes fundamentally from improving one of five ‘knobs’:
- More stuff means adding products or services that your customers want.
- More people means adding users — through virality, word of mouth, or through some form of marketing.
- More often in the context of a web business means stickiness. You want people to keep coming back to your service.
- More money means upselling and maximising the price that users will pay (or the revenue you get per user, if you have an ad business, for instance).
- More efficiently means reducing the cost of delivering that service to customers.
(I should note that there is a possible bad situation where you are in a mature market with established competitors; in this case growth is very difficult because the market has been tapped out, and none of the five knobs will make much of a dent in business growth. But Croll and Yoskovitz ignore this — perhaps rightly so; they are focused on startups in growing markets.)
The authors then propose that most web-based businesses consist of a few different components, and when we discuss metrics for different types of business models, what we can do to make things easier is to break down the model into five components:
- The acquisition channel — how does the business acquire new customers?
- The selling tactic — how does the business convince visitors to become users, or users to become customers? This could be a time limit, a capacity limit, locking of features to higher price points, or the removal of ads, and so on.
- The revenue source — how does the business make money? This could be from direct sources like a customer paying the business for a product. Or it could be an indirect one like showing ads to the customer, or selling the data they generate from usage. This component also captures nuances like payment up front, or a subscription over time.
- The product type — what value does the business offer in return for the revenue? This could be as abstract as the personal status derived from posting updates on Facebook or Instagram, or as obvious as the price and availability of Airbnb’s list of house rentals.
- The delivery model — how does the business get the product to the customer? This includes cloud-based software as a service, or on-premise installations, delivered with training.
The five components lend themselves naturally to different measurements. Croll and Yoskovitz note that when we talk about startup business models, we usually mean a combination of options in each of these five components.
For instance, as a SaaS company, you are locked into a particular product type (B2B software) and delivery model (cloud), but you could vary the other three components:
- You could acquire users via low-cost content marketing. Or do so via paid advertising. Or lead generate using a service. Or do external sales.
- You could convert those leads to customers by having a free tier. Or selling them using a time-limited free trial. Or do a typical enterprise sales process.
- You could charge for installation and services up front. Or charge it monthly, as per normal. Or provide a discount for yearly renewals.
Each of these options will ultimately determine the metrics you measure.
Six Business Models, Examined
Lean Analytics cover six different business models, which each represents a different combination of the six factors we’ve mentioned above.
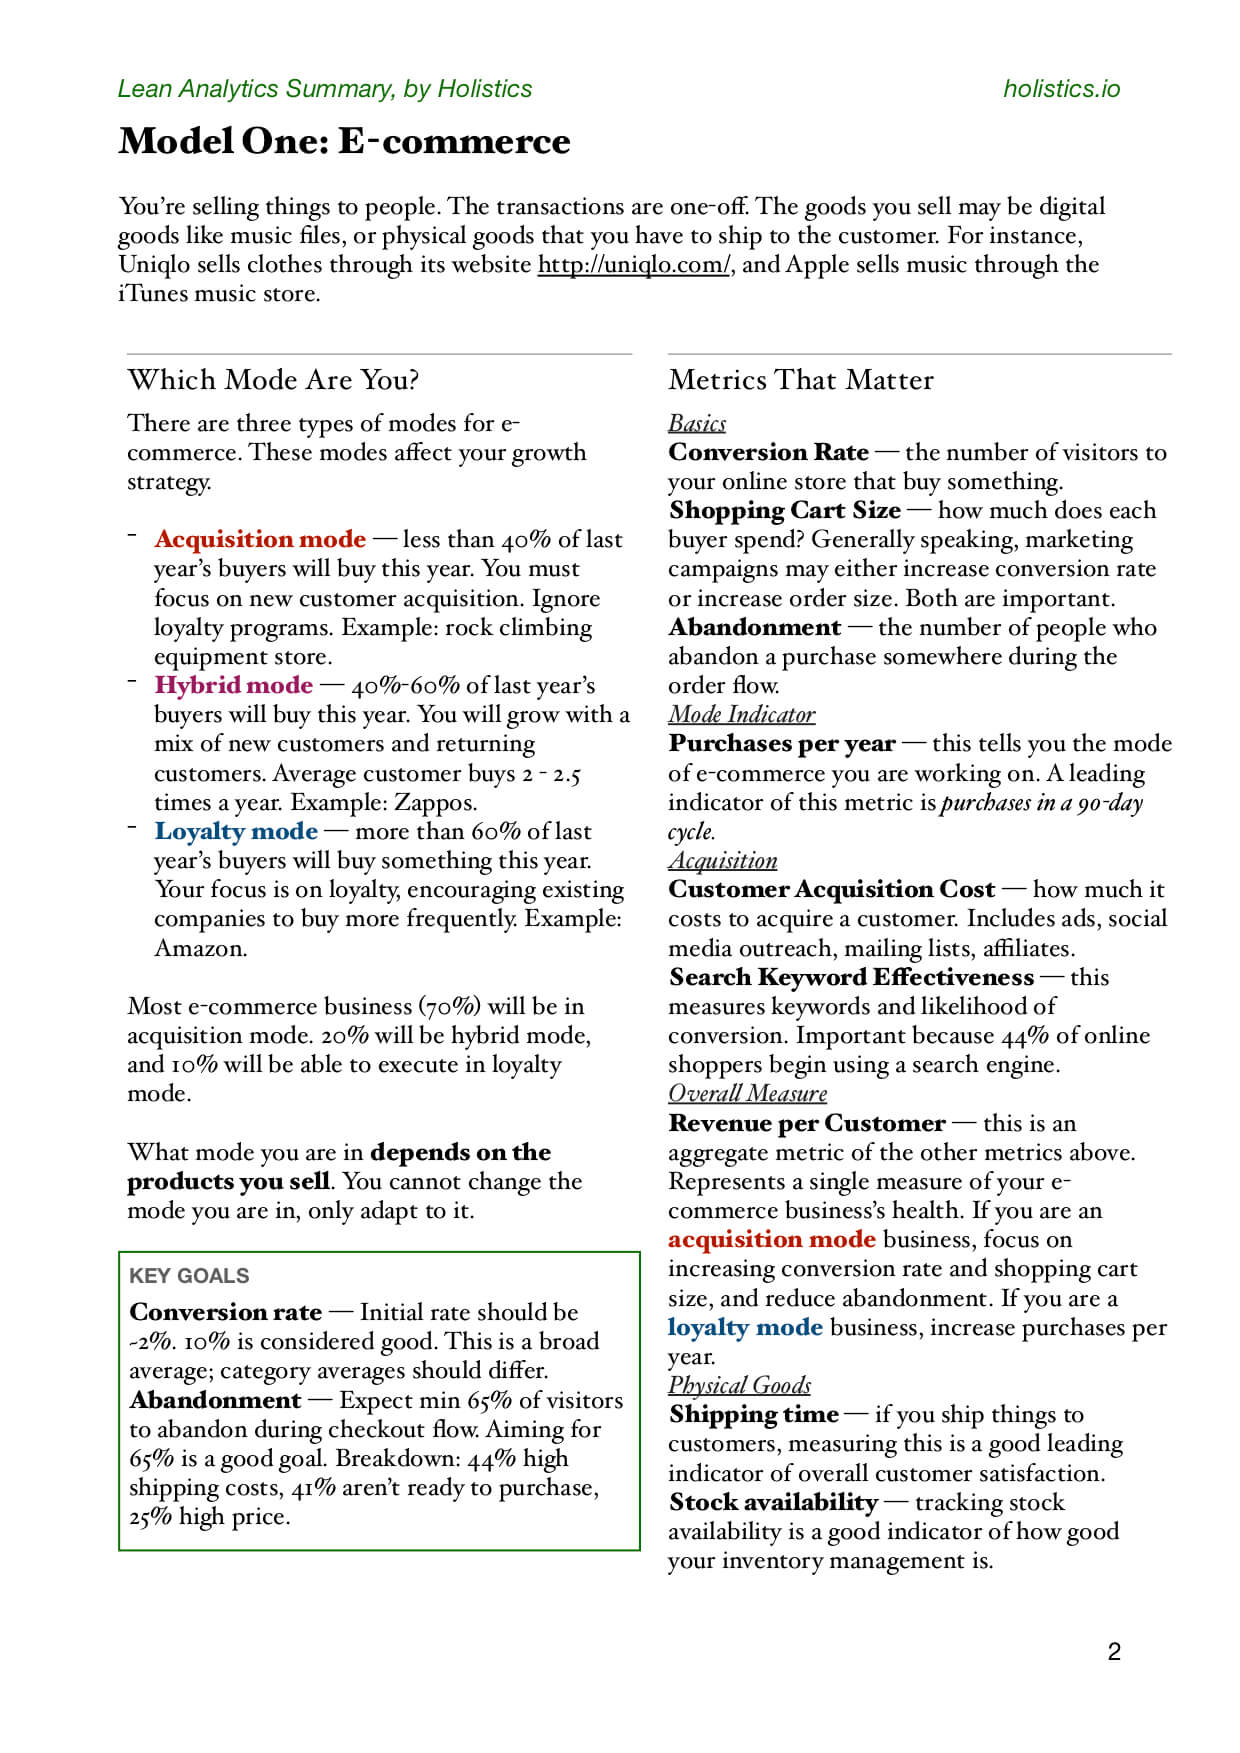
For the sake of succinctness, I’ve summarised the metrics that Croll and Yoskovitz recommend for each of the six business models in the following quick-look PDF, which you may download below.
Here's a sample page from the document:

I’ve done my best to optimise the presentation of this information in an easily-skimmable form, so you may bring the document with you as you go off to implement Lean Analytics in your company. In this summary, you’ll learn:
- The three different modes of e-commerce, and the metrics that you should pay attention to for each.
- The economics of subscription-based businesses, and the ratios that all SaaS founders should keep an eye on.
- Analytics for mobile app businesses, where you’re charging for apps, or downloadable components in-app.
- Numbers for media site businesses, that make money primarily through advertising.
- The metrics of user-generated content sites, like Facebook, reddit, and Twitter.
- And, finally, the analytics of two-sided marketplaces.
In the next part of this series, we’ll look at the different metrics for each of the five stages of startup life, and close off with techniques and tricks for building a data-driven culture in your organisation.
What's happening in the BI world?
Join 30k+ people to get insights from BI practitioners around the globe. In your inbox. Every week. Learn more
No spam, ever. We respect your email privacy. Unsubscribe anytime.

