Lean Analytics Part 2: The Stages of a Data Driven Startup
In Part 2 of our summary of Lean Analytics, we cover the five stages of a data driven startup, and the book's tips for creating a data-driven culture in your company.
In Part 1 of our Lean Analytics summary, we covered the basics of analytical thinking, and provided you with a summary sheet of six basic tech-company business models. In Part 2, we’ll be discussing the metrics and thinking associated with the five stages of the lean analytics framework.
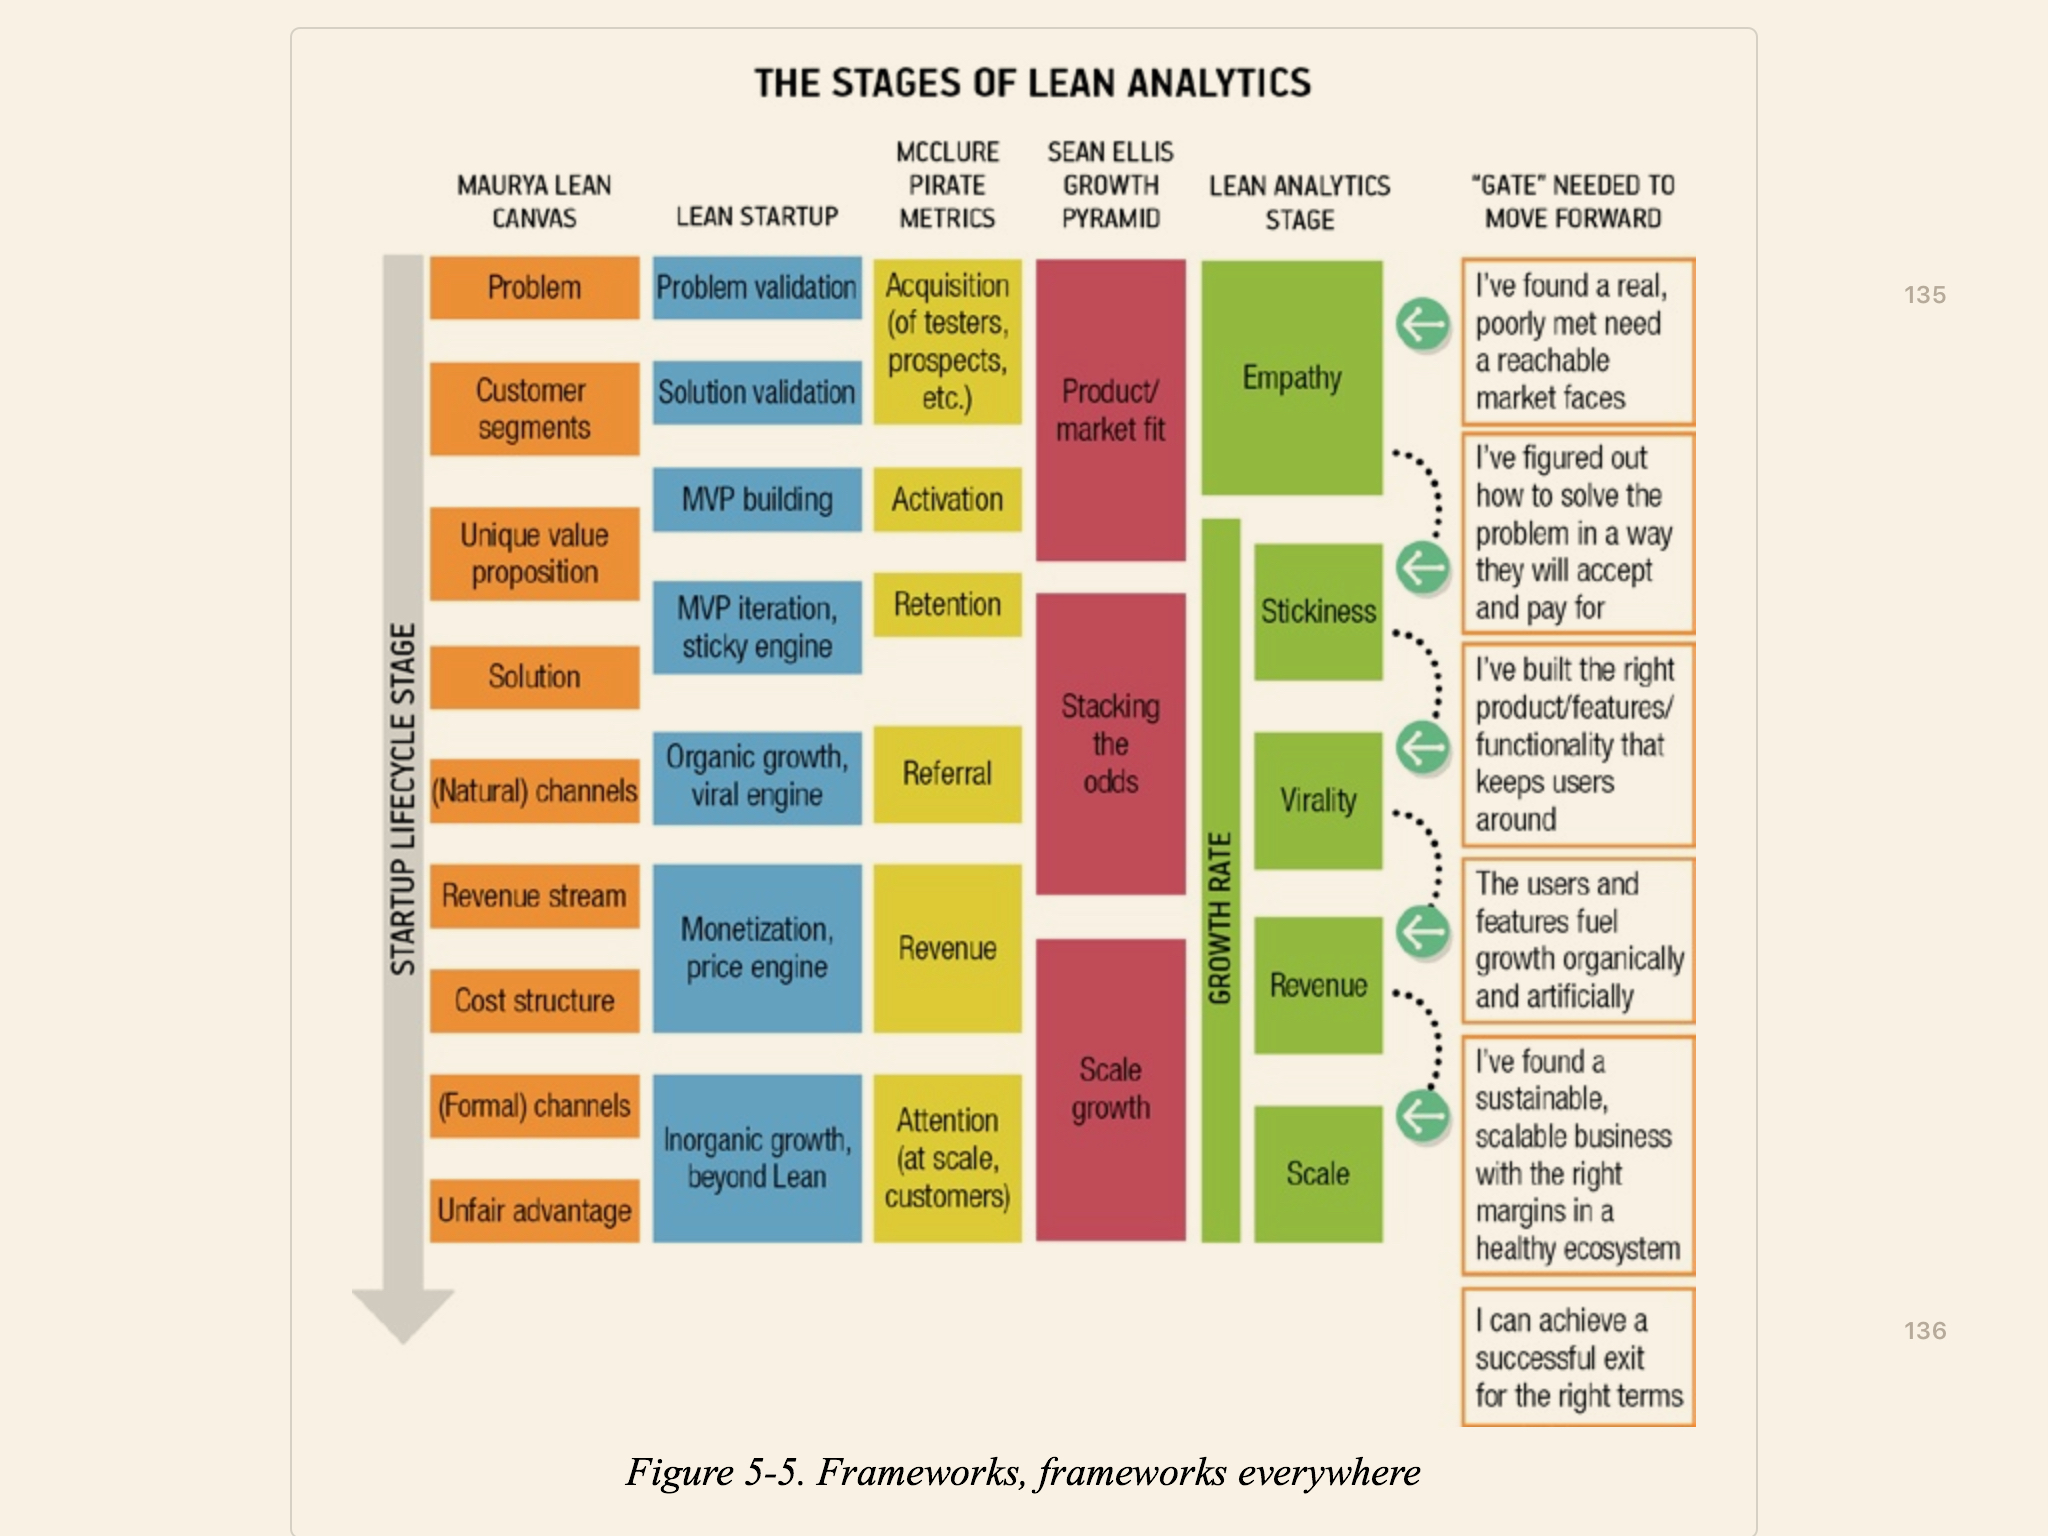
To recap, Lean Analytics depends on the following five stages:
- Empathy — You’re looking for a real, poorly-met need that can be found in a reachable market. Once you do so, you’re figuring out how to solve their problem in a way customers will accept and pay for.
- Stickiness — You’re looking for the right mix of products/features/functionality that will keep users around.
- Virality — You’re looking for ways to fuel growth organically and artificially.
- Revenue — You’re looking for a scalable and sustainable business with the right margins in a healthy ecosystem.
- Scale — You’re looking to scale up the business on all fronts.
Croll and Yoskovitz assert that most startups go through the five stages elucidated here, and they argue that each stage works as a ‘gating mechanism’ — that is, only once you’ve passed through one of these stages should you move on to the next.
But the authors also admit that these are generalisations, and you should pick only what is applicable to your company. Objections on this point are common. For instance, I squint suspiciously on the inclusion of ‘virality’ as an entire stage, instead of a discussion on broader acquisition methods and their metrics, but it appears Croll and Yoskovitz have made the decision to focus on virality to the exclusion of other methods of customer acquisition … for better or worse.
We’ll go through each of these stages below.
Stage One: Empathy
The first stage of a startup’s life is what Croll and Yoskovitz call the ‘empathy stage’. The founders are concerned with three things:
- Is the problem they intend to solve painful enough?
- Do enough people care?
- Are people already trying to solve it?
These three questions are fundamentally qualitative in nature, and so the metrics that you’ll collect in this stage will be qualitative as well. You will conduct problem interviews, storyboard and brainstorm possible solutions, watch potential customers for body language and signs that the opportunity is worth pursuing.
The goal of this stage is to locate a problem that is painful enough and lucrative enough to solve, in order to build a company around it. A lot has been written about the difficulties of this stage, however. As a taste test:
- When interviewing potential customers, people will tell you what you wish to hear — often subconsciously — because they want to make you happy.
- The ability to listen for real problems (without bias!) is very difficult. It requires empathy and practice.
- Validating a problem isn’t sufficient to build a company — the problem could be real and painful but the customer might not be motivated to pay enough for it to support a viable business.
While Croll and Yoskovitz cover some of the techniques that exist for this stage, my recommendation is to skip this section entirely and go read a book titled The Mom Test by Rob Fitzpatrick. Better still, read this summary, for a fraction of the time.
Stage Two: Stickiness
The goal of stage two is to validate that you have a solution that is useful enough and sticky enough to keep people using it. The metric that matters here is retention, which the authors call ‘stickiness’.
More specifically, Croll and Yoskovitz argue that you should focus on cohort stickiness. This could be usage frequency (if you are a social media app, for instance, or a SaaS offering), or some other metric that indicates or promotes engagement. For instance, the authors talked about a qidiq, a (now defunct, it should be noted) group survey tool. The founders realise they could get better engagement if they let users respond to surveys without an account, and chose to make response rate their One Metric That Matters (OMTM).
Croll and Yoskovitz note that you shouldn’t care about acquisition at this stage. This is akin to optimising water flow into a leaky bucket. You shouldn’t turn the faucet until you’re sure that your solution is good enough to get users to stick around.
The authors also suggest two principles to assist with your pursuit of stickiness:
- You should be willing to iterate on anything — and they really mean anything … you should be willing to experiment with changing your business model or your acquisition plan in pursuit of higher stickiness. These aren’t normally elements that you’ll think of changing in the pursuit of engagement, but Croll and Yoskovitz point out that you don’t know until you experiment. At this early stage, everything’s up for consideration.
- You should figure out the simplest, least-friction path to aha for your customer — the aha moment here is the moment that your customer understands the value your product offers them. Once they do so, it’s highly likely that they’ll stick around. Croll and Yoskovitz relay a conventional piece of product management wisdom: when you’re designing and building a product, you want to get the user to that moment as quickly as possible. More concretely, figure out that paths to aha, and figure out how to get new users on that path.
A common objection at this point is that certain products require a minimum number of users in order to present compelling value propositions. This is especially true for products with network effects. For instance, Facebook, Yelp and LinkedIn require a minimum number of people to be compelling for new users to join.
Croll and Yoskovitz argue that optimising for users is really expensive, and therefore dangerous if you’re not sure your product is engaging enough to hold on to them. There are typically two playbooks for dealing with network effects:
- You design for ‘single player mode’ — that is, your product should deliver value even without a social graph. This was the strategy that Instagram used, as filters provided a compelling reason to use the app, even in the nascent days of the network.
- You grow roots in small, targeted communities before expanding outwards — this is the more tenable option for products that really depend on network efforts to create value. The quintessential example here is Facebook, which focused on college campuses in the early years, and Yelp, which focused on night clubs in a tiny handful of cities, before expanding services to other establishments.
The final tool that Lean Analytics gives us is something called a ‘Problem/Solution Canvas’. It looks like this:
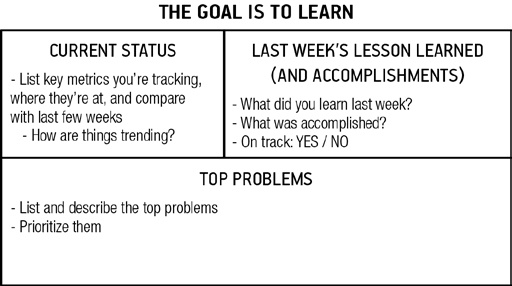
The Problem/Solution canvas is meant to be filled in on a weekly basis. The goal? To provide some structure to the cadence of experimentation and execution.
Step Three: Virality
Step three is when you’ve finally built a product that’s sticky enough, and therefore valuable enough, to begin optimising for growth. While Lean Analytics focuses on virality factors in this stage above all others, I take this stage to mean ‘turn on the faucet and optimise for user acquisition’. This could mean experimenting with acquisition channels like ads, content marketing, or lead gen, or it could just mean … well, simple virality.
Croll and Yoskovitz open their discussion of this stage with the idea that virality is really divided into three types:
- Inherent virality — this is the virality spread that comes from natural usage of the product. For instance, collaborating on Google Docs, or sharing a file via Dropbox.
- Artificial virality — this is the virality that comes from gamification and incentives. Dropbox is famous for this — if you invite a new user, both you and the new user are rewarded with extra storage.
- Word-of-Mouth virality — this is the spontaneous virality that emerges from when users tell others about your product. Not all products benefit from inherent virality, or may be augmented to benefit from artificial virality. But nearly all good products will benefit form some word-of-mouth.
Lean Analytics also asserts that having some amount of virality will augment your natural marketing spend efforts. This allows you to ‘get the biggest bang for your marketing buck.’
The actual question of measuring virality reduces to just two key metrics:
- The Viral Coefficient — this is the number of new customers that each existing customer is able to successfully convert. To calculate this metric, you first calculate the invitation rate, which is the number of invites sent divided by the number of users you have. Then, you calculate the acceptance rate, which is the number of signups or enrolments divided by the number of invites. Finally, you multiply the two together. What you’re looking for is a number that is > 1, because that means that every new user is inviting at least another user.
- The Viral Cycle Time — this is the amount of time it takes for a user to invite others. Cycle time makes a huge difference, so much so that investor David Skok argues that it’s more important than viral coefficient. To wit: “After 20 days with a cycle time of two days, you’ll have 20,470 users, but if you halved that cycle time to one day, you would have over 20 million users!”
These two metrics in turn imply that you may do a small handful of things to increase your virality:
- You may focus on increasing the invite acceptance rate.
- You can try to extend the lifetime of the customer so they have more time to invite people (this is a laudable goal regardless of virality; see stage two above).
- You can try to shorten the cycle time for invitations, to get growth faster.
- Or you can work on convincing customers to invite more people.
Croll and Yoskovitz do acknowledge that such measures don’t apply to enterprise companies, but argue that a good substitution for this is to measure Net Promoter Score.
Growth Hacking
Worth mentioning at this stage is the idea of Growth Hacking, which Lean Analytics describes as a ‘data-driven approach to marketing’. If we look past the buzzwords, however, growth hacking is basically the act of finding a leading-indicator that is correlated to some core business metric, and then attacking that leading indicator in order to increase the odds of improving that core business metric.
Here are several examples of famous tech companies, and the leading indicators they’ve identified in their businesses:
- Facebook: a user would become engaged if she reached seven friends within 10 days of creating an account. This means that Facebook should do everything possible to get a new user to that amount of friends within the first 10 days.
- Zynga: if a user came back the day after she signed up for a game, she was likely to become an engaged user (and eventually pay for in-game purchases).
- Dropbox: a user is more likely to become engaged if she puts at least one file in one folder on one of her devices.
- LinkedIn: there is a correlation between the number of connections a user creates in a certain number of days and the probability of longer-term engagement.
This is a lot easier said than done, of course. Leading indicators — especially leading indicators that are correlated to eventual positive outcomes, rely on finding patterns in data. The key method to doing this is to segment users into those who stuck around and those who didn’t, and then go spelunking in the data for both segments in order to identify what they have in common.
To that end, Lean Analytics points out that good leading indicators have a few common characteristics:
- They tend to relate to social engagement, content creation, or return frequency.
- The leading indicator must be clearly tied to some core business model metric. For instance, user engagement is crucial for the eventual profitability of user generated content (UGC) sites. So anything that serves as a predictor for high levels of future engagement should be prioritised.
- The indicator should come early in the user’s lifecycle or conversion funnel. This is based on a simple calculation: assuming that most users drop off over time in the early days of your product, you should focus your attention on the earliest parts of your funnel where you have the most users, because that’s where you’ll have to most data points to consider.
- Good indicators should also be an early extrapolation. A good example of this is the e-commerce business model. An e-commerce business can be in ‘loyalty’ mode (repeat buys) or ‘acquisition’ mode (one-time only purchases). Instead of waiting a whole year to understand what mode the business is in, just look at the first 90 days and extrapolate from there, in order to pick an execution strategy.
Stage Four: Revenue
This chapter contains one of the best analogies of the book.
Imagine you have a little machine, Croll and Yoskovitz write. On one end of the machine, you put in a penny. The machine whirs and clunks and puffs, and then after a couple of seconds, a nickel comes out on the other end of the machine.
“Do that again!” the VCs roar. So you do it again. “No tricks?” An analyst asks. You open up the machine to show that no nickels are hidden inside. “How quickly can pennies be turned into nickels?” You tell them that the machine takes five seconds to cool down, so you can make \$36 nickels an hour, for a \$28.80 profit, with an 80% margin.
This ‘penny machine’, as Croll and Yoskovitz call it, is in essence what a business is. At its most abstract level, a business is a thing that takes in money on one end, and turns it to more money on the other end. The financial metrics that investors and businesspeople ask for are the means of measuring this conversion of money into more money.
When you hear someone talking about ‘unit economics’, the penny machine is essentially what it devolves into: for each dollar you put into the business, how much do you make?
For SaaS businesses, there is a particular formula that you can use to determine if you are healthy. You need three numbers:
- Your quarterly recurring revenue for quarter x (QRR[x])
- Your quarterly recurring revenue for the quarter before x (QRR[x-1])
- And your sales and marketing expense for the quarter before x (QExpSM[x-1])
(If you don’t have quarterly sales and marketing spending, you can simply take annual spending and divide it by four.)
The final step is to put the three numbers together. You’re going to divide how much you changed your recurring revenue in the past quarter by what it cost you to do so, as measured by sales and marketing spend. The formula looks like this:
$$\frac{QRR[X]-QRR[x-1]}{QExpSM[x-1]}$$
If you get a value below 0.75, you have a problem. What you’d like to aim for is a value that is higher than 1.
Since this ratio measures the growth that comes from marketing and sales spend from the previous quarter, a number above 1 indicates that each dollar you put in is returning more, while a ratio below 1 tells you that each dollar that goes into sales and marketing spend is returning less than that dollar you put in.
In essence, this formula gives you a quick and dirty measure of your unit economics.
Revenue Growth … The Coca Cola Way
Croll and Yoskovitz return to the quote by Coca-Cola CMO Sergio Zyman’s quote on marketing that I covered in Part 1 of my summary: “marketing is about selling more stuff to more people more often for more money more efficiently.” They assert that growing your company at the revenue stage, assuming you have product-market fit, is a matter of chasing down one of these factors, as it applies to your company:
- Selling things more efficiently applies if you’re dependent on physical, per-transaction costs (like direct sales, shipping products to a buyer, or signing up merchants). You don’t want your margins to get away from you.
- Focusing on adding more people applies if you’ve found a high viral coefficient, because you’ve got a strong force multiplier added to every dollar you pour into customer acquisition.
- Getting repeat purchases more often makes sense if you have a loyal set of returning customers.
- If your model relies on one-time, big-ticket transactions, then more money per transaction will probably help more, since you’ve only got one chance to extract revenue from the customer, and need to leave as little money on the table as possible.
- If you have a subscription model, and you’re fighting churn, then upselling customers to higher-capacity, higher-price packages with more features will be a key part of your strategy. This means a focus on more stuff.
Apart from sources of growth, one key idea at the revenue stage is breaking even. Here, Lean Analytics lists a number of ways to think about measuring breakeven:
- Breakeven on variable costs — If you are a venture-funded startup, you’re probably spending more on growth than you’re making on revenue. Croll and Yoskovitz say that this is ok: VCs want startups they fund to make a 10x return, so they aren’t that interested in breakeven companies that turn a profit. Instead, a good measure to use is getting to breakeven on variable costs — you want the money you make from each customer to exceed the cost of acquiring and delivering your service to the customer. This means that you’re only spending on fixed costs — things like hiring, rent, building new features, and so on, but each additional customer you add isn’t costing you anything.
- Time to customer breakeven — A key measurement of successful revenue growth is whether the customer LTV exceeds the CAC. But how quickly you get to customer breakeven is also an important factor to consider. A company that takes three months to recoup the costs of acquiring a new customer would do much better than a company that takes a year to recoup such costs.
- EBITDA breakeven — The authors of Lean Analytics note that EBITDA (earnings before income tax, depreciation, and amortisation) fell out of favour in the dot-com bust. But EBITDA breakeven is worth considering in today’s startup world, where the majority of costs in a tech startup are pay-as-you-go costs like cloud computing, as opposed to up-front capital expenditure.
- Hibernation breakeven — This is sometimes known as ‘ramen profitable’, though the more rigorous definition is ‘the business is able to continue growing without new marketing spend; all growth comes from word-of-mouth or virality, and customers don’t get new features’. Once you hit this point, it’s commonly understood that you’re the ‘master of your own destiny’, because you can survive indefinitely.
Stage Five: Scale
This chapter is the weakest of all the chapters in Lean Analytics. The authors admit that lean methods apply more cleanly in the early stages of a startup’s life. Once you reach the scale stage, your metrics begin to resemble those that large companies use to measure and track performance. You begin to be more concerned with competition, and strategic advantages. You’re no longer figuring things out — you’re now fighting to win.
In my view, Croll and Yoskovitz only present two interesting ideas in this section. The first is Michael Porter’s Hole in the Middle Problem. The second is The Three Three’s Model.
The Hole in the Middle Problem
In the 80s, Harvard Professor Michael Porter noticed that firms with a large market share (like Apple, Costco, and Amazon) were often profitable, and so were those with a small market share (like your neighbourhood coffee shop). The problem was companies that were neither small nor large. He termed this the ‘hole in the middle’ problem.
The challenge that medium-sized businesses faced was that they were not large enough to benefit from cost or scale advantages, but they were too large to benefit from a niche strategy. Porter argued that such firms (based on his ‘generic strategies’ framework) needed to make the shift from differentiated competitor to survive the midsize gap, and then achieve scale and efficiency as a large competitor.
Croll and Yoskovitz bring Porter’s ‘hole in the middle’ problem simply to illustrate that a startup isn’t out of the woods yet, even if they hit the Scale stage.
The Three Three’s Model
The Three Three’s Model is simpler. Croll and Yoskovitz write:
(…) By now, you’re a bigger organization. You’re worrying about more people, doing more things, in more ways. It’s easy to get distracted. So we’d like to propose a simple way of focusing on metrics that gives you the ability to change while avoiding the back-and-forth whipsawing that can come from management-by-opinion. We call it the Three-Threes Model. It’s really the organisational implementation of the Problem-Solution Canvas we saw in Chapter 16.
The Three-Threes Model
At this stage, you probably have three tiers of management. There’s the board and founders, focused on strategic issues and major shifts, meeting monthly or quarterly. There’s the executive team, focused on tactics and oversight, meeting weekly. And there’s the rank-and-file, focused on execution, and meeting daily.
Don’t get us wrong: for many startups, the same people may be at all three of these meetings. It’s just that you’ll have very different mindsets as a board than you will as the person who’s writing code, stuffing boxes, or negotiating a sale.
We’ve also found that it’s hard to keep more than three things in your mind at once. But if you can limit what you’re working on to just three big things, then everyone in the company knows what they’re doing and why they’re doing it.
The reason Lean Analytics does so badly on the scale stage is because it attempts to be a generic guide to analytics — something that no longer works when a startup hits the big leagues. At this point, industry dynamics do matter, and neither Croll nor Yoskovitz have the ability to give good advice about the challenges of competing at this stage. They default to generalities, and apart from saying ‘oh, scaling is important!’ do not have much to offer us.
Lean Analytics Inside a Larger Company
I thought Croll and Yoskovitz’s adaptation of Kelly’s 14 Rules & Practices for Skunk Works to be pretty useful, and am reproducing it here for completeness. The authors argue that this approach to building a skunk works effort is particularly applicable when you’re attempting to launch a lean initiative within a larger company. They use the term ‘intrapreneurship’, but I don’t like the buzzwordy name; I also believe this is generally applicable to mid-sized startups. The rules are as follows:
- If you’re setting out to break rules, you need the responsibility for making changes happen — and the authority that can come only from high-level buy-in. Get an executive sponsor, and make sure everyone else knows that you’ve got one.
- Insist on access both to resources within the host company and to real customers. You’ll probably need the permission of the support and sales teams to do this. This is going to be difficult, depending on the org you’re in, but insist on it anyway.
- Build a small, agile team of high performers who aren’t risk-averse, and who lean toward action. If you can’t put together such a team, it’s a sign you don’t really have the executive buy-in you thought you did.
- Use tools that can handle rapid change. Rent instead of buy. Favour on-demand tech like cloud-computing, and opex over capex.
- Don’t get bogged down in meetings, keep the reporting you do simple and consistent, but be disciplined about recording progress in a way that can be analysed later on.
- Keep the data current, and don’t try to hide things from the org. Consider the total cost of the innovation you’re working on, not just the short-term costs.
- Don’t be afraid to choose new suppliers if they’re better, but also leverage the scale and existing contracts of the host org when it makes sense.
- Streamline the testing process, and make sure the components of your new product are themselves reliable. Don’t reinvent the wheel. Build on building blocks that already exist, particularly in early versions.
- Eat your own dog food, and get face-time with end users, rather than delegating testing and market research to others.
- Agree on goals and success criteria before starting the project. This is essential for buy-in from execs, but also reduces confusion and avoids feature creep and shifting goals.
- Make sure you have access to funds and working capital without a lot of paperwork and the need to ‘resell’ people midway through the project.
- Get day-to-day interaction with customers, or at the very least, a close proxy to the customer such as someone in support or post-sales, to avoid miscommunication and confusion.
- Limit access to the team by outsiders as much as possible. Don’t poison the team with naysayers, and don’t leak half-finished ideas to the company before they’re properly tested.
- Reward performance based on results, and get ready to break the normal compensation models. After all, you’re trying to keep entrepreneurs within a company, and if they’re talented, they could leave to do their own thing.
Building a Data Driven Culture
Lean Analytics does have one last interesting section: Part 4, on creating a data-driven culture in your organisation. Croll and Yoskovitz have several general tips for doing so:
- Start Small, Pick One Thing, and Show Value — There will always be naysayers in an org who believe that instincts, gut and ‘the way we’ve always done things’ is good enough. The best thing you can do is to pick a small but significant problem that your company faces and solve it through analytics. This shouldn’t be the most crucial issue your company is facing — that’s likely got too many cooks in the kitchen already (or is mired in politics). Instead, pick an ancillary issue that you can show quick progress with.
- Make Sure Goals are Clearly Understood — Any analytics project you take on needs to have clear goals. If you don’t have a one (which includes a ‘line-in-the-sand goal’, you’ll fail.
- Get Executive Buy-In — Unless you’re the CEO and pushing this approach top-down, you’ll need an exec’s buy-in. Win one exec over, and let the culture spread out from there.
- Make Metrics Simple to Digest — Remember the best practices from Part 1 of our Lean Analytics summary: pick a ratio, don’t present too many metrics, and make sure everything you present is actionable.
- Ensure Transparency — If you’re going to use data to make decisions, it’s important that you share the data and the methodologies used to acquire and process it. The goal here is to build trust. Which, finally, leads us to:
- Don’t Eliminate Your Gut — Remember that analytics isn’t about replacing your intuition; it’s about proving your intuitions right or wrong.
Lean Analytics is a long read, and attempts to do many things — too many, in this writer’s opinion. One thing that I can’t discount, however: Croll and Yoskovitz’s work serves as an accessible guide to the basics of startup analytics. And thanks to this summary, you’ll never need to read the full book to benefit from it.

Staff writer at Holistics. Enjoys Python, coffee, green tea, and cats. I'd love to talk to you about the future of business intelligence!