The Two Types of Operating Indicators
In operational analytics, you're either looking at a leading indicator, or you're looking at a lagging trend indicator. Here's why this particular categorisation is so useful.

There’s a lot of talk these days about building ‘data-driven’ organisations. You’ve likely been in presentations where people throw out terms like ‘agile decision making’, ‘business insight’, and ‘data-backed analysis’.
This is fine at a high level, but when you’re translating these ideas to practice, what do these concepts actually mean? You’ve probably read articles about the importance of data over gut feeling. You’ve probably seen the reports that say many senior managers distrust big data. And in the deepest recesses of your brain, you probably can’t help but feel cynical about the whole shebang. The truth is that ‘becoming more data-driven’ sounds good when it’s on a Gardner slide, but it’s often not clear what that looks like for you.
So let’s take a step back and consider the question from the simplest principles. No buzzwords. Just basic observations.
Data is For Forecasting
When people say that they want ‘data-driven insights’ in order to make ‘intelligent business decisions’, what they usually mean is that they want to know what has happened in the past, so they can predict what’s going to happen in the future.
If you’ve been in business for awhile, this isn’t anything new.
You want to know what has happened in the past, so you can predict what's going to happen in the future
For instance, you might want to predict your team’s work load in the next quarter, so that you may prepare for an upcoming crunch period. Or you might want to forecast future sales, in order to figure out how much inventory you should hold. In such cases, you’re trying to predict future conditions by looking at past trends, which in turn means looking for patterns in your numbers.
Other times, data serves as an early warning system. Good operational analytics gives you the ability to detect problems in your business at the earliest stage possible. This could be incidences such as a server falling over, your NPS score dipping over the course of a quarter, or customer support receiving an unprecedented wave of new customer complaints. In such cases, you are comparing what’s happening now to some baseline that you’ve established in the past. This enables you to investigate before the problem gets out of hand.
If we set aside the fancy terminology, these two scenarios are captured by two types of indicators:
- Leading indicators — These are indicators that might predict future success.
- Lagging trend indicators — Lagging indicators are indicators that report past performance. Lagging trend indicators are what you get when you measure that performance over a period of time.
We’ll talk about each type of indicator in order.
Leading Indicators
Leading indicators show you what the future might look like. Because they provide information in advance, they give you enough time to act in response to this forecasted future.
Leading indicators are tough. Often, what you’re doing when you’re coming up with a leading indicator is to look for a proxy measurement for an outcome you want. For instance, if you want to increase your sales closing rate, a leading measure of this is the number of leads that enter the top of your funnel.
There are problems with this approach, of course. Proxy indicators don’t map perfectly with the outcomes you desire. In our sales example, a great percentage of leads you’ve gathered might fail to close.
A somewhat clearer leading indicator is a measurement that tells you about the progress you’ve made. A great example of this is the burndown chart. This is the visualisation you see whenever you muck around in the settings of an agile project management tool. The chart represents remaining work on the vertical axis, with time represented on the horizontal axis.
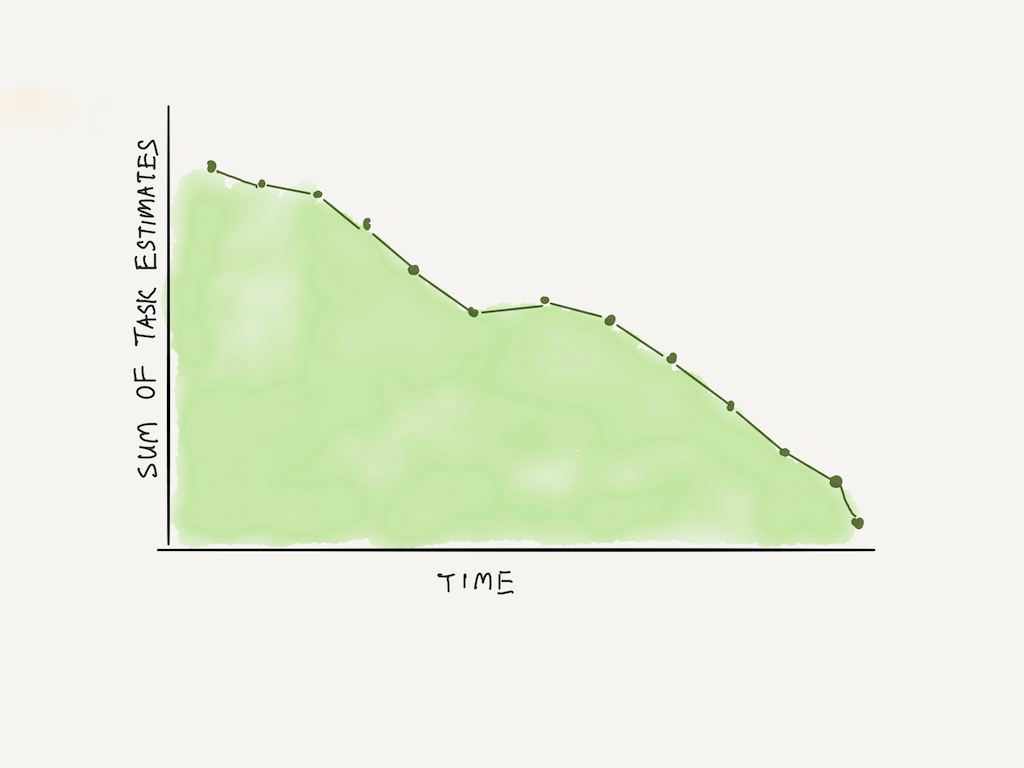 A typical burndown chart.
What makes the burndown chart a good leading indicator is when you compare progress against what’s called a linearity indicator. This is when you draw a straight line diagonally across the chart. If your team’s progress is below the line, there is less work to do than originally predicted and you’re ahead of schedule. If your team’s progress is above the line, you’re in trouble.
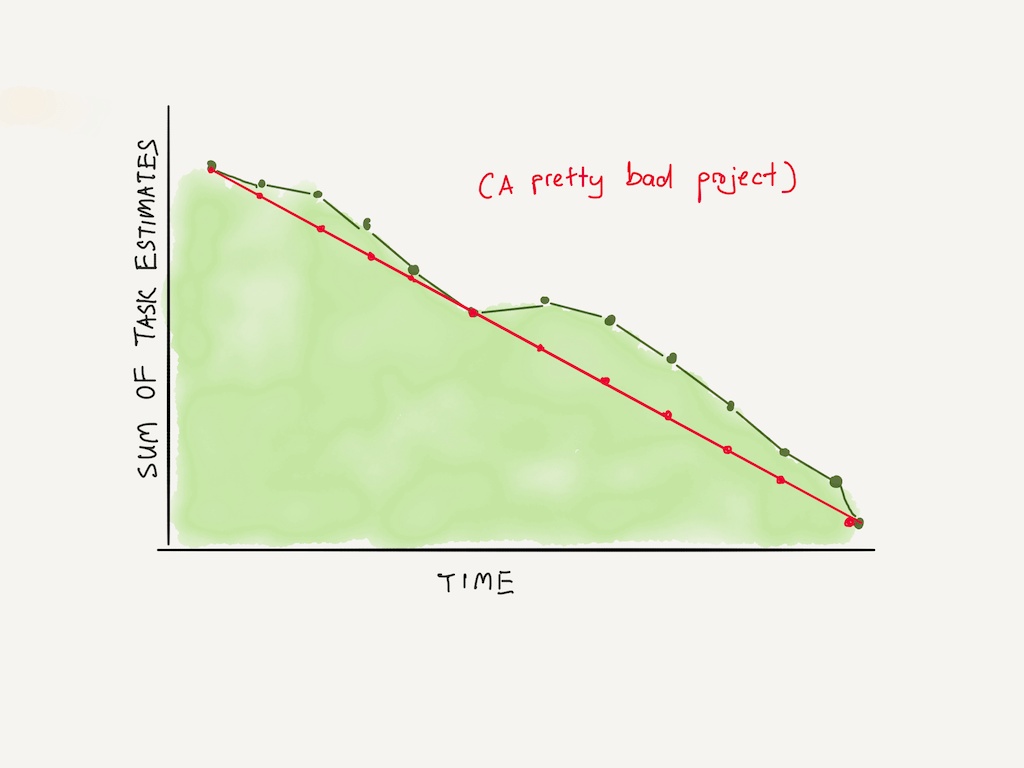 A burndown chart with a linearity indicator. As you can see, this project was mostly behind schedule.
Legendary Intel CEO Andy Grove points out that linearity indicators may be used in other departments. For instance, Intel sets a hiring target every year. This quota is fulfilled over a period of months leading up to college graduation season.
A linearity indicator like the one below will give us an early warning that we are likely to miss our target, which then tells us that we need to buck up on recruiting for the remaining two months.
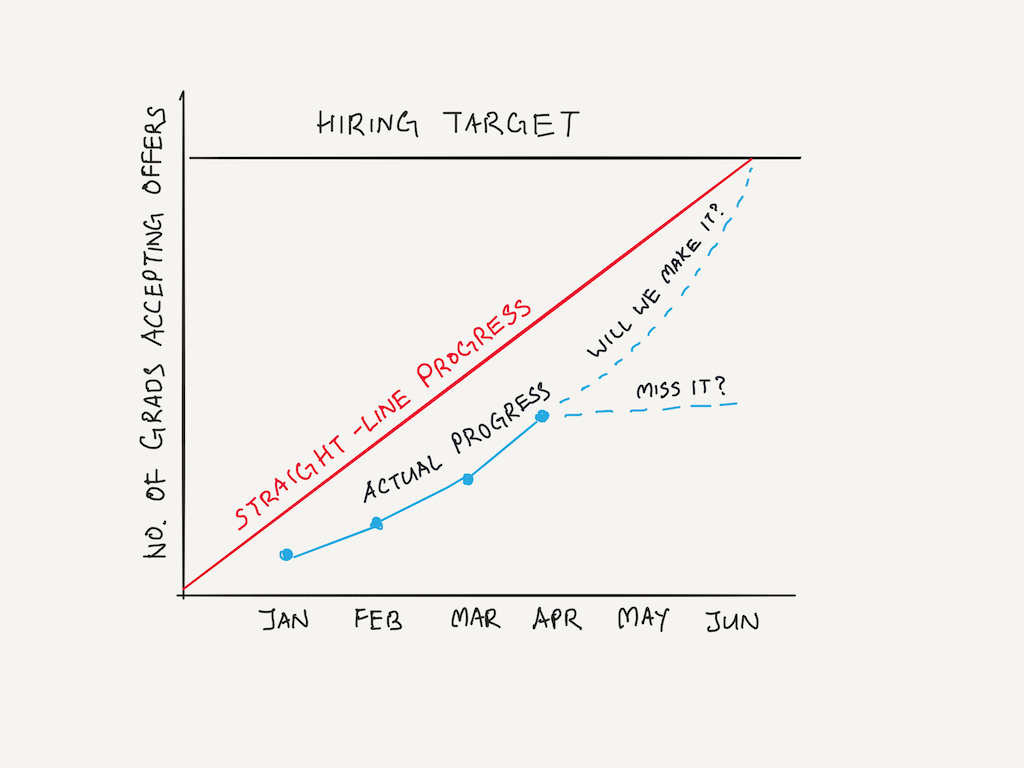 This linearity indicator warns the hiring team that they're likely to miss their hiring goals.
Linearity indicators aren’t the only types of leading indicators, of course. If you notice an uptick in feature requests from sales, you could reasonably predict a choppy time ahead for your software engineering and design teams, with a commensurate uptick in customer support load further down the line. (Alas, new features always result in new customer support problems).
The key thing to remember, of course, is that you must believe in the validity of leading indicators for them to be any useful. If you aren’t prepared to act when they tell you to act, then all you’re generating for yourself is a heap of anxiety whenever you glance at your dashboards.
Lagging Trend Indicators
The other type of indicator that is useful to the busy operator is the lagging trend indicator.
Before we continue, let’s talk a little about lagging indicators in general.
The most obvious metrics are usually lagging indicators. They measure something that has already happened. When your performance is graded at the end of a quarter, the metric that management uses are all lagging indicators — that is, measures of what you did in that quarter.
This is great for measuring performance, but not that useful if you’re using data to make operational decisions. Remember: what you want is the knowledge of what has happened in the past, so that you may know what to do in the future.
When seen in this light, lagging indicators are most useful when used as an ‘early warning system’. This becomes easier to do when presented as part of a trend.
One key benefit of plotting a trend is to learn the ‘normal’ rate of output in your organisation. Every organisation completes work at a certain ‘normal’ rate. This output could be in the form of support tickets closed, features completed, deals delivered, or applicants processed. Once you know the normal rate, any deviation from that standard should leap out at you.
This implies that trend indicators can be done in one of two ways: first, they can be measured against time (you measure your output against the output from previous months), or against a theoretical standard (for example, you can calculate that you should be able to complete 300 widgets a month, but you aren’t currently. Why?)
These two approaches serve slightly different purposes.
- Plotting a trend-line prompts you to compare to past output. But it also allows you to extrapolate from the pattern of performance. A month of increased bug reports might be normal variation. A quarter of increasingly negative bug reports should be an alarm going off.
- Comparing against a theoretical standard forces you to think about why the output is what it is today, instead of what the standard says it should be.
This suggests a number of questions to ask yourself when you’re looking at your lagging indicators:
- What’s the normal rate for this metric?
- Is there a theoretical standard I can set? If so, how am I doing against this standard?
- When do I know that this is a trend, and when may I disregard variation as normal?
Conclusion
Why bother with this way of looking at operational indicators?
The answer is because you want your indicators to be actionable. Most of the time, your operational concerns are simply ‘know what has happened in the past, so that you may act on the future’.
Framing your data as a mix of leading indicators and lagging trend indicators forces you to only consider metrics that help you with that simple goal.
Obviously, having an indicator available to you in a dashboard is far better than having the numbers generated for you every month. When these principles of measurement were first created, operators had to wait for graphs and tables to be plotted on paper for them by their staff. Today, we can do much better.

Staff writer at Holistics. Enjoys Python, coffee, green tea, and cats. I'd love to talk to you about the future of business intelligence!