A Business Process Worth Measuring
The second part of our series on Agile Data Warehouse Design, a 2011 attempt at applying the principles of agile to the practice of data modeling.
This is a second post in a series on Agile Data Warehouse Design, a 2011 book about data modeling. Read the first post here.
In our last post on Lawrence Corr’s and Jim Stagnitto’s Agile Data Warehouse Design, we examined how the book represents the first serious attempt at taking the principles of agile and applying them to the practice of Kimball’s dimensional data modeling. I argued that the authors largely succeed at this task, though the ideas of the book don’t map perfectly to the data systems of today.
This post will give you a taste of what that approach looks like. We’ll use the ideas introduced here to talk about what Agile Data Warehouse Design does well, and why it remains relevant to data teams today.
A Basic Unit of Discovery
In agile software development, the basic unit of work is a minimum set of valuable, working software. And the basic unit of discovery to produce that software is a set of user stories.
Naturally, Corr and Stagnitto take this idea and map it directly onto the practice of data modeling:
- The basic unit of work in data modeling is a star schema (plus everything necessary to access it — including ETL and a BI tool).
- The basic unit of discovery is a data story — about a business process worth measuring.
Corr and Stagnitto aren’t joking when they say ‘story’ — data stories consist of a subject, a verb, and an object. So, think of stories like ‘a customer makes a purchase on our website’, or ‘our customer service rep marks a customer as ‘very annoying’’. Later on in the process, the authors teach you to use ‘dimension data stories’ to suss out dimensional attributes — e.g. ‘Customer has gender. Product has product type.’ The goal of an agile data modeling process, then, is to engage stakeholders in conversation, get stories out of them, and then turn those stories into a star.
The process that Corr and Stagnitto uses to accomplish this is called BEAM✲ — which stands for Business Event Analysis and Modeling (the star at the end represents a star schema; as you’ll soon see, the authors really like their shorthands). BEAM✲ is a structured approach to take you from conversation to story, from story to design document, and then from design document to the basic unit of work.
To put it more concretely, BEAM✲ expects you to do two things:
- The goal of your conversation with stakeholders is to create a ‘BEAM✲ table’ — a design artefact that is implemented within a spreadsheet. This does two things: it lays out the basic structure of your intended schema, and it does so in a way that isn’t threatening to a businessperson. (Most business stakeholders practically live in Excel, after all).
- Then, you take the BEAM✲ table in all its Excel glory, (along with one or two supplementary diagrams) and use it as an input to model data inside your data warehouse.
- Rinse and repeat for the next business process, ad nauseam.
That’s it. That’s the core contribution of the book. Of course, when you frame the entire process like this, it’s clear that Corr and Stagnitto’s contribution is a rapid, structured approach to Kimball data modeling, without the costs of ‘Big Design Up Front’. This means that the ideas of the book will remain useful for as long as you need to turn a set of business reporting requirements into a star schema.
From Conversation to BEAM✲ Table
Let’s give you a quick taste of what BEAM✲ actually looks like.
At the heart of the BEAM✲ process is something the authors call the 7Ws. The process flow looks like this:
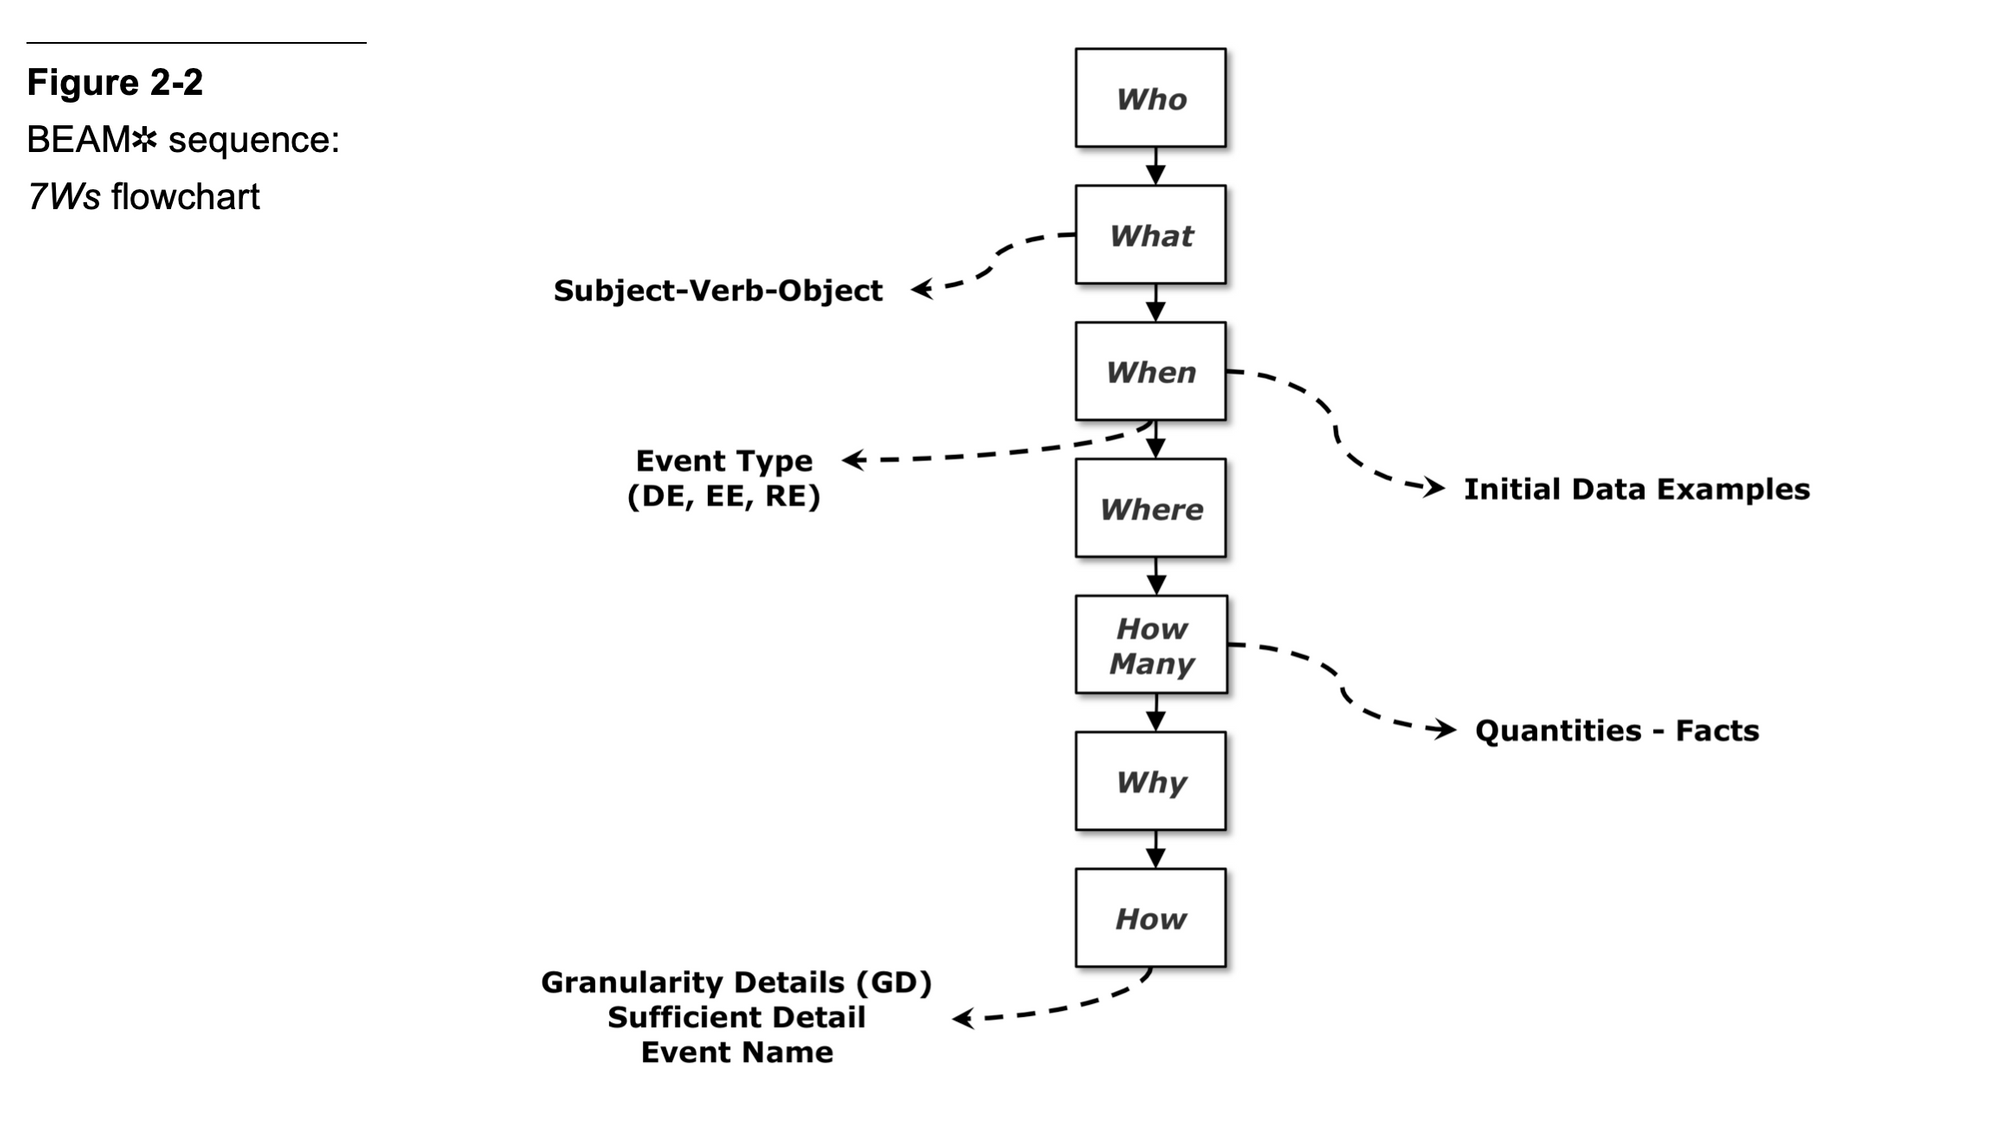
The authors recommend you go through the flow in roughly the prescribed order. For each question in the 7W process, you will unearth some detail that tells you how your eventual data model should look like. Running through the 7Ws looks like this:
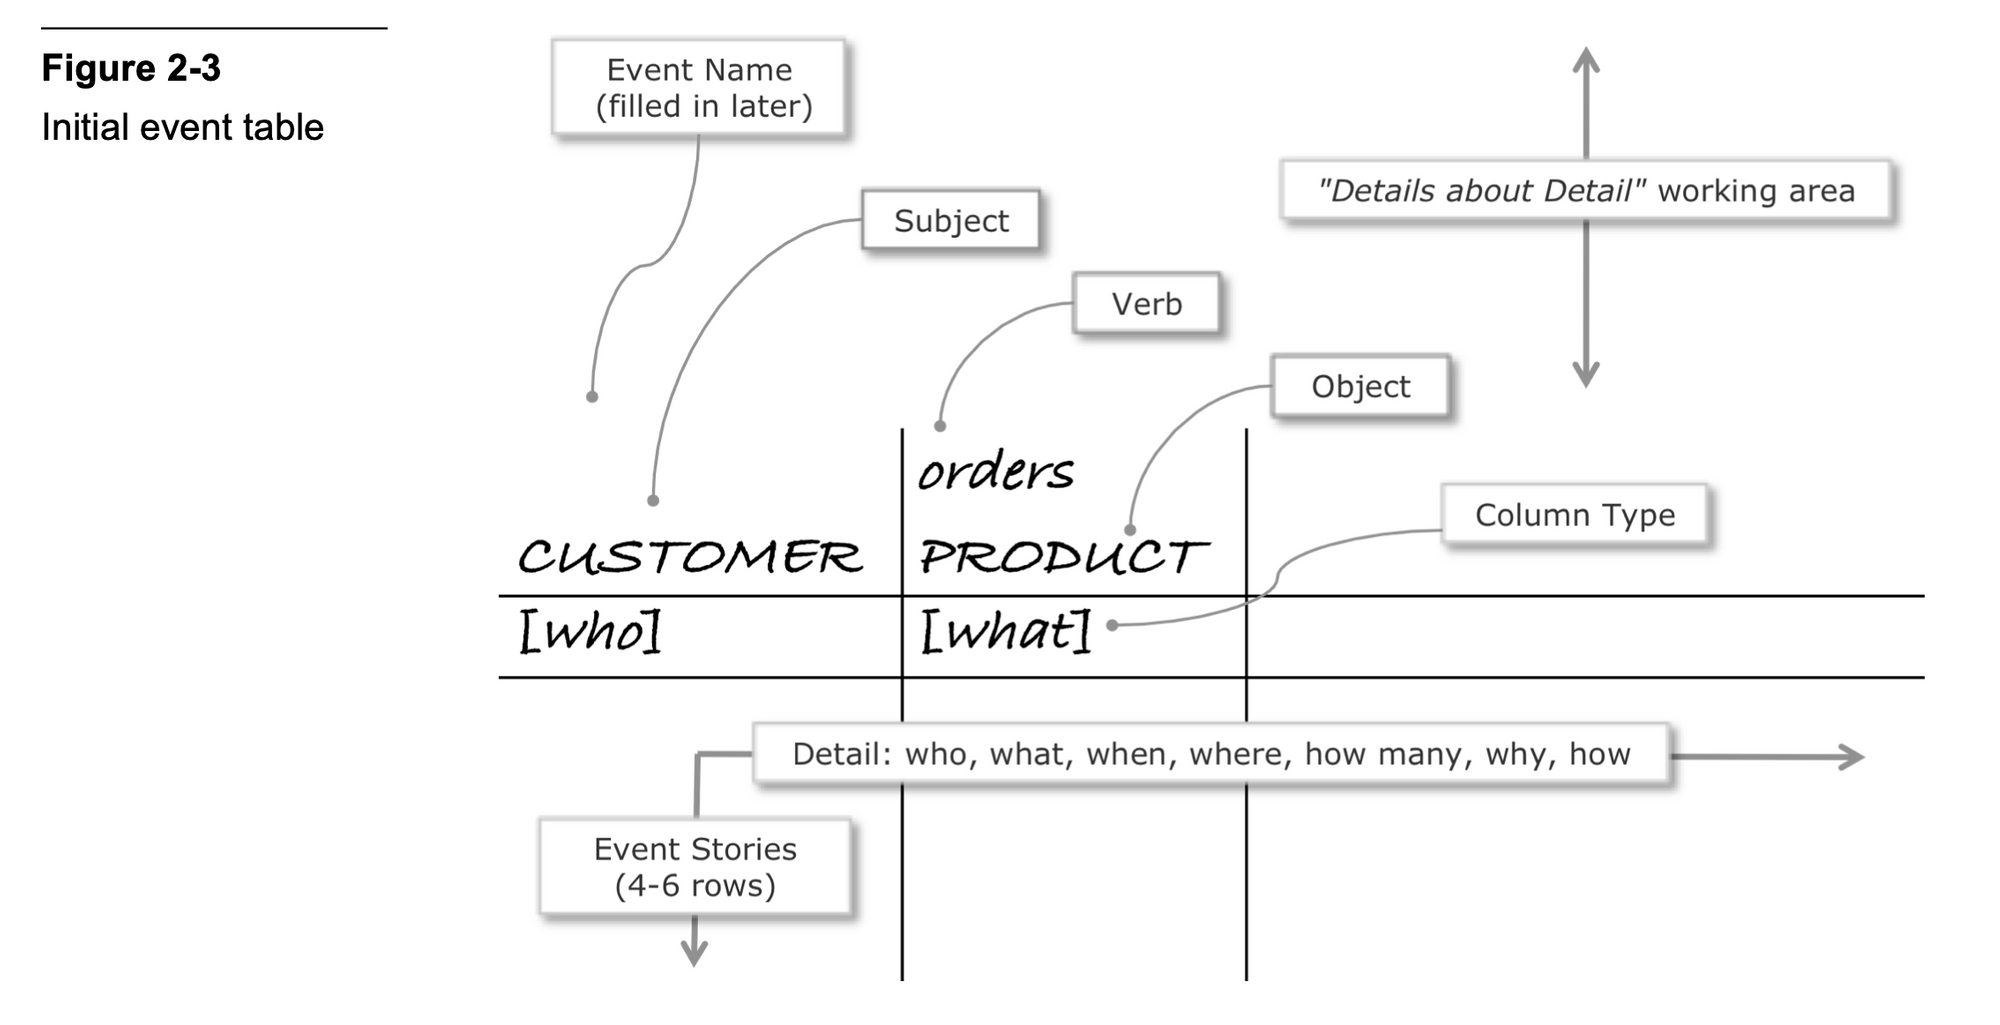
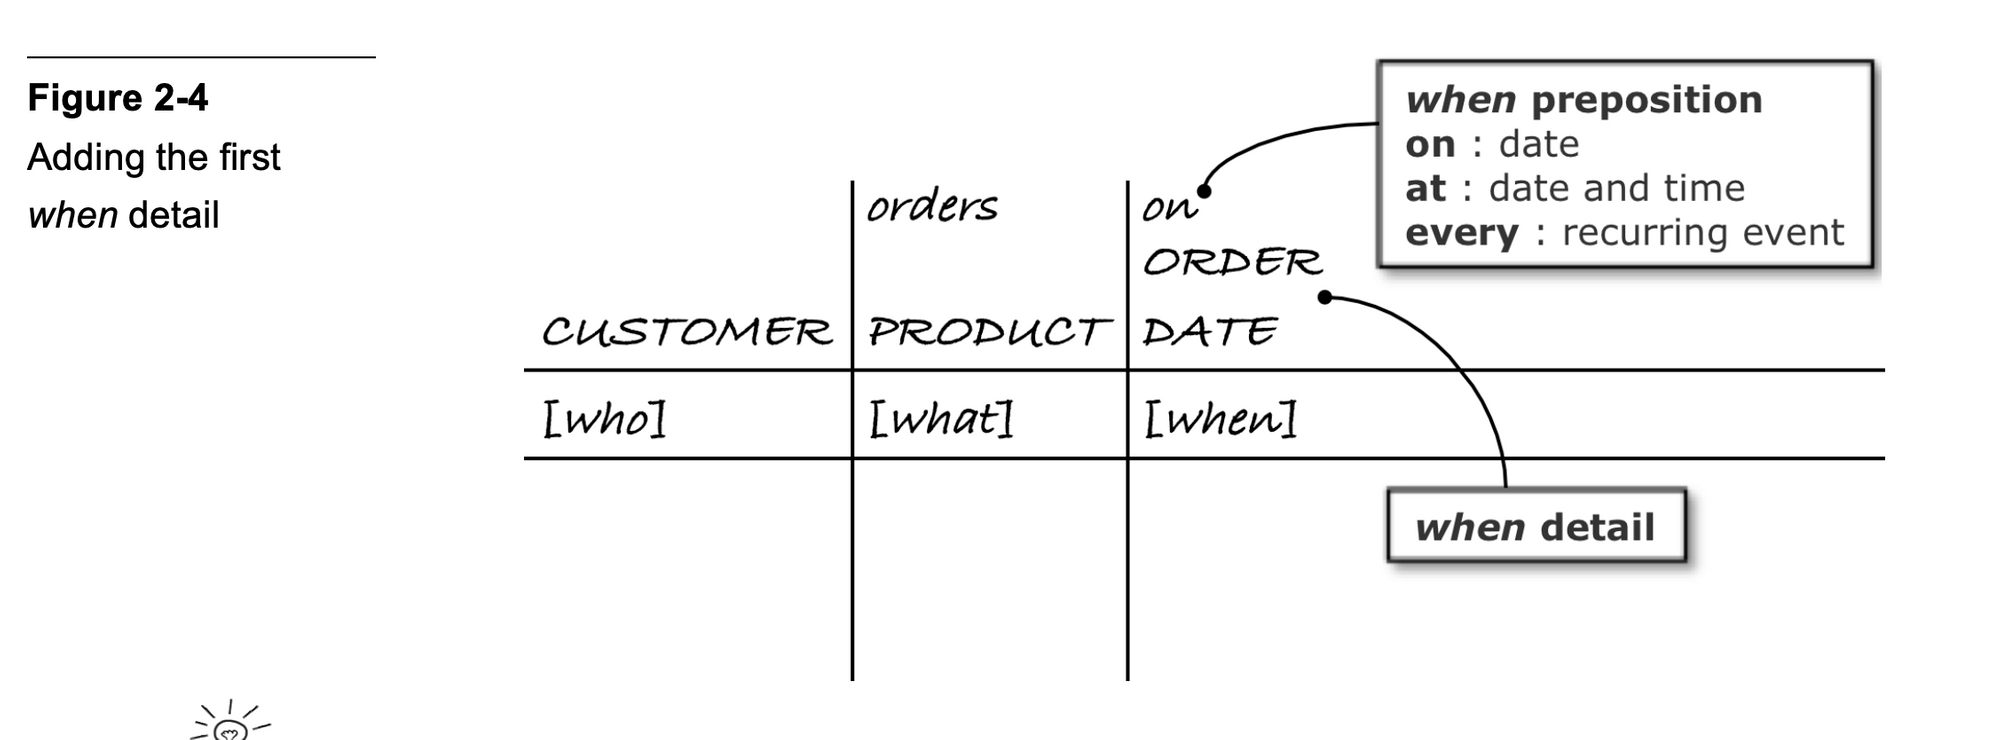
1) You ask “who does what?” These are the first two Ws. This will elicit a response like “customer orders a product!” You start a BEAM✲ table with this information.
2) You then ask a ‘when question’ — which is another way of saying ‘how often does this event occur in the business?’ This will tell you what type of data story you’re dealing with.
BEAM✲ classifies business events into three types of stories:
- Discrete — think: point of sale transactions or website visits — essentially, a business event that completes the moment they occur.
- Evolving — think: an employee processes an insurance claim, or a business submits a tender offer — these are longer running, variable length processes that take a longer period to complete.
- Recurring — think: nightly inventory for a warehouse, or interest charges for a bank account — these are extremely predictable business events that occur at a fixed interval.
Why these three? Simple: because they map neatly to the three types of fact tables:
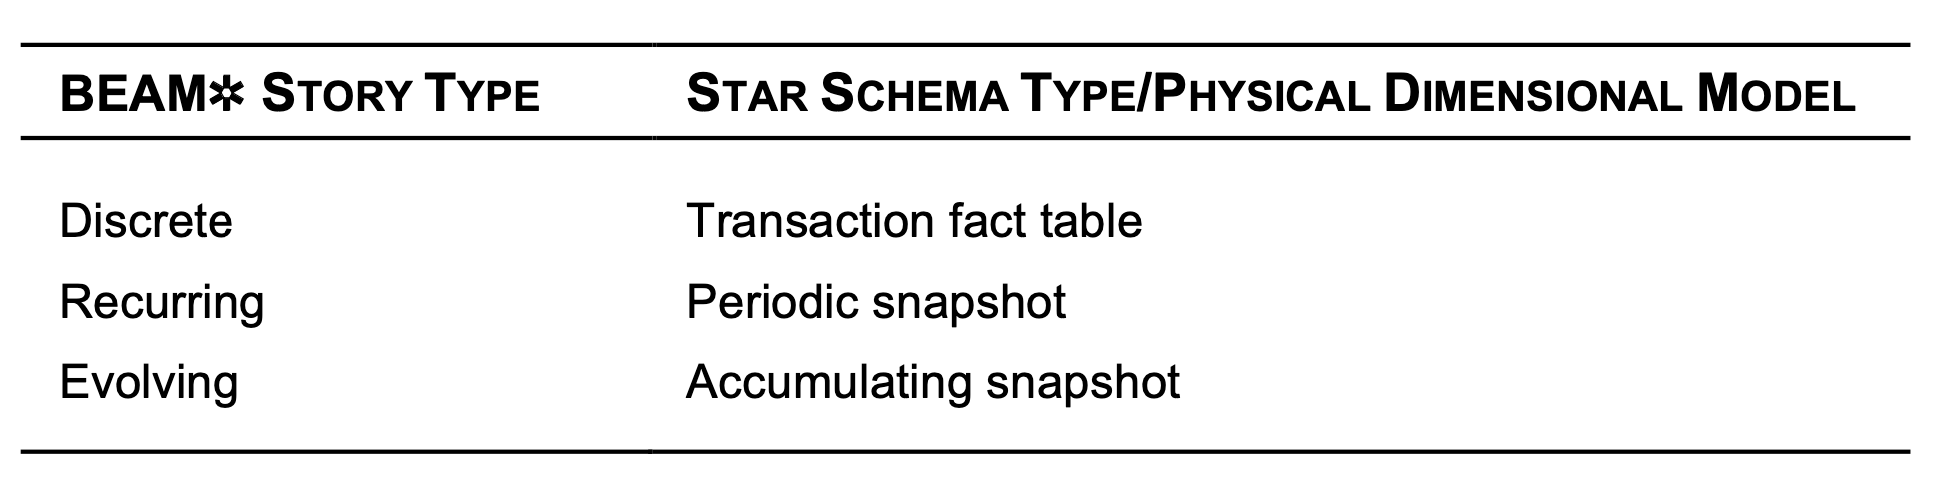
So by the 3rd W, you’ve already figured out your fact table type. You put this down in your BEAM✲ table like so:
And it’s now time to fill up your BEAM✲ with concrete examples.
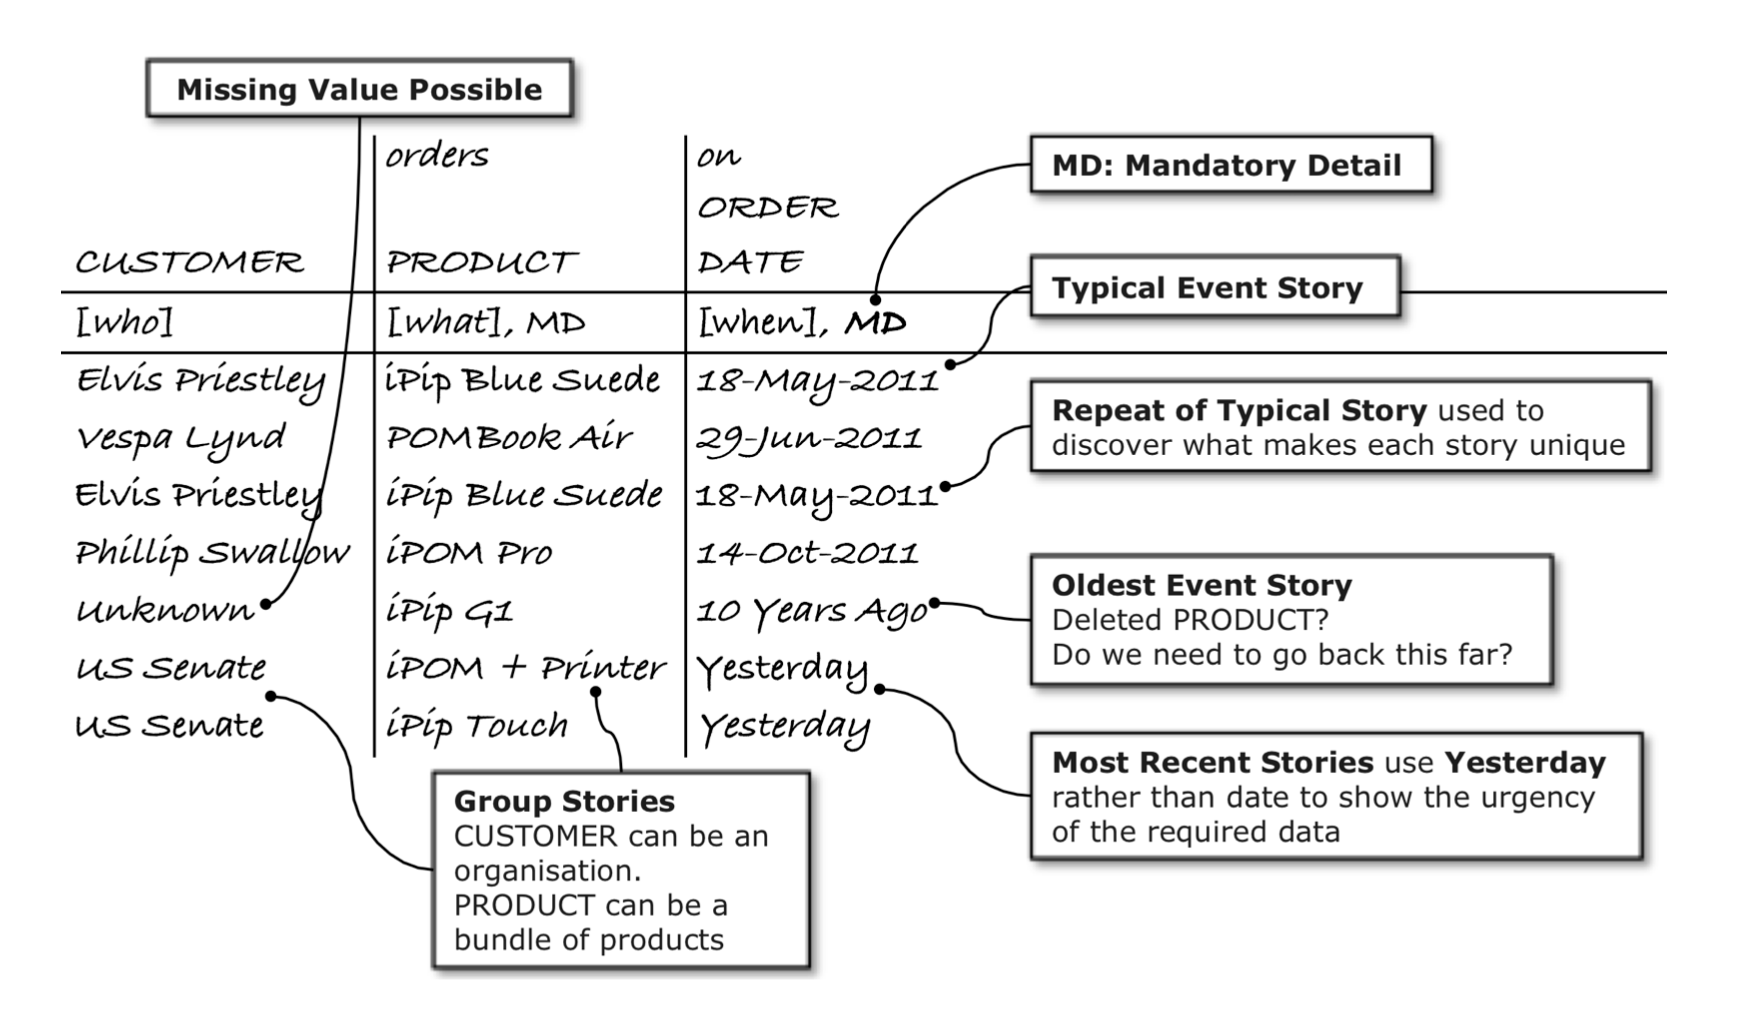
3) The next step in the 7Ws process is to fill the BEAM✲ table with event stories — that is, made-up examples of the business event that is currently being explored. These event stories are a way of eliciting all the remaining W questions (where, how many, why, how) in order to clarify each event detail as you discover them. They are also useful for identifying edge cases and wonky details (like: what if there isn’t a product name because it’s been deleted?)
The book itself contains a good example of this stage of the 7Ws exercise:
The authors then go into some detail on how to double back up the 7W flow, how to think about various follow-up questions, and various other gotchas that may come up in the process of modelstorming. I’m going to skip over most of it, since the idea here is to give you a taster of the process, not to summarise the book in its entirety.
The big, meta level approach, however, is to do all of this ‘just-in-time’ — never too far ahead of the actual reports you need to produce. You should schedule modelstorming sessions for small, bite-size data modeling implementations, with the intention of getting to value quickly. Agile Data Warehouse Design also argues that — with time — the entire team will learn to run through the 7W workflow within mere minutes, so you may rapidly cover multiple data stories in a single sitting. The book also recommends doing this with a BEAM✲ table spreadsheet projected onto a meeting room screen (or Zoom presentation, presumably) for easier collaboration.
How Does This Fit Into The Modern Landscape?
The preview that I’ve given you is literally how most of the book ‘feels’. Of course, the authors flesh out the 7Ws process in the latter chapters — they talk about how to unearth thorny data modeling problems like late-arriving facts/dimensions, how to identify slowly changing dimensions from stories, and how to approach the overall data warehousing project. In addition to the BEAM✲ table, there are a total of four other diagram types — of which one (the ‘event matrix’) is the “single most powerful BEAM✲ artifact”, since it is used to storyboard the entire data warehouse.
I’ve left those details and diagrams out of this post because a serious practitioner would want to buy the book and try these techniques out for themselves. Unlike Kimball and Ross’s The Data Warehouse Toolkit, Agile Data Warehouse Design is succinct and easy to follow. An appropriately caffeinated reader should be able to finish the first five chapters in two sittings … and then immediately begin to put things to practice.
(The latter chapters contain common design patterns, and may be used as a reference, or at least left till later.)
So how does Agile Data Warehouse Design fare in the modern data landscape?
I think the answer to this is clear: if you must do Kimball-style data modeling today, it’s probably a good idea to give Corr and Stagnitto’s techniques a try. Their approach of ‘fast, rapid modeling cycles’ is likely the right approach to take, and their creative use of diagrams (plus their liberal use of shorthand) means that it’s relatively easy to get stakeholders to adopt their techniques. I get the impression that Agile Data Warehouse Design is a solid step up from the ideas of Data Warehouse Toolkit: while the latter book describes what a proper data model should look like, the former describes how to get there quickly.
We don’t yet use Corr and Stagnitto’s techniques in Holistics — and I wonder if it’s worth trying. Two things give me pause.
First, in our Analytics Setup Guidebook, I described an example where we took our Snowplow data and piped it directly to our BigQuery data warehouse. We did very little Kimball-style modeling, and chose instead to build lightweight models on top of the fat fact tables that Snowplow gave us. We argued:
Notice how sparingly we’ve used Kimball-style dimensional data modeling throughout the example, above. We only have one dimension table that is related to dbdocs (the aforementioned dbdoc.org table). As of right now, most dimensional data is stored within the Snowplow fact table itself.
Is this ideal? No. But is it enough for the reports that our marketing team uses? Yes, it is.
The truth is that if our current data model poses problems for us down the line, we can always spend a day or two splitting out the dimensions into a bunch of new dimension tables according to Kimball’s methodology. Because all of our raw analytical data is captured in the same data warehouse, we need not fear losing the data required for future changes. We can simply redo our models within Holistics’s data modeling layer, set a persistence setting, and then let the data warehouse do the heavy lifting for us.
Arguably, the fastest iteration cycle for a data modeling project is no iteration cycle — that is, to do little-to-no data modeling up-front. For many reports, we simply dump the raw data into a data warehouse, and generate reports from lightweight models (that are more akin to ‘views’) within Holistics itself, without much care for achieving a perfect star schema. If modeling into a proper dimensional data model is necessary down the line, we believe we can simply redo our approach — at the cost of perhaps one or two days of work.
I’d like to think that Corr and Stagnitto would agree with this approach. In a sense, this is the principle of ‘just-in-time’ taken to an extreme — and only made possible by the power we have available to us with modern MPP columnar data warehouses. We think we can defer a ‘modelstorming’ session till much later in the reporting process, and we think the costs of redoing our reports to use a proper Kimball-style star schema is acceptable when seen in this light.
(Whether this is true for you is only something you can decide — I will admit that our reporting requirements are relatively simple, compared to, say, customers who must maintain large accumulating snapshot fact tables for some production process.)
The second thing that gives me pause is that a ‘modelstorming’ meeting seems rather heavy for some of the reports we seek to generate. Assuming — as per legendary CEO Andy Grove’s formula — that an hour of a manager’s time is worth $100 an hour, then an hour-long modelstorming session with two business stakeholders might well cost the business $200. Is this worth it? Possibly. But it really depends on the business process you’re measuring.
When all that’s said and done, however, Agile Data Warehouse Design is well worth your time to read. My recommendation is to read skim Chapter 1, then read Chapters 2 through 5. Then put those ideas to practice immediately. Corr and Stagnitto have done a wonderful job taking the ideas of agile and applying them to Kimball’s data modeling. We should thank them for doing so.

Staff writer at Holistics. Enjoys Python, coffee, green tea, and cats. I'd love to talk to you about the future of business intelligence!