The Three Types of Fact Tables
A concise tour of one of the basic components of Kimball dimensional data modeling. We explore the three types of fact tables, and then analyze why they have lasted the test of time.

Ralph Kimball’s dimensional data modeling defines three types of fact tables. These are:
- Transaction fact tables.
- Periodic snapshot tables, and
- Accumulating snapshot tables.
In this post, we’re going to go through each of these types of fact tables, and then reflect on how they’ve not changed in the years since Kimball last updated the Data Warehouse Toolkit. If you’re familiar with these three categories of fact tables, jump ahead to the analysis at the end; if you’re not, consider this a concise romp through one of the basic components of Kimball-style data modeling.
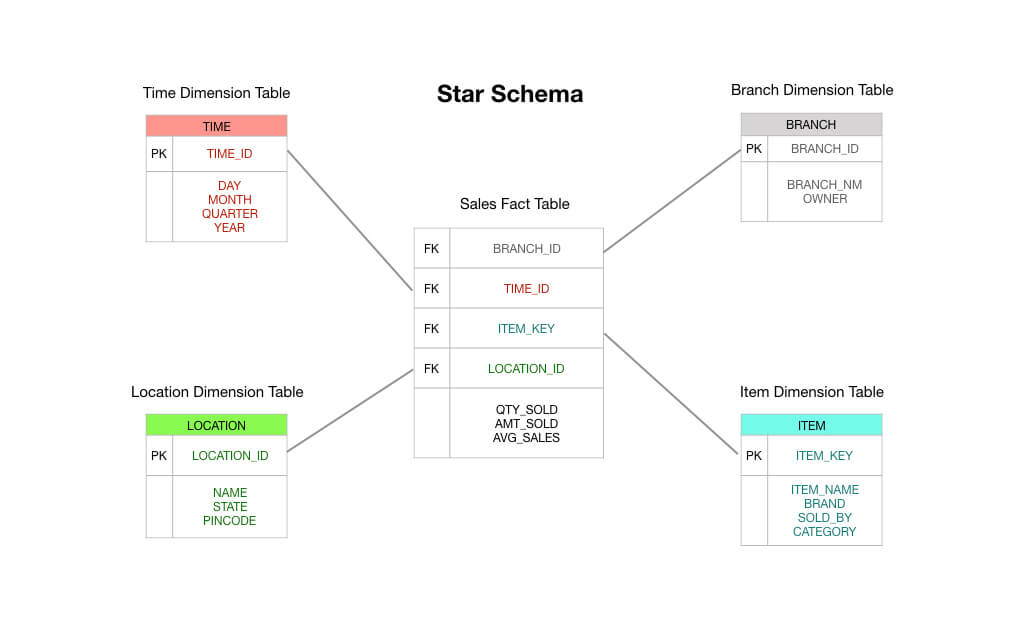
Two quick notes before we begin: first, this piece assumes familiarity with the star schema. Read this if you need a primer — I’m going to assume that you understand fact and dimension tables as a bare minimum. Second, I will note that Kimball recognises a fourth type of fact table — the timespan fact table — but it’s only used for special circumstances. We’ll leave that out of our discussion here.
Transaction Fact Tables
Transaction fact tables are easy to understand: a customer or business process does some thing; you want to capture the occurrence of that thing, and so you record a transaction in your data warehouse and you’re good to go.
This is best illustrated with a simple example. Let’s imagine that you’re running a convenience store, and you have an electronic point of sales (POS) system that records each sale that you make.
In a typical Kimball-style star schema, the fact table that is at the centre of your schema would consist of order transaction data. These are primarily numeric measures like order total, line item amounts, cost of goods sold, discount amounts applied, and so on.
And so you can see that a transaction fact table is exactly as it says on the tin: you receive a transaction, you record the transaction in your fact table, and this becomes the basis of your reporting. In many ways, a transaction fact table is the default type of fact table that we’re used to thinking about.
Periodic Snapshot Tables
Periodic snapshot fact tables are a logical extension to the plain vanilla fact tables we’ve just covered above. A row in a periodic snapshot fact table captures some sort of periodic data — for instance, a daily snapshot of financial metrics, or perhaps a weekly summary of accounts receivable, or a monthly tally of inventory numbers.
In other words, the ‘grain’ or ‘level of resolution’ is the period, not the individual transaction. Note that if no transactions occur during a certain period, a new row must be inserted into the periodic snapshot table, even if every fact that is saved is a null!
Periodic snapshot tables tend to contain an incredibly large number of fields. This is because any reasonably interesting metric may be shoved into the period table. You can sort of imagine a scenario where you start out with aggregated sales, revenue, and cost of good sold on a weekly period, but as time goes by, management asks you to add other facts like inventory levels, account payable metrics, and other interesting measurements.
Why are periodic snapshot tables useful? Well, this is fairly straightforward to imagine. If you want to have an overview of the trend lines in the key performance indicators in your business, it helps to query against a periodic fact table.
Accumulating Snapshot Tables
Unlike periodic snapshot tables, accumulating snapshot tables are a little harder to explain. To understand why Kimball and his peers came up with this approach, it helps to understand a little about the kinds of questions that were being asked of business in the 90s, which was when the Data Warehouse Toolkit was first written.
In the late 80s, Japanese manufacturers began to beat their American counterparts on all sorts of nasty but non-obvious ways. Chief amongst this was a focus on execution speed.
Manufacturing can be seen as a series of steps. You take raw material on one end of the factory, and turn it into cars and phones and widgets out the other end. Each step of the manufacturing process can be measured — how long does it take to turn steel blocks into steel pellets, for instance? How long do they wait in factory inventory? And from there, how long before the pellets are fabricated into automobile parts? How long before they are used in actual automobiles?
In the late 70s, Japanese companies began to realise this ‘series of steps’ view of value creation could lead to a serious competitive advantage if they reduced the lag time between each step. More concretely: if they could cut down the number of steps taken to produce each item and if they could reduce the length of time spent within each step, Japanese manufacturers learnt that they could reduce material waste, lower defect rates and cut delivery time, while at the same time increase worker productivity, raise manufacturing volume, expand product variety and cut prices — all at the same time.
By the time the 90s came around, Western companies had caught on. A number of management consultants — chief amongst them George Stalk Jr of the Boston Consulting Group — began championing execution tempo as a source of competitive advantage. These consultants instructed companies to record the time spent at each step of the production process. When an order came in, how long did it wait to be processed? After it was processed, long before the order was sent to the factory? At the factory, how long before the product was completed? And then how long did it wait in inventory? And finally, how long did it take before the customer received the product and got value from it?
Businesses in the 90s were thus pressured into measuring lag times throughout their entire business delivery process. They were forced to do this because Japanese competitors were making inroads into many industries previously dominated by Western companies — in some cases, causing bankruptcies and disrupting whole supply chains. It was in this environment that Kimball was working.
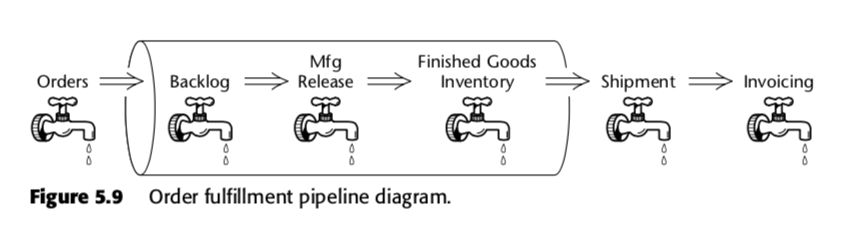
The accumulating snapshot fact table is thus a method to measure velocity within the business process. Take, for instance, this business pipeline, which Kimball presented in the second edition of The Data Warehouse Toolkit:
For that process, Kimball proposed the following accumulating snapshot table:
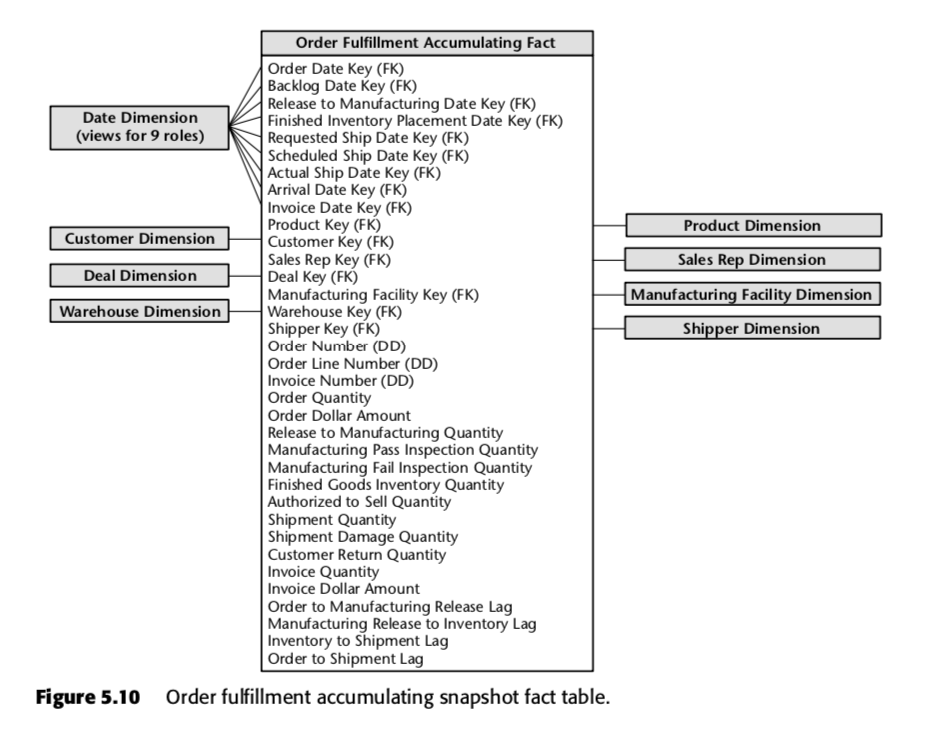
Each row in this table represents an order or a batch of orders. Each of these rows are expected to be updated multiple times as they proceed through the order fulfilment pipeline. Notice in particular the sheer number of date fields at the top of the schema. When a row is first created in this table, the majority of these dates will start out as nulls, but would eventually be filled up as time passes. (Note: Kimball uses a date dimension table here, instead of the built-in SQL date data type, because doing so is The Kimball Way ™ — it allows you to capture more information about dates than just the naive date types.)
Also important are the fields at the bottom of that list. Each of them measures a lag indicator — that is, the difference between two dates. So, for instance, Order to Manufacturing Release Lag is the time taken from Order Date to Release to Manufacturing Date; Inventory to Shipment Lag is the time taken from Finished Inventory Placement Date to Actual Ship Date, and so on. As time passes, each of these dates will be filled in by an ERP system or perhaps by a data entry grunt. The lag times for each particular order would thus be calculated as each field is filled in.
You can see how such a table would be useful to a company operating within a time-based competitive environment. Using a single table, management would be able to see if the lag times in its production are increasing or decreasing over time. They can use such business intelligence to determine which steps are the most problematic in their production process. And they can take action on the bits that are most worrying to them.
Side note: these ideas have been adapted to the software world under the terminology of ‘lean’; for more information about measuring production within tech companies, check out our posts about the book Accelerate here and here.
Why Have They Not Changed?
It’s a testament to Kimball and his peers that the three types of fact tables have not changed materially since they were first articulated in 1996.
Why is this the case? The answer, I think, lies in the fact that the star schema captures something fundamental about business. If you model your data to match your business processes, you’re pretty much going to capture fact data in one of three ways: via transactions, with collated periods, and — if your business is savvy enough about time-based competition — by measuring the lag times between each step of your value delivery system.
Kimball himself says something similar. In a 2015 blog post, he writes:
Rather than getting hung up on religious arguments about logical versus physical models, we should simply recognize that a dimensional model is actually a data warehouse applications programming interface (API). The power of this API lies in the consistent and uniform interface seen by all observers, both users and BI applications. We see that it doesn’t matter where the bits are stored or how they are delivered when an API request is launched.
The star schema is time-tested. This much is obvious.
In the same post, Kimball then goes on to argue that even recent innovations like the columnar data warehouse have not changed this fact; the majority of companies he talks to still end up with a dimensional model structure at the end of the day.
But things have changed. Peppered throughout the Data Warehouse Toolkit are quaint mentions of ‘limiting the number of facts per table’, and ‘planning your data modeling strategy with all domain stakeholders present at the meeting’. These do not reflect what we are seeing in practice at our company, and in the data departments of our customers.
The biggest change is the speed at which current technologies enable us to shift from ‘naive fact table’ to ‘Kimball-style dimensional model’ — which allows us to skip the practice of up-front modeling, and instead opt to model as little as we need to. This practice is enabled by a number of technological changes that we’ve discussed on this blog before (most notably, in our post about The Rise and Fall of the OLAP Cube) but the practical implications on our use of fact tables are as follows:
- Transaction fact tables — we are perfectly happy to have fat fact tables, with dozens if not hundreds of facts per row! That is not to say that this is an ideal situation, merely that it is a very acceptable compromise. Unlike in Kimball’s time, data talent today is prohibitively expensive; storage and compute time is cheap. So we are perfectly ok with leaving certain fact tables as they are — in fact, we have several with more than 100 fields in them, piped in straight from our source systems! Our philosophical stance is: if we have complex reporting requirements, then it is worth it to take the time and model the data properly. But if the reports we need are simple, then we take advantage of the computational power available to us and leave the fact tables as they are.
- Periodic snapshot fact tables — it’s surprising how much we’re able to avoid doing this. Because modern MPP columnar data warehouses are so powerful, we don’t create periodic snapshot fact tables for reports that are not as regularly used. The query execution time and additional cost it takes to generate reports from raw transaction data is perfectly acceptable, especially if we know that the report is only needed once a week or so (or made available for periodic exploration). For other datasets, we do generate periodic snapshot tables as per Kimball’s original recommendations.
- Accumulating snapshot tables — This is nearly unchanged from Kimball’s time. But — as Kimball says himself — accumulating snapshot tables are rare in practice. So we don’t give this as much thought as a more time-driven company might.
It’s important to note here that we do think modeling is important. The difference is that our practice of data analytics allows us to revisit our modeling decisions at any time in the future. How do we do this? Well, we load our raw transactional data into our data warehouse before we transform. This is known as ‘ELT’ as opposed to ‘ETL’. Because we do all of our transformations within the data warehouse, using a data modeling layer, we are able to revisit our choices and remodel our data if the need arises.
This allows us to focus on delivering business value first. It keeps the data modeling busy-work low.
But let’s not overlook the contribution here. Given all that has changed, it is remarkable how consistent and how useful Kimball’s ideas are since he first articulated them in 1996. The Data Warehouse Toolkit is a rich resource that every data analyst should mine — even if some of the recommendations no longer hold true in the presence of today’s technology.

Staff writer at Holistics. Enjoys Python, coffee, green tea, and cats. I'd love to talk to you about the future of business intelligence!