4 levels of Analytics-as-Code
How did Analytics-as-Code evolve? We explain the history behind the movement, and present the 4 levels of analytics as code over the years.
3 years ago, I first wrote about Analytics As-Code (AaC).
In that post, I spoke about the idea of applying programmatic configuration to doing analytics development: Define your analytics system once, express it as code, and put it into Git revision history.
This idea, albeit simple, brings a lot of benefits to the analytics development process:
- Reliable: it is easier to debug, test, and detect issues with analytics logic using code
- Reproducible: the whole process can be easily reproduced
- Maintainable: by putting analytics code into VCS, it is easy to track changes
- Reusable: analytics logic can be built into reusable modules/libraries
- Automated: The analytics process can now be easily automated, reducing the need to hire analytics talents.
The seed of this idea isn’t entirely new. Inspired by “infrastructure as-code” movement, the idea found its way into the analytics world, starting with Looker and their LookML language in 2010.
Since then, the idea has gradually garnered attention within the analytics community. People spoke about it at conferences, new data tools came out with analytics as-code support in mind, while old vendors rushed to patch AaC capabilities into their system.
Fast forward to 2024, AaC has become the standard offering among business intelligence tools. Features like code-based configurations, version control, and code reviews are table-stake expectations, hinting at mainstream adoption of this once-novel idea.
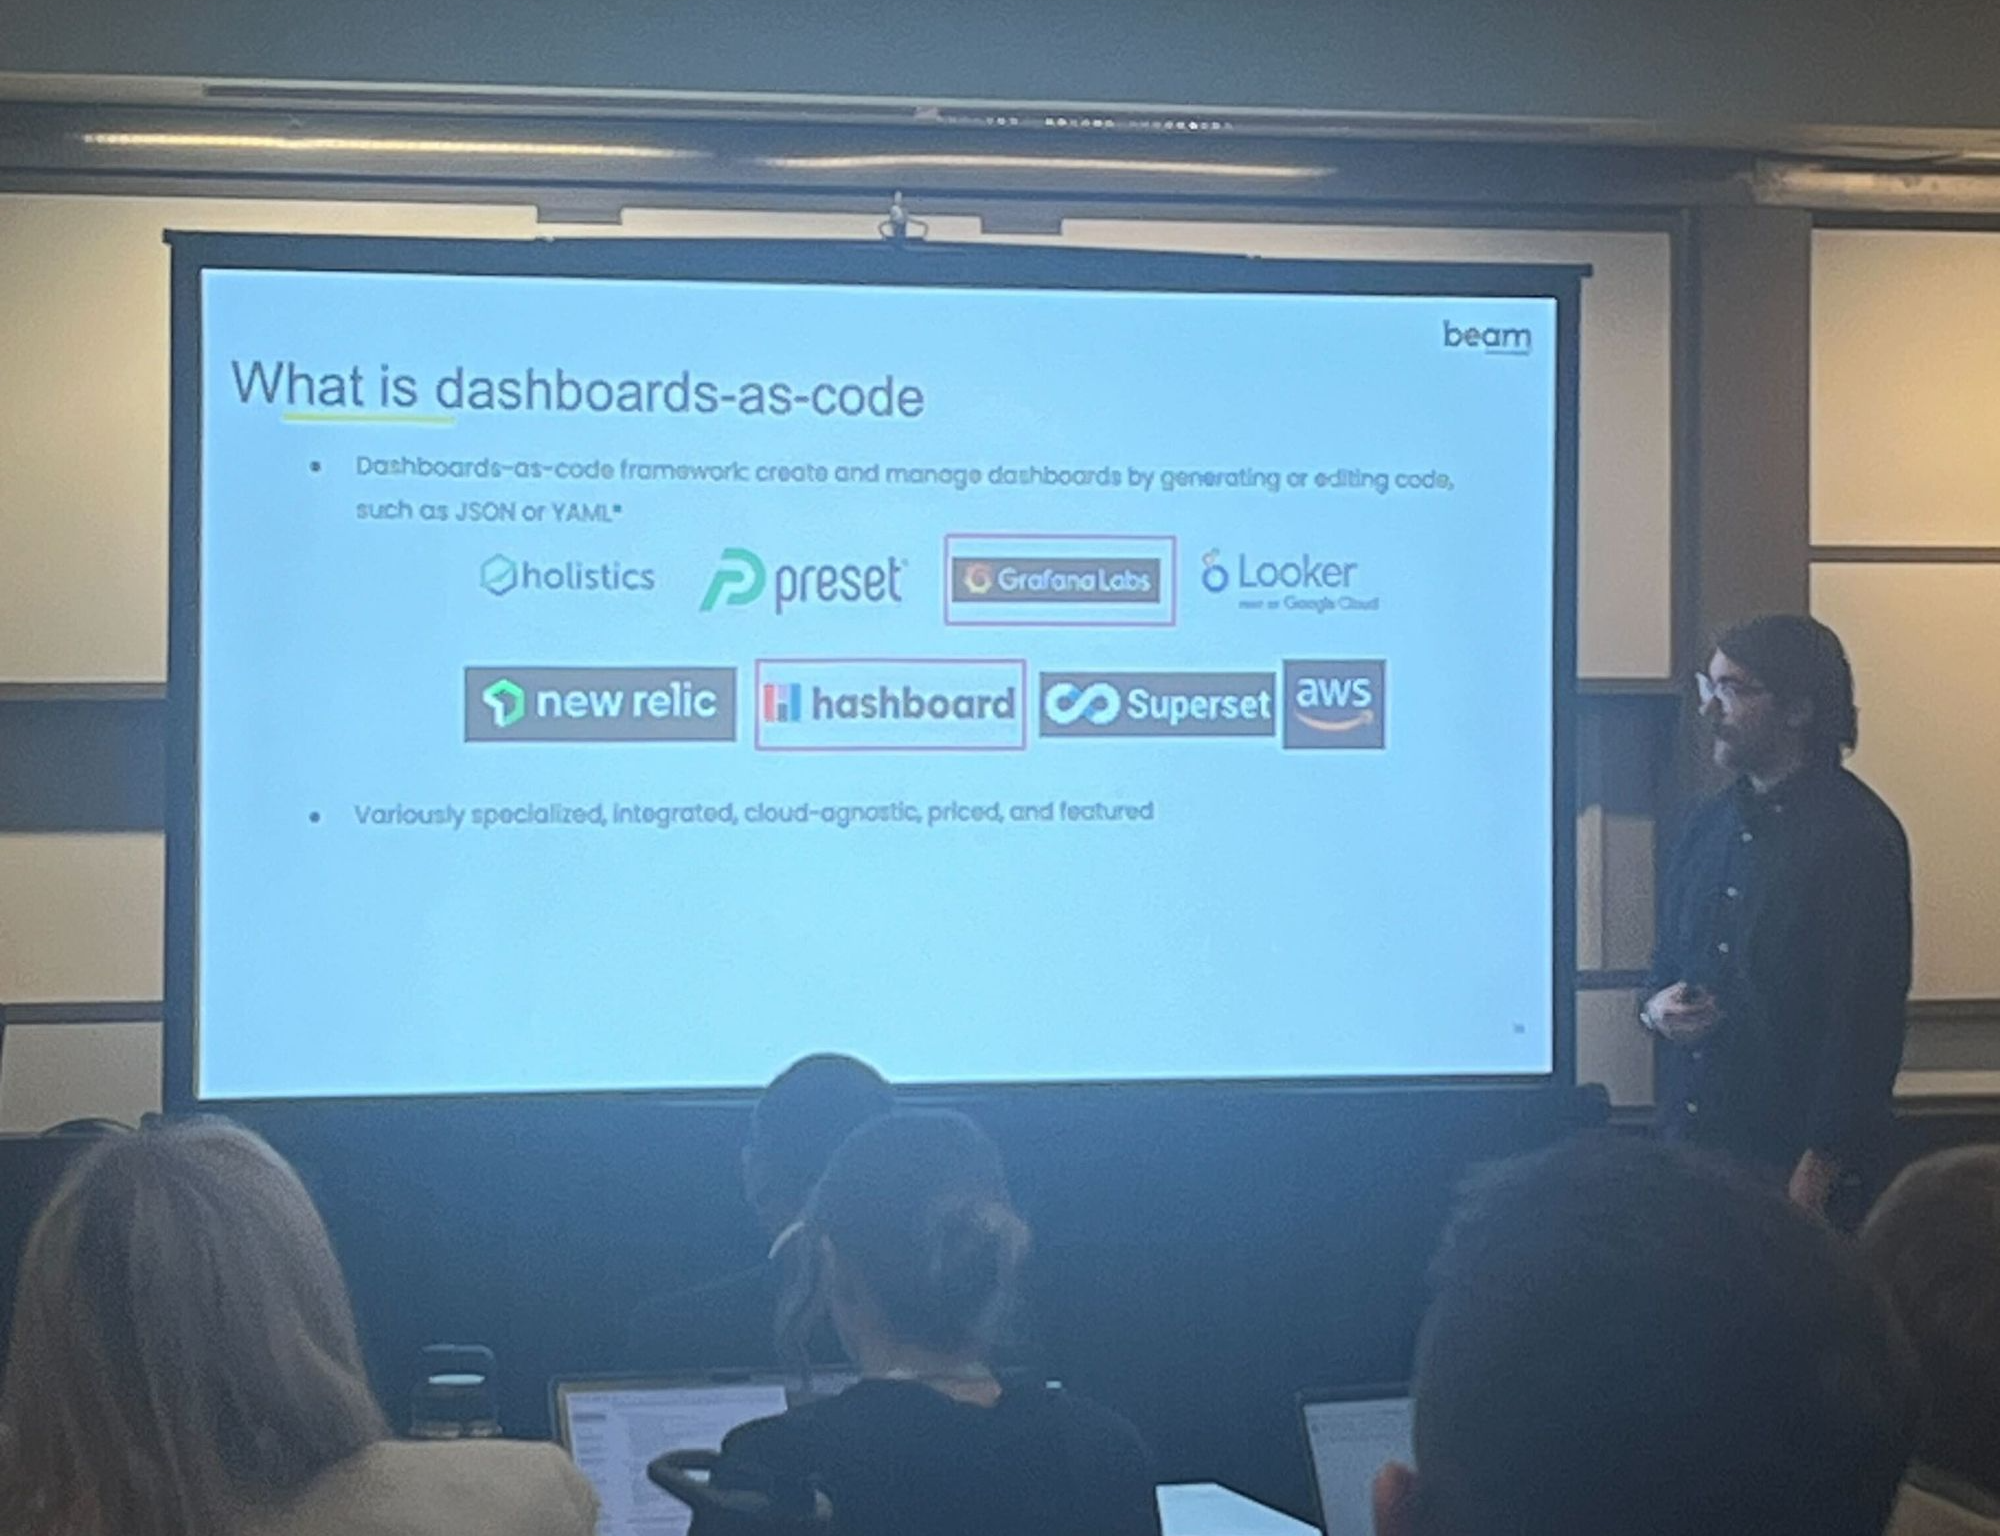 A speaker (Head of Data at Beam) spoke about dashboards-as-code at the recent Data Council conference (March 2024, Texas)
Aren't they all the same?
““Ok great, next time I’ll just pick any BI tool with analytics as-code support! It should be pretty straightforward”, you thought.
Not quite.
Turns out, not every tool supports AaC the same way.
As you evaluate these tools, questions emerge: Does it integrate natively with Git? Can I use web-based and local IDEs at the same time? How does it handle synchronization between both? How friendly is the AaC language? Does it come with autocomplete and syntax highlighting? Can I define logic once and reuse it in multiple reports? etc.
The list goes on. Soon, you realize it's rare to find an AaC solution that supports all/most of what you'd imagine a good tool should. After all, their infrastructure as-code equivalents (Ansible, Terraform, Pulimi) are pretty darn good.
There's a good reason for this lack of high-quality AaC tools: The technical effort behind building such tool is not trivial. In other words, building a good AaC tool takes a lot of engineering hardwork.
Let's dig in a little bit.
First, most softwares store metadata/reports definitions in relational databases, and integrating that seamlessly with Git version control is a tricky endeavour: Where should the source of truth be, in database or Git? How do we ensure referential integrity? How should we handle conflict resolution? etc.
Because of this, newer BI tools usually ditch database and store everything in Git. Older tools though, due to their legacy architecture and the huge effort required, often times opted for a more band-aid solution such as serializing/deserializing metadata objects into text. This made the version control experience less than ideal.
Second, building a good code-based analytics language is hard work. It is one thing to make any existing analytics tool code-configurable, it is entirely another thing to make the analytics language reusable, developer-friendly, or powerful like a typical programming language. Relying on existing markup file formats (like JSON or YAML) can only get you thus far. After that, you need to start designing your own language syntax, compiler, concepts and the whole support toolings that go with it.
In other words, analytics as-code is not "just another feature" that any vendor can build in a few weeks. To build it properly, vendors need to make it part of their strategic priority with adequate engineering resources.
Making sense of all these: The 4 levels of analytics as-code
In trying to make sense of these intricacies, we spent time studying the history/evolution of the analytics as-code movement.
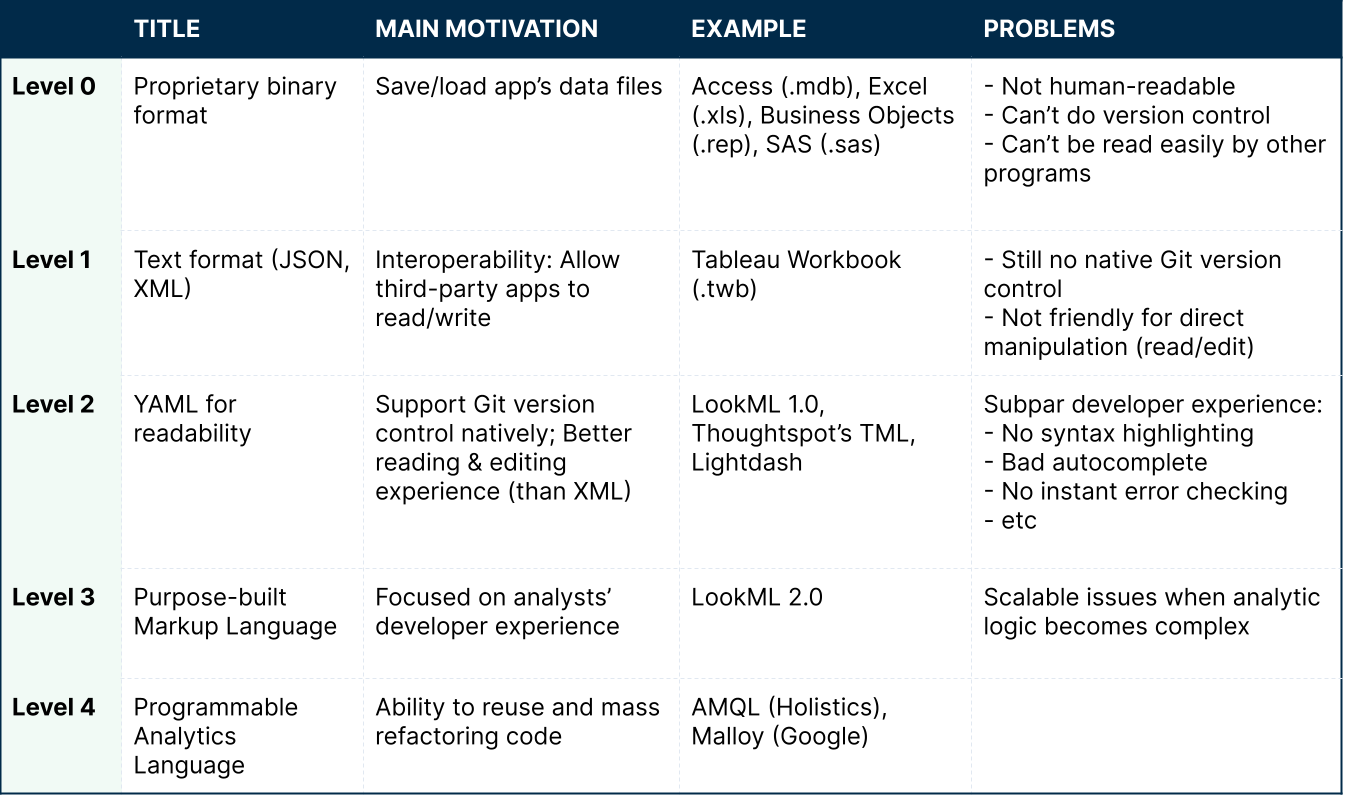
We then categorized the evolution into 4 levels (phases). Each level acts like a phase in history, where there's a clear trigger, motivation that lead to it, and each comes with its own set of problems that lead to the next level. For each level, we try to give examples of tools that best fit the level itself.
Take a deep look, let me know if this resonates with you.
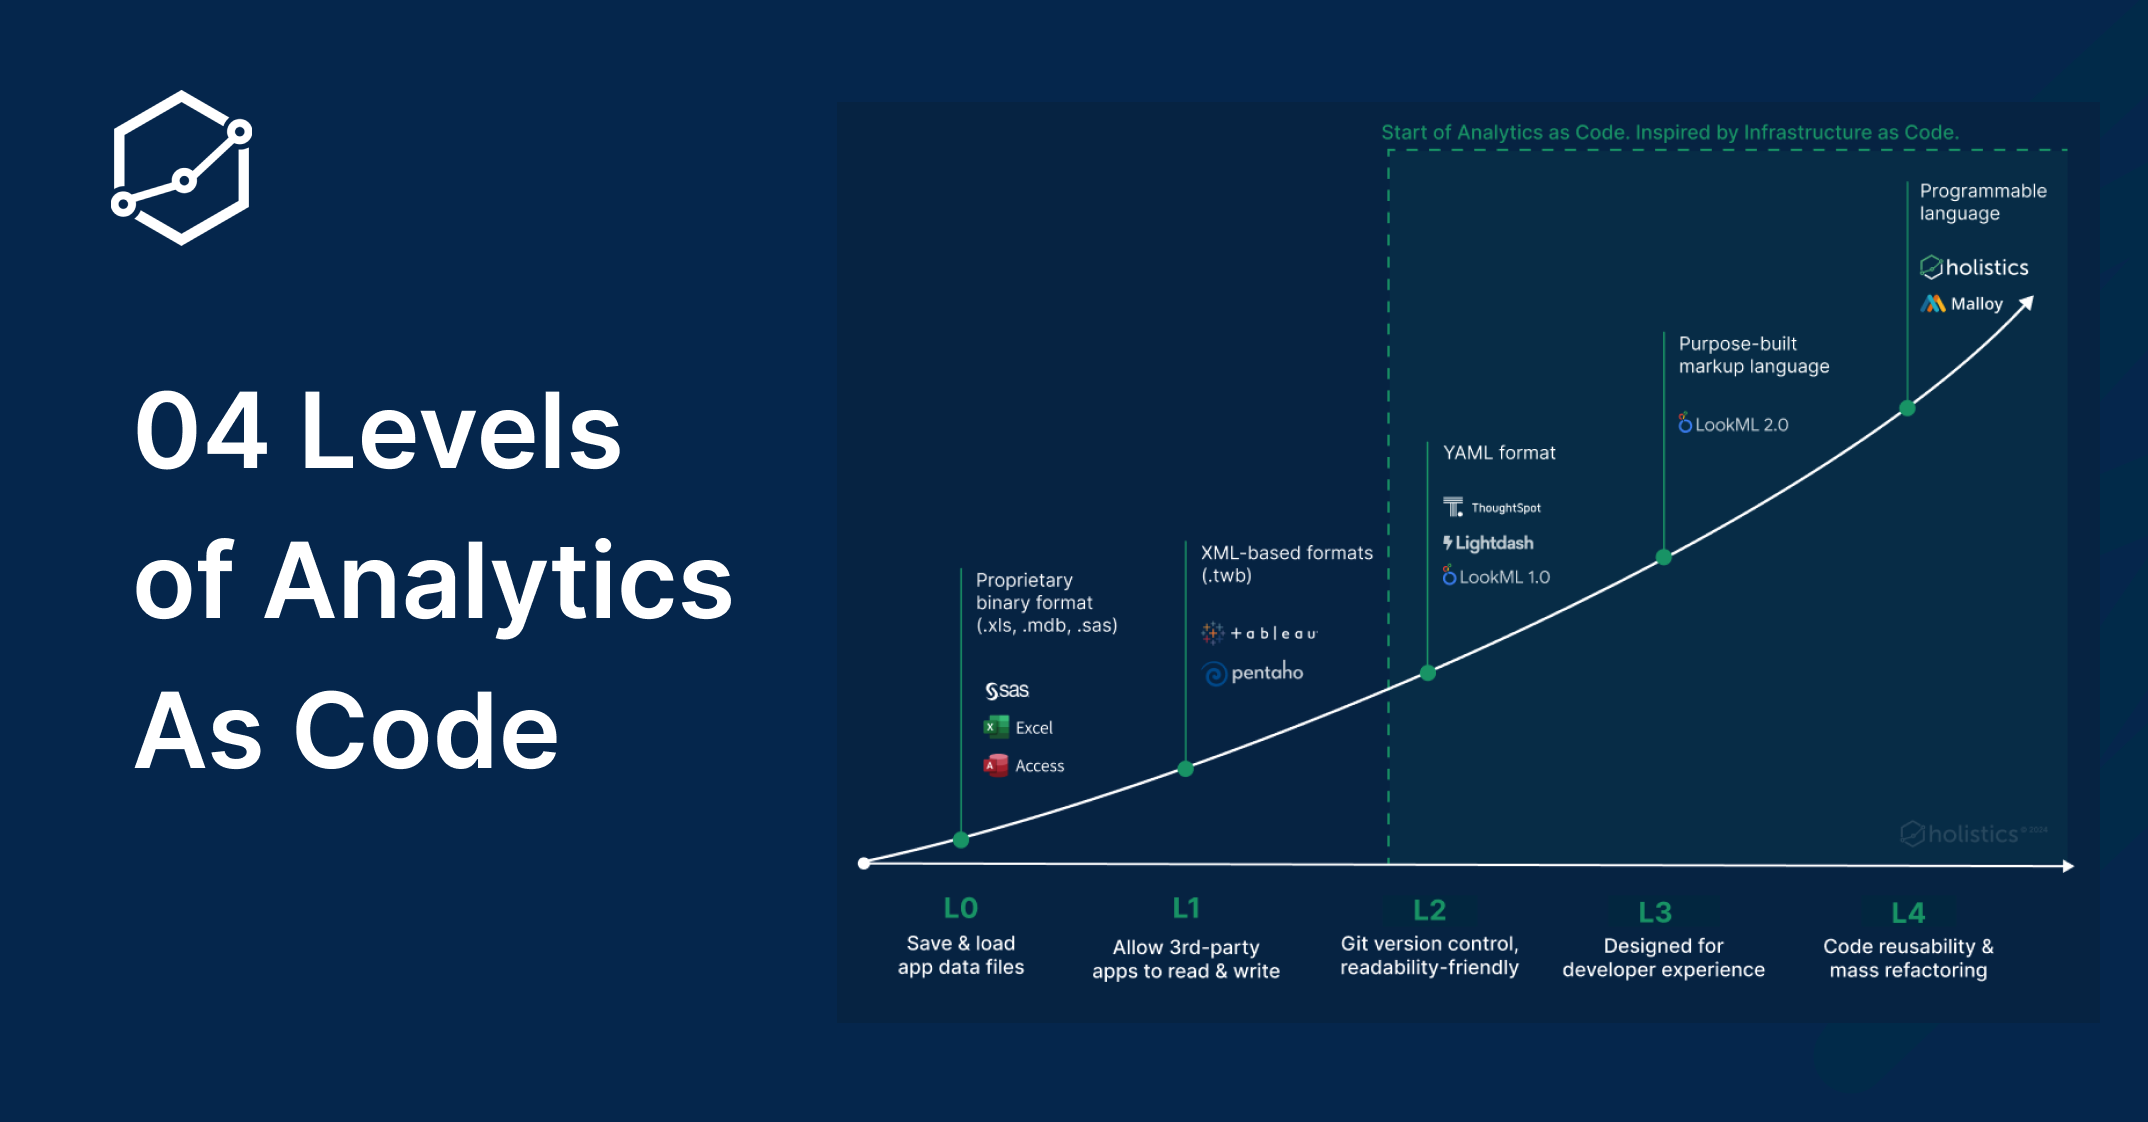
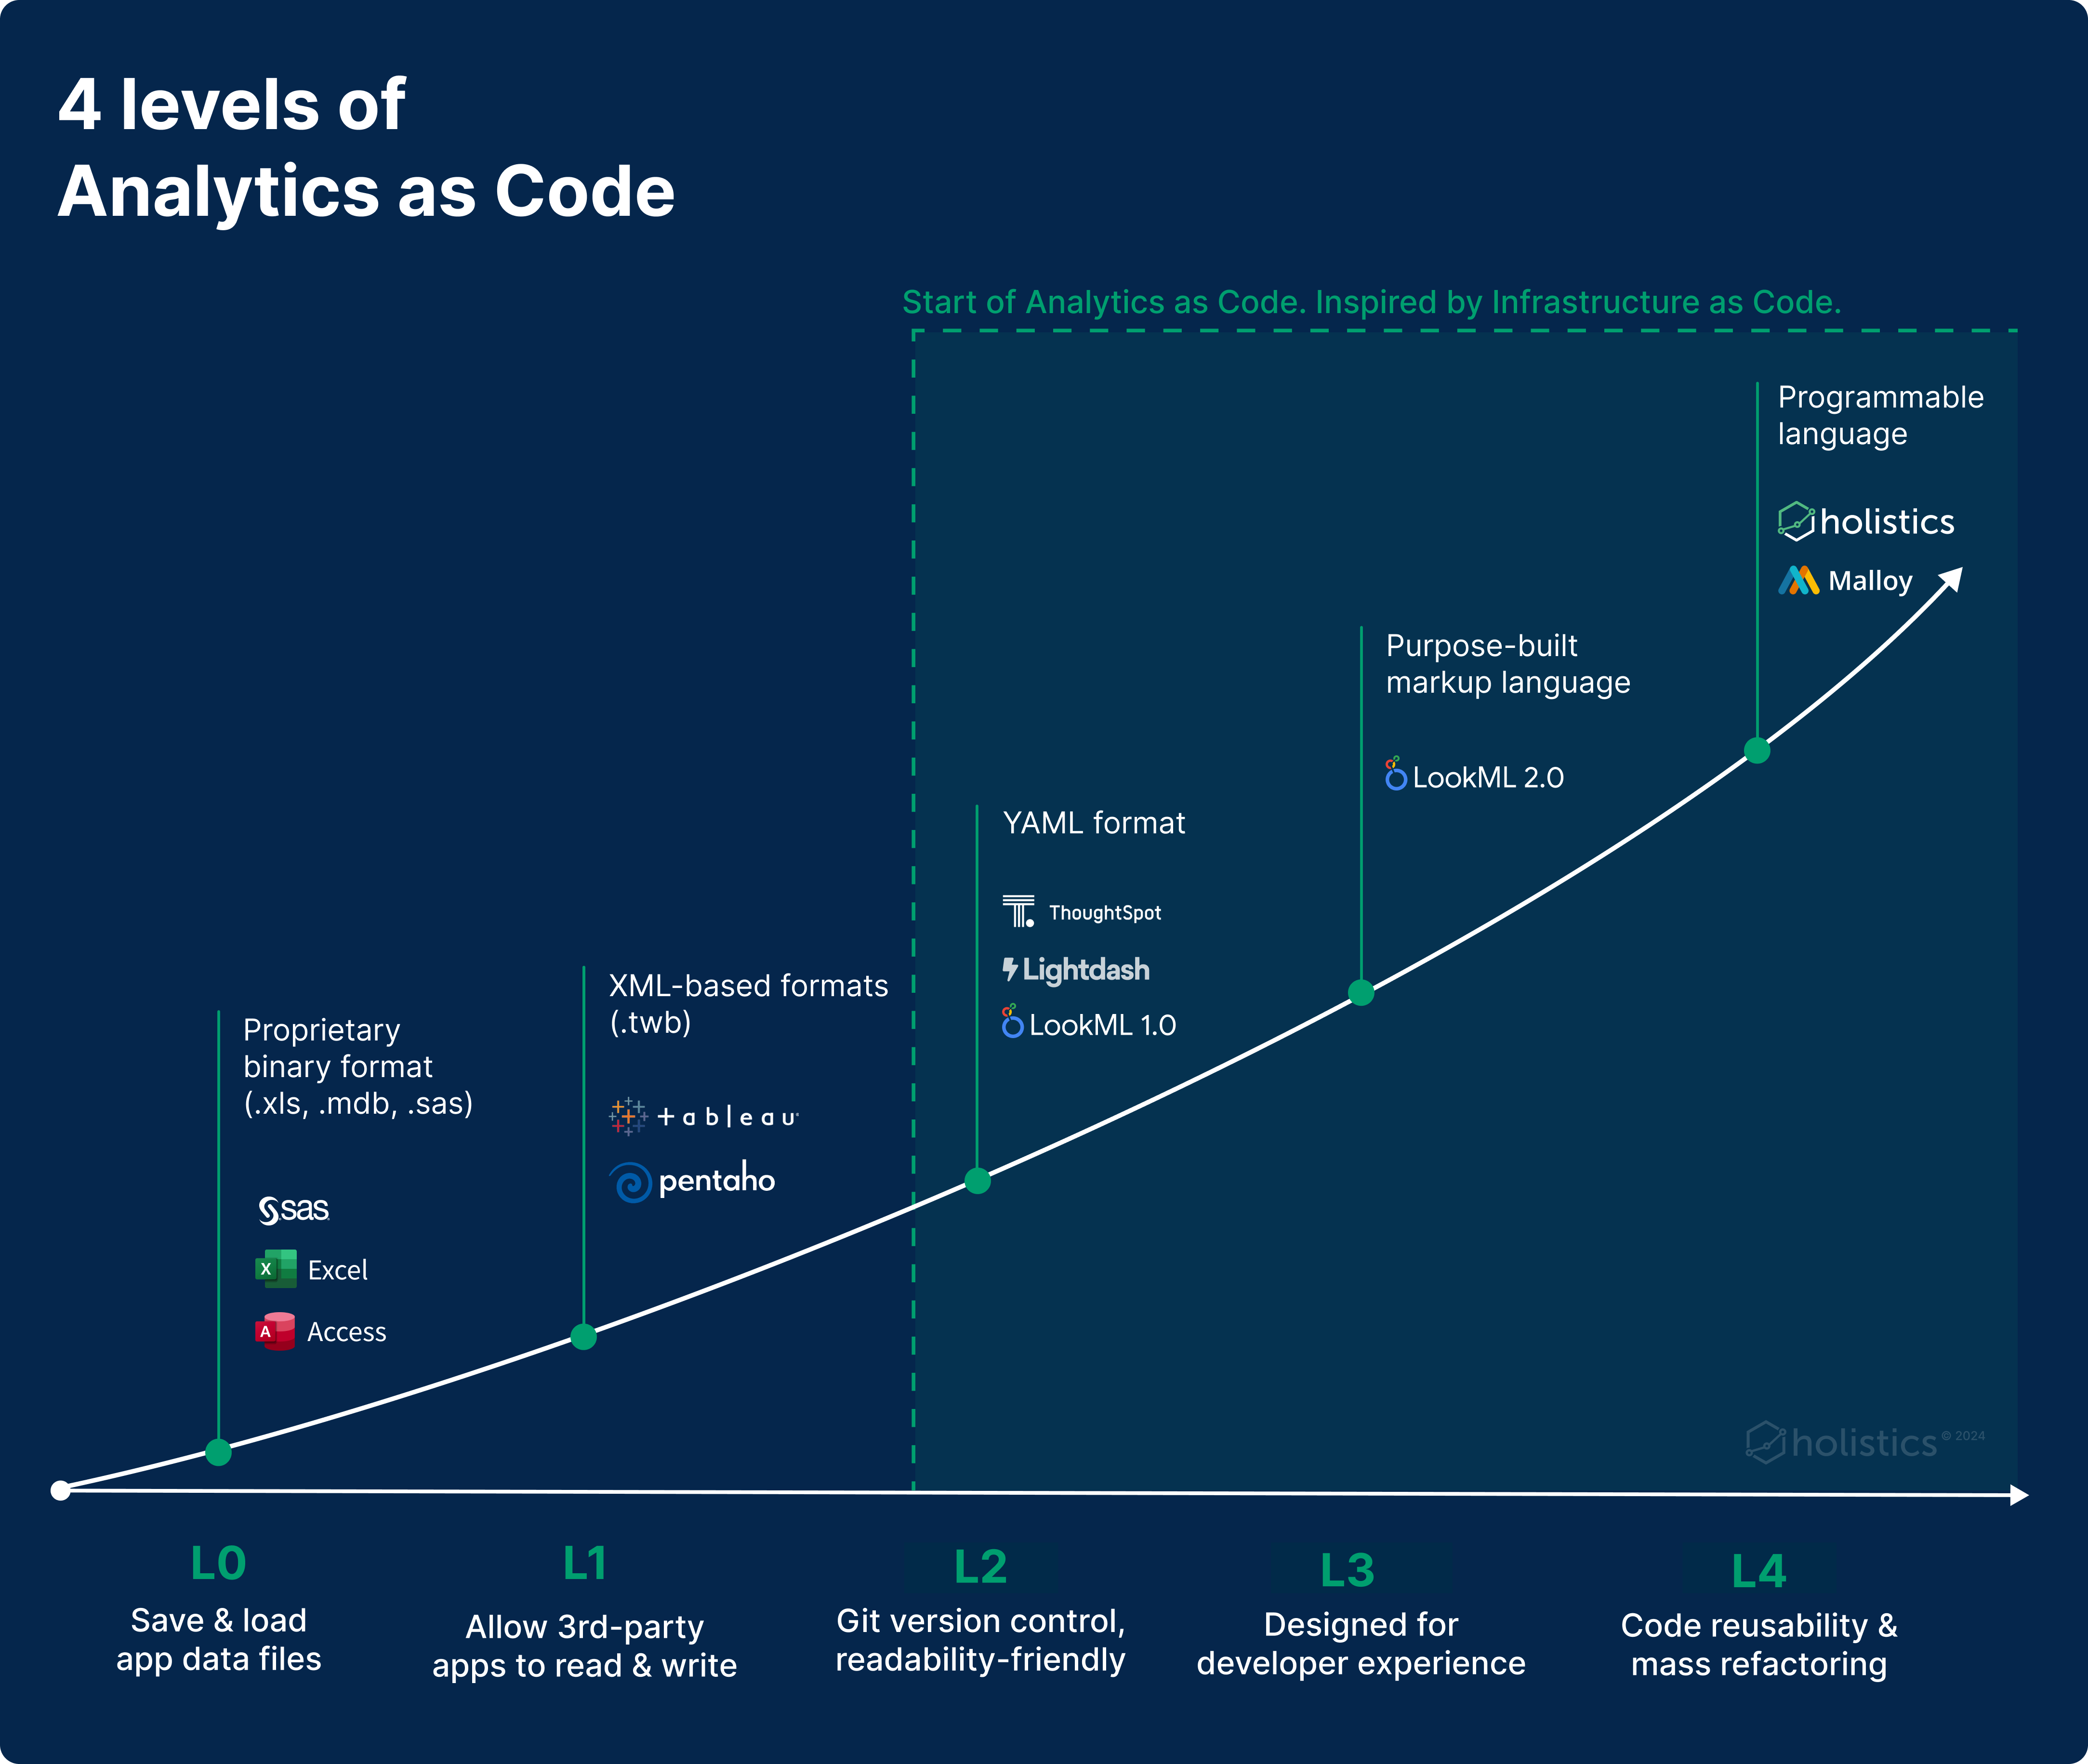 04 levels of Analytics As Code
 4 levels of Analytics As Code: A Summary
Level 0: Pre As-Code, The Proprietary Binary Format
We start with level zero where there’s no as-code at all.
This level represents the analytics software of the 80s and 90s. Reports and dashboards are stored as (proprietary) binary files. Excel (.xls), Access (.mdb), SAS (.sas) and BusinessObjects (.rep) are all binary formats.
These vendors designed their file format with a single use case in mind: Saving/loading the work into files. Using a binary format was the de facto standard at that point in time.
Because of their binary nature, these files are not human-readable. Furthermore, it’s almost impossible to do standardized version controls for these source files. Finally, writing programs to read data from these files is also difficult if you’re not associated with the company itself.
Level 1: From Binary to Text Format for Interoperability
In circa late 90s and early 2000s, XML started to become popular. It was designed to be a file format that is both human- and machine-readable, offering a standardized method for data exchange between various systems.
Microsoft Office, with its 2007 release, switched to XML-based formats (xlsx, pptx, docx) called Open Office XML (OOXML). They wanted to give third-party apps the ability to read, write, and manipulate Office files directly, hence expanding the Office ecosystem.
Soon, using text-based formats to store files became the norm, even among analytics tools founded during this era. Tableau's workbook (.twb), Pentaho (.prpt), and PowerBI (.pbix, .pbit) are all based on XML.
Despite this transition to text-based encoding of analytics logic, the concept of “Analytics As Code” as we understand it today had not yet materialized. These transitions (and formats) were still not designed with version control and direct user manipulation in mind.
While manipulating XML directly is possible, it’s not an optimal experience due to its verbosity. The extensive use of tags in XML can make it cumbersome to navigate and edit, making it less than ideal for direct user interaction.
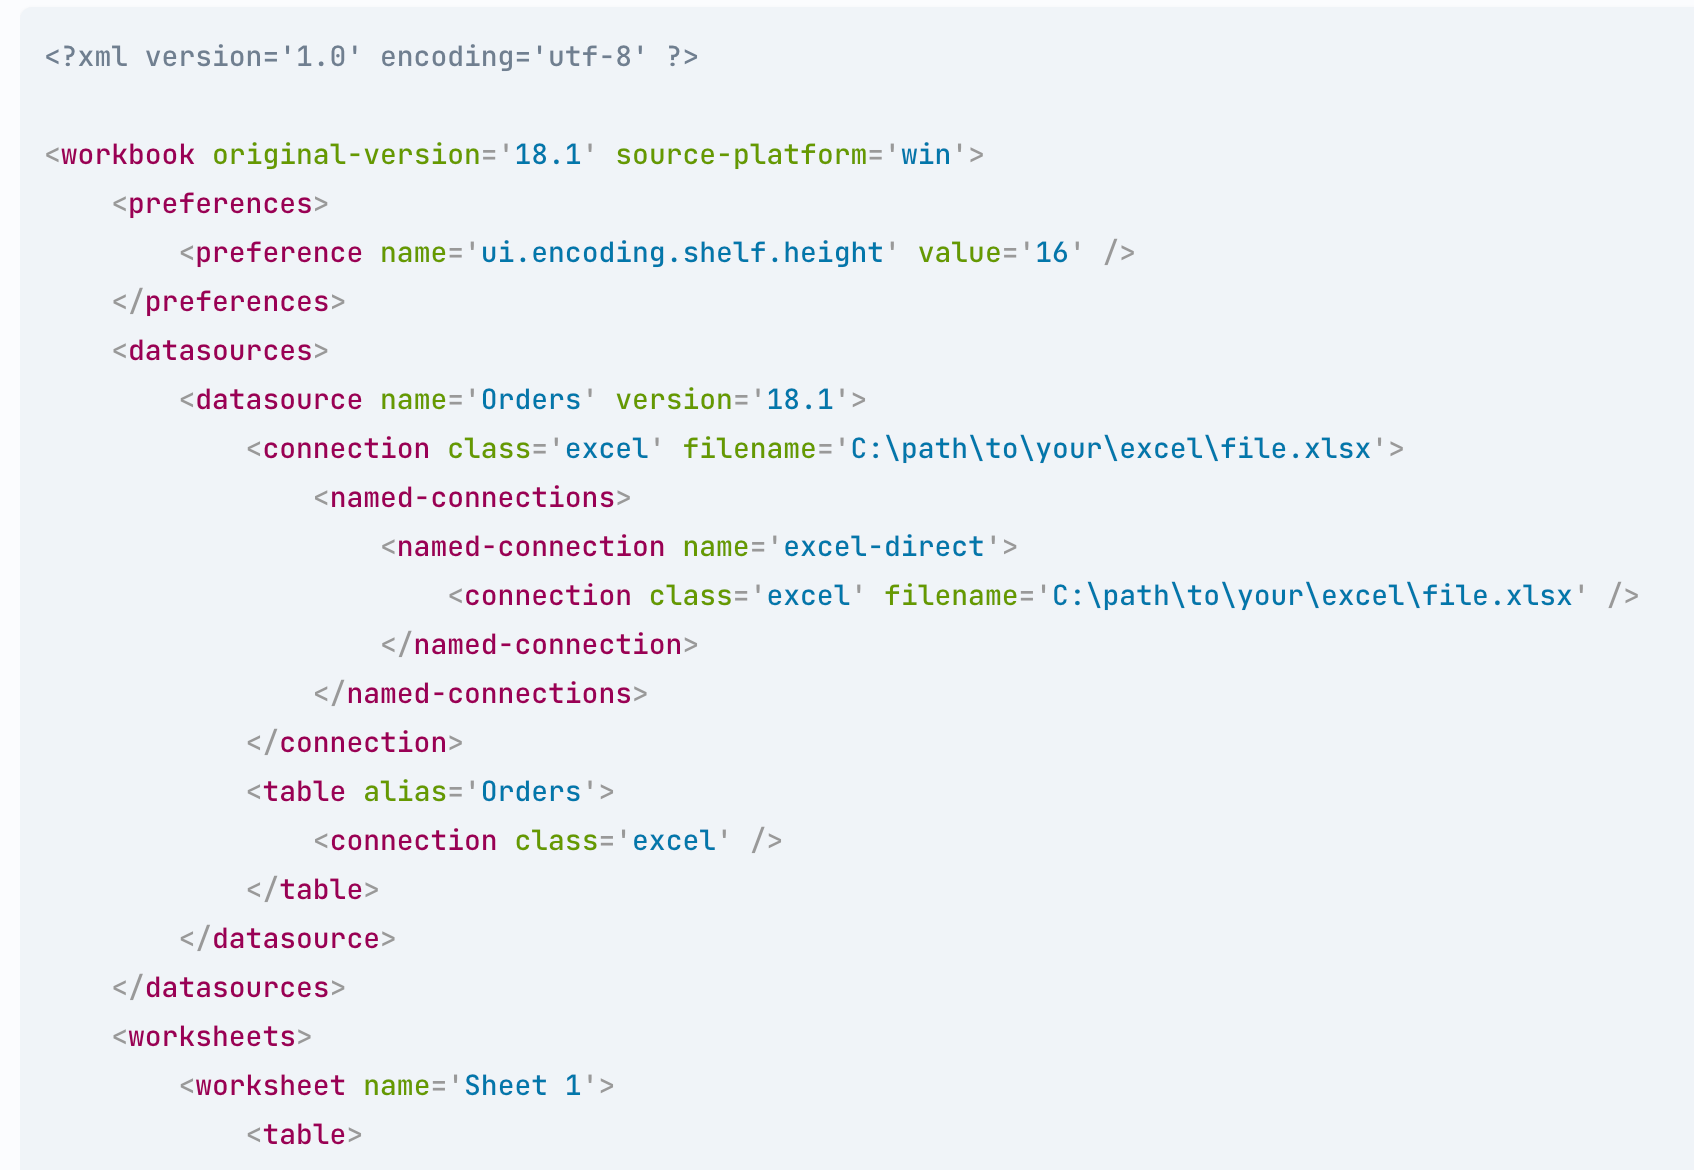 Example of a Tableau workbook (.twb) file using XML. It’s rather verbose for a simple set of definitions
Level 2: Changing to YAML for Better Readability & Adding Git Version Control
Inspired by the success of the Infrastructure-as-Code movement during the 2010s, analytics vendors began crafting their tools with “Analytics as Code” approach.
Verbose formats like JSON/XML are replaced by a readability-friendly format like YAML. Analytics objects (models, dashboards, metrics) are split into multiple files for easier management.
Git version control began to be natively integrated. Cloud-based tools now allow connecting directly to a user’s Github repository. Self-hosted tools defaulted to using YAML files to define analytics objects, moving away from storing them in relational databases, thus simplifying the process of synchronization with Git.
For the first time, data analysts could follow what a developer does: Checking out the code from Git, editing it with an IDE, committing the diff, and seeing the live dashboards/reports changed in production.
The majority of AaC vendors started from this stage: Looker started with the YAML format, as did Thoughtspot (TML), dbt Core and newer tools like Lightdash. This choice of format is entirely understandable considering the low effort required to design and implement such specifications.
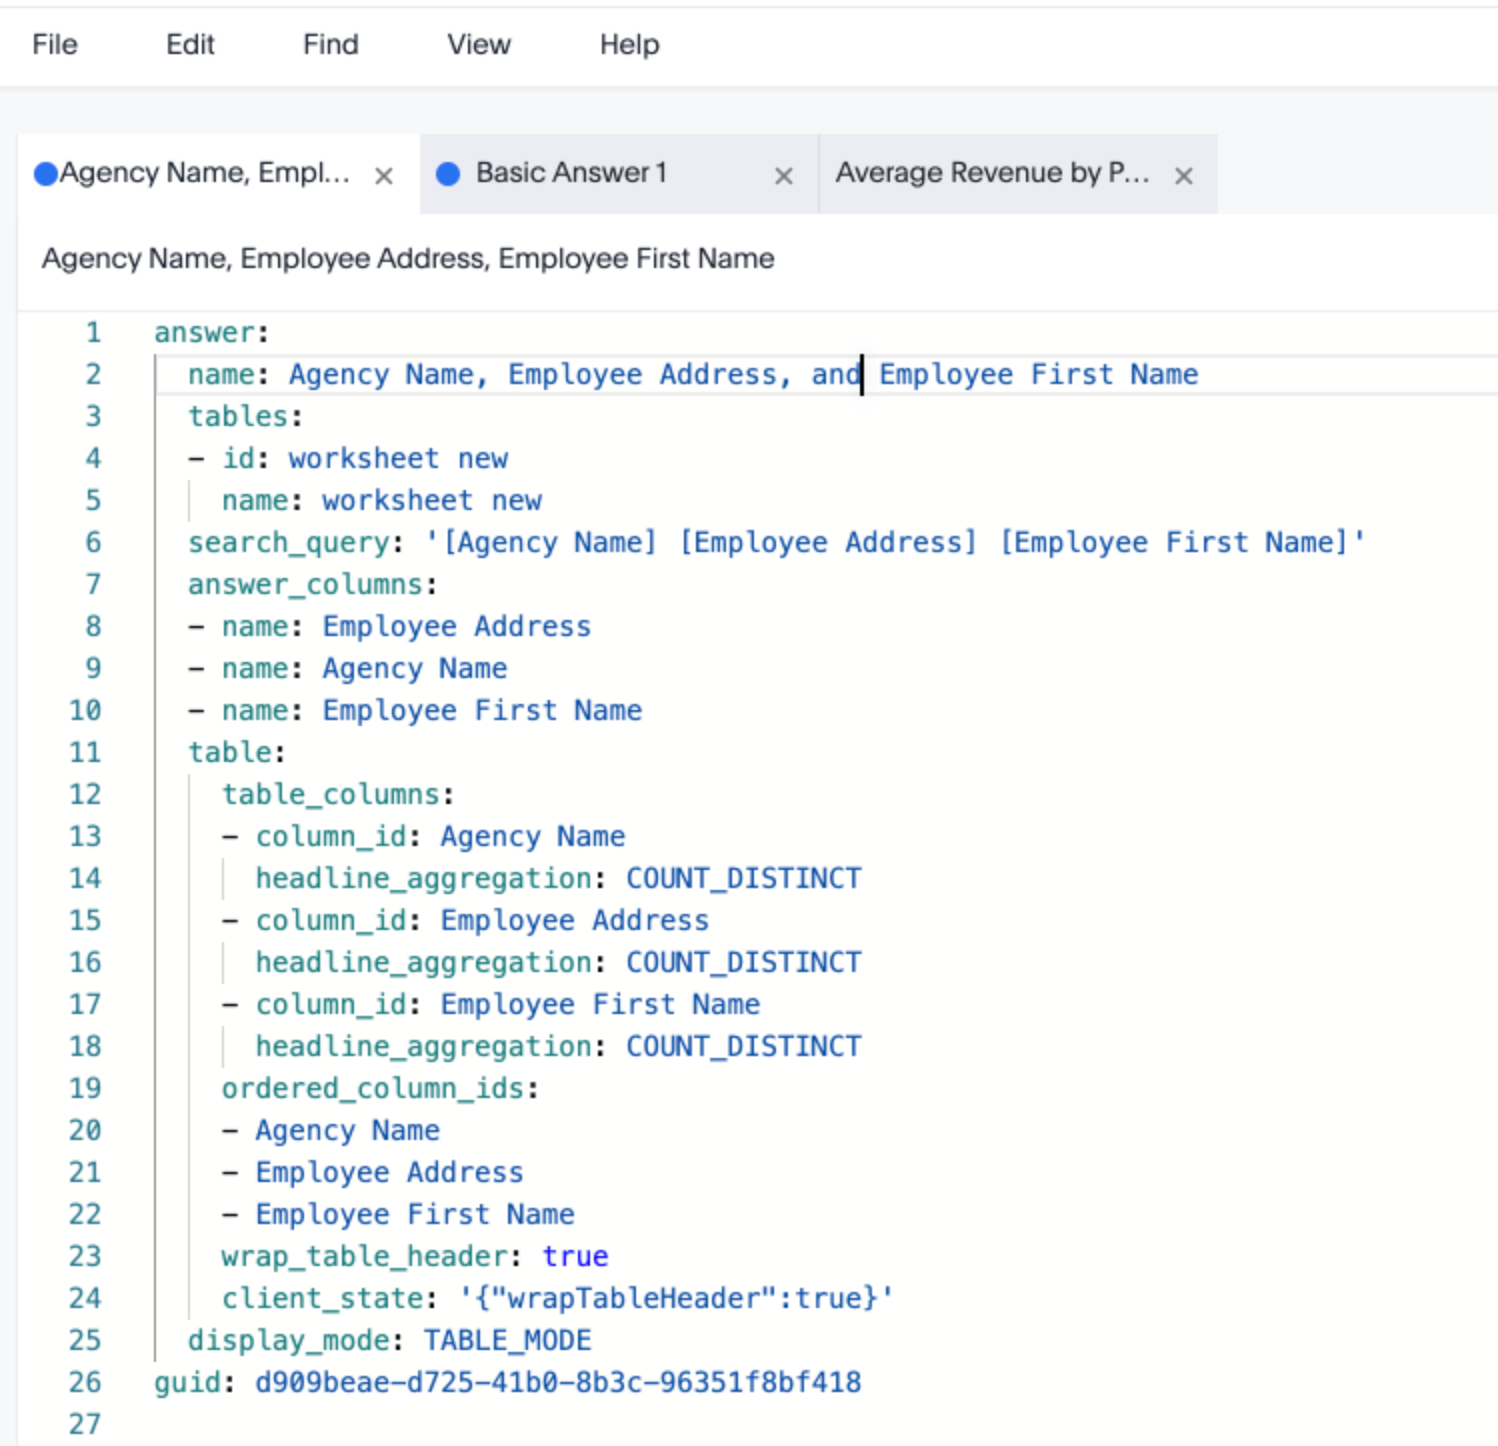 A YAML-based analytics markup language. Already more readable and edit-friendly than XML.
Level 3: Purpose-built Markup Language for Better Development Experience
YAML, however, is a general-purpose markup language. It is designed for storing data, not for developing analytics logic. While analysts can now do analytics development with YAML, the typical developer experiences, like syntax highlighting or autocompletion, are either inadequate or absent when working with YAML.
To overcome this, analytics vendors began building their own markup languages. These specifically-designed languages come with static type systems (think JSON Schema or XML’s XSD) that enforce structural constraints of the semantic definitions.
Analysts now get better language egonomics, autocomplete, and instant error feedback loops. Overall a much better development experience, resulting in fewer mistakes and better accuracy of the data outputs.
Looker’s LookML, initially based on YAML, recognized the limitations and introduced a new LookML 2.0 syntax based on their proprietary markup language, further improving the user experience.
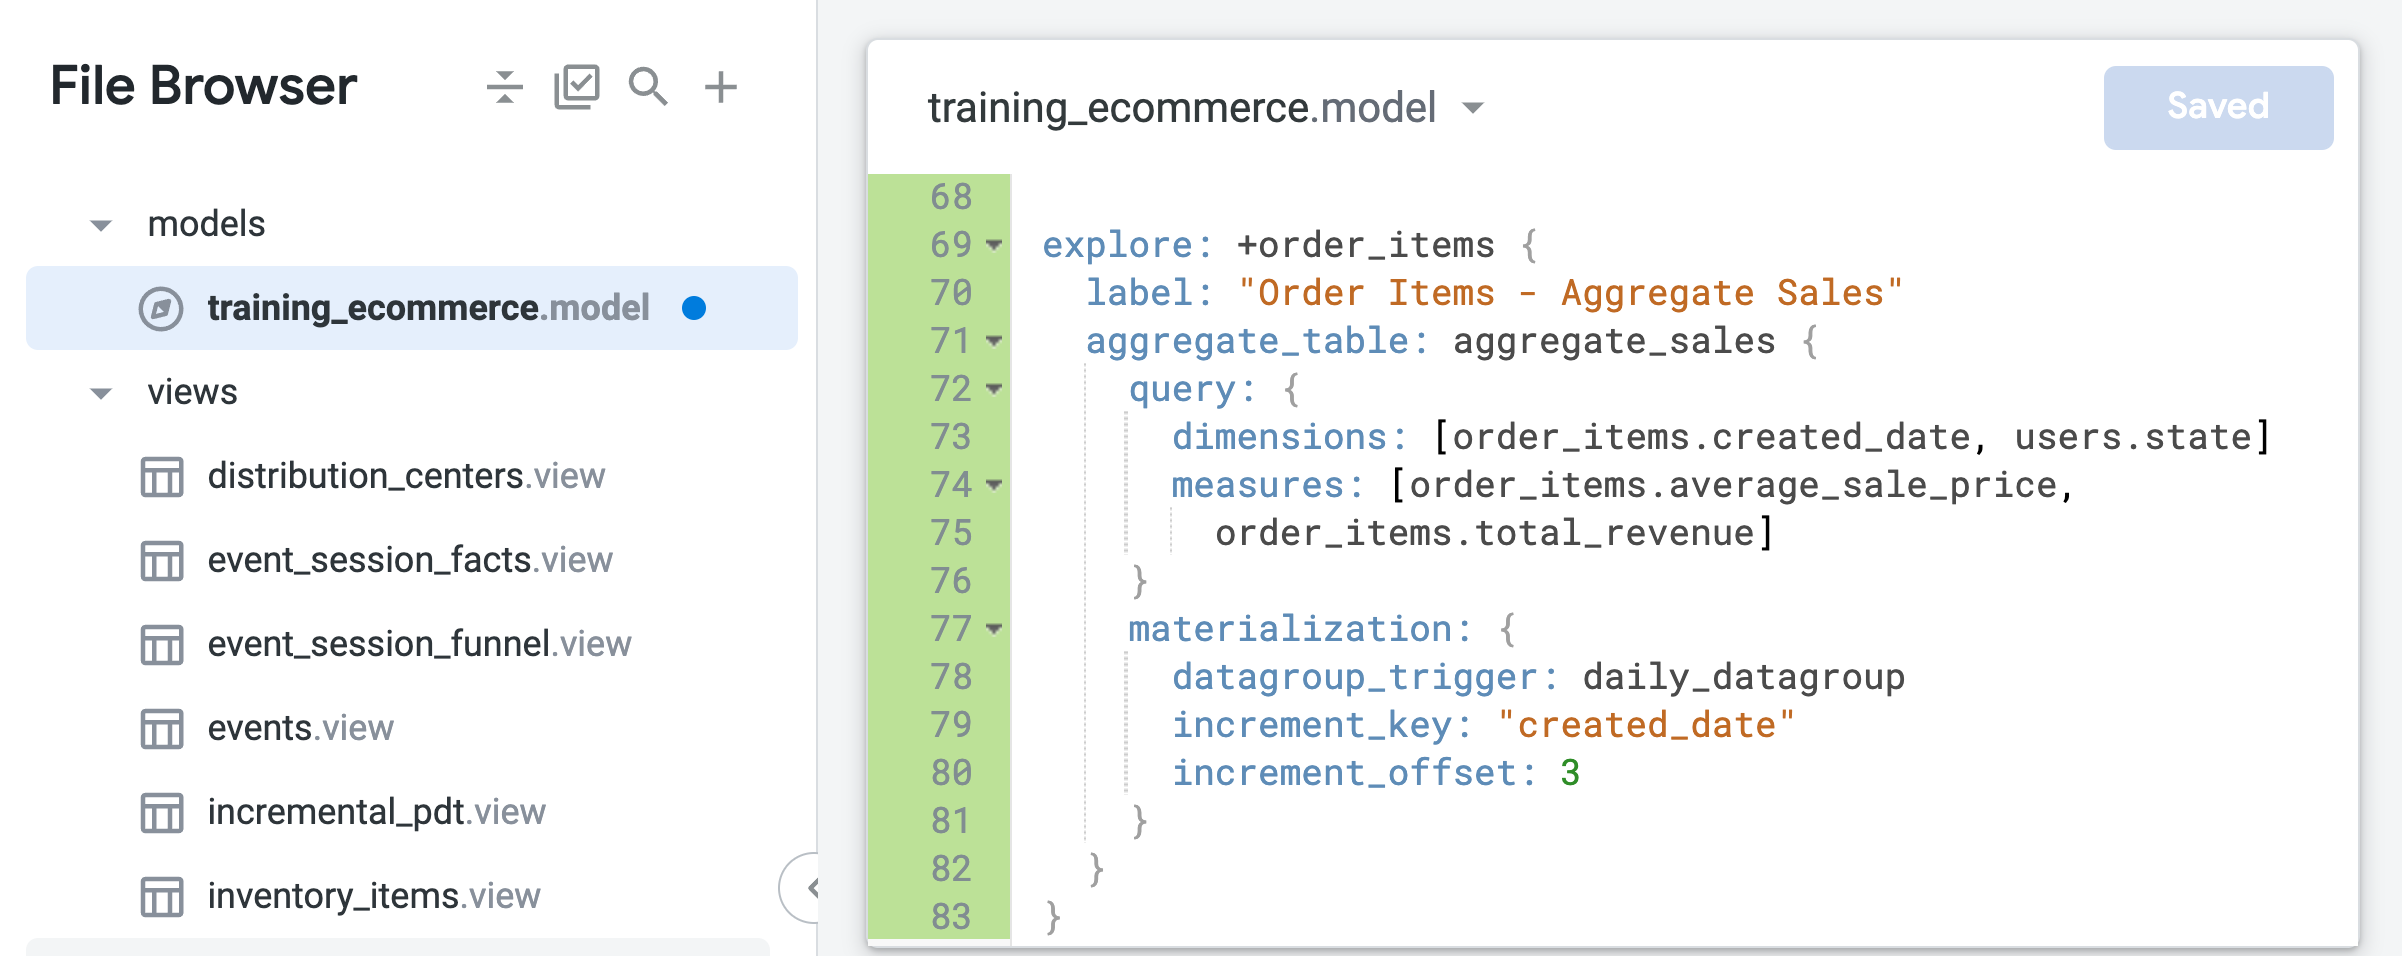 The new LookML, with better language ergonomics, autocomplete and better type checking.
Level 4: From Markup Language to Programmable Language
Improving developer experience with structural constraints is great, but it is likely not enough.
As analytics logic becomes more complex, it becomes harder to manage and maintain the code. A 500-1000 line SQL query is not rare in companies reaching a certain size. At dbt Coalesce 2023, dbt Labs noted a rising trend of projects with over 5000 dbt models.
We need new tools to combat this. The solution is not new: Software engineers have been doing this for decades, they built features into their programming languages to break down the logic into smaller components that can be reused and composed later on into bigger pieces. For example: Putting names on smaller pieces of logic and composing them together (variables, functions, or modules), or parameterizing the same logic with different inputs (function arguments or module parameters).
In analytics, we aim to express data in two ways:
- Data modeling: describing the data structure semantically, and
- Data querying: identifying the specific subset of the data required.
Both of these types of tasks need the ability to decompose and recompose individual pieces of analytics logic. However, YAML and SQL offer limited support for these types of features; and resorting to SQL string interpolation with Jinja is a terrible band-aid solution.
A robust analytics-as-code language at this level should provide the flexibility to coherently decompose and compose both types of analytics logic. Malloy and Holistics' AMQL (Analytics Modeling & Query Language) are examples of languages operating at this level.
Consider AMQL, for instance. It includes features that aid in the decomposition and recomposition of analytics logic, such as Const, Func, Module, extend, and composable metrics expression. These features, while uncommon in markup languages, are typical in high-level programming languages.
The below AMQL code calculates same-day activation rates & conversion rates by multiple time granularities (day/week/month) with reusable code components and composable queries.
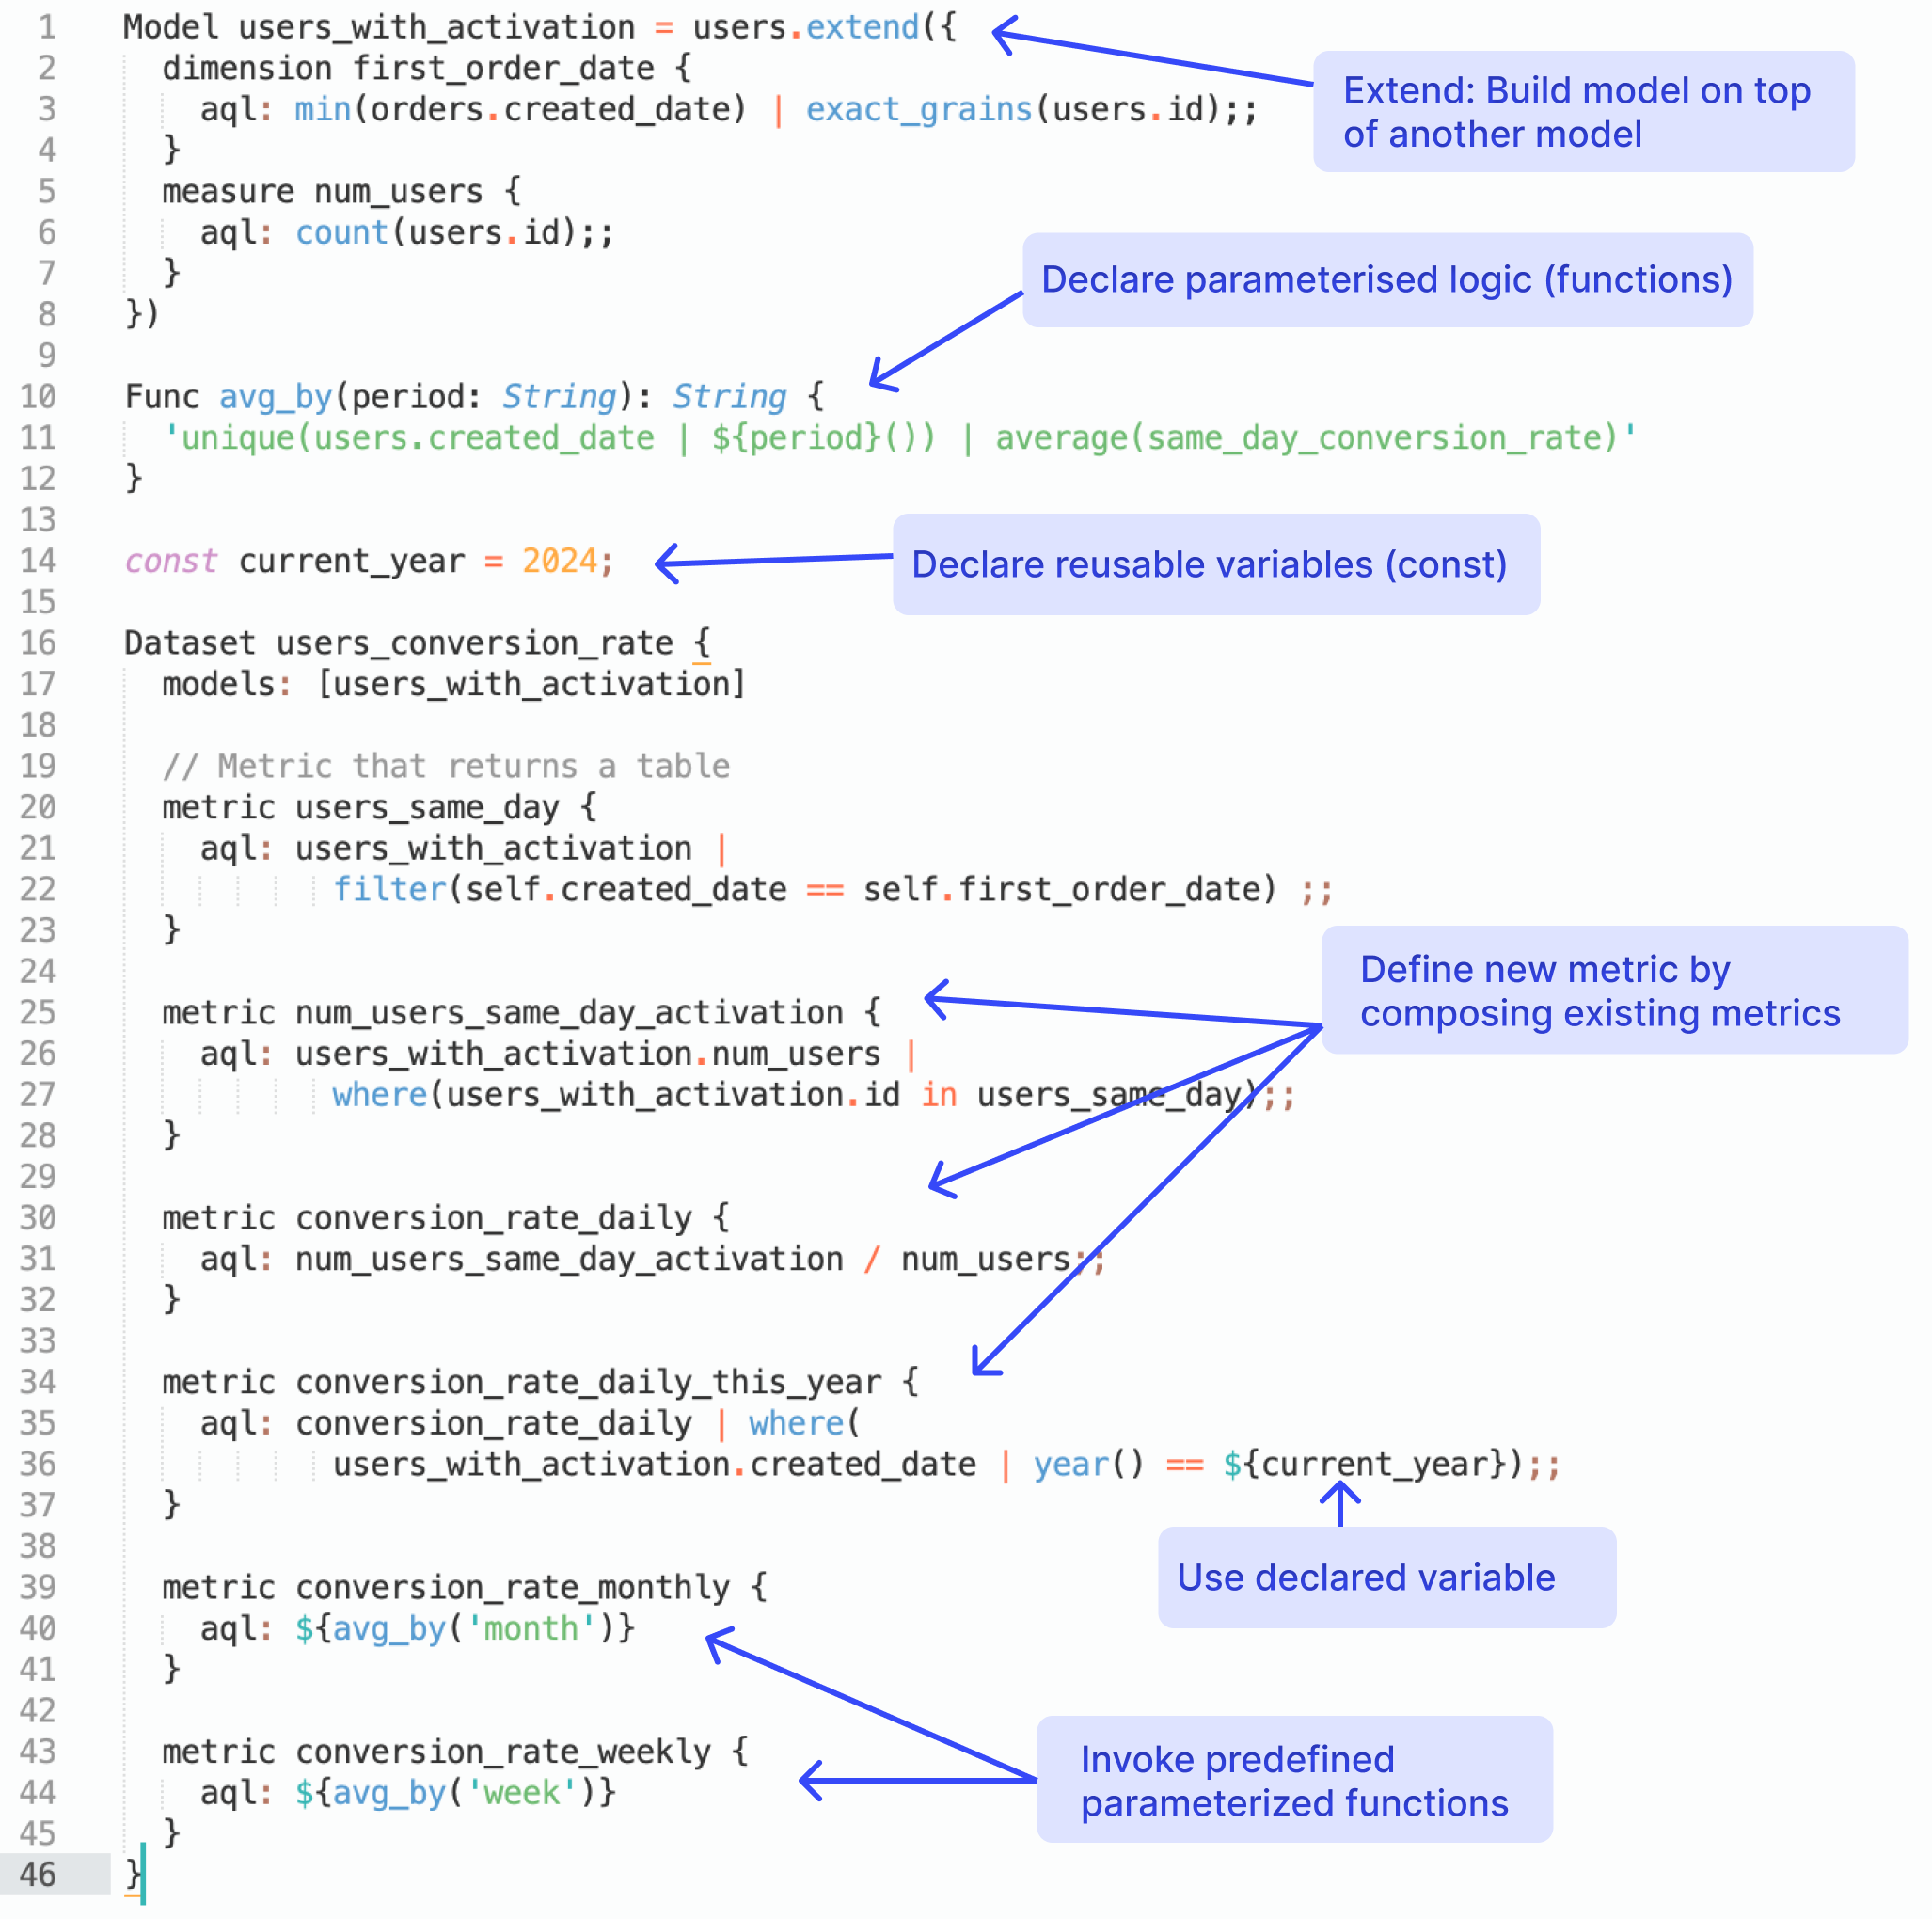 AMQL: Example of reusable logic and composable queries
Conclusion
The stages of Analytics-as-Code outlined above represent an organic progression driven by evolving user requirements as well as technological changes.
While Analytics-as-Code is a simple concept, in practice, it can take many forms, each offering a unique set of capabilities. By breaking down into distinct levels, I hope to give you a better understanding of these nuances, and hopefully, help you make an informed decision when evaluating analytics/BI tools.

Data Engineer turned Product; writes SQL for a living.