Understanding Your Average Customer Value Over Time (CVO)

As business owners, understanding your customers’ behaviour is among the key things that will help you grow your business. If you’re in ecommerce, retail, or F&B business, one question that usually pops up is: Do my customers come back and spend more with us over time? If so how much?
In this post I’m going to show you one simple method of answering the above question, namely, to calculate the average dollar value you can you can get from your customers over time: Customer Value Over Time.
While Customer Lifetime Value (CLV) give you a forecast of how much dollar value each customer would bring, Customer Value Overtime (CVO) give you the insight of how much dollar value each customer currently brings to your business. Therefore, the CVO would be more practical to understand how good your business is doing.
Customer Value Over Time
The idea is to see how much customer’ dollar value is based on their month-age (how long have they been with us).
Consider the following data table for a coffeehouse chain like Starbucks or Costa:
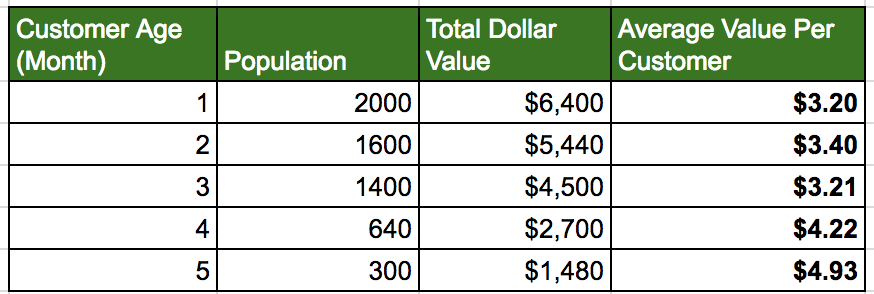
What the table above means:
- We segment the transactions by the user’s age at the point of transaction. Customer Age is the month-age we’re currently looking at. This will be capped by how long your business has been operating.
- Population is the total number of customers that have made 0 or more transactions when they are at n-month old. It’s easy to see that your total customer population is 2000.
- Total Dollar Value is total purchases all customers made when they are 1-month old. So if you signed up in Jan and bought $100 in Jan, it will be counted here.
- Average Dollar Value is the average value: Dollar Value / Population.
So if Bill signs up in January 2017, spent $20 in January, and $30 in February, then
- $20 will go to Month 1
- $30 will go to month 2
- Bill will go to population number for month 1 to 11 (assuming we’re at November).
Charting out the table, you get something like:
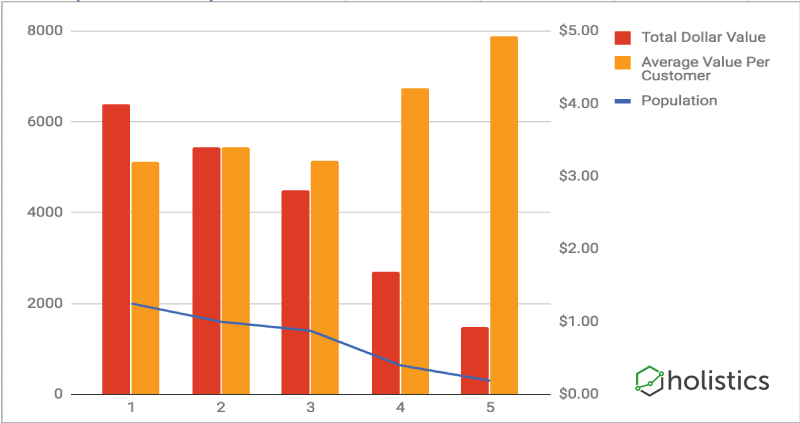
Some of the interesting insights you can get from this are:
On average customers spend $3.20 with us during their first month, $3.40 for the second month, etc. And they spend a total of $18.96 (sum of averages) per customer, for the oldest group of customers.
You can also see that, the longer a customer stays with you, the more he/she spend. This is healthy as it indicates good engagement and stickiness of your business.
This chart also provides you with a strong proxy into estimating your Customer Lifetime Value (LTV), that helps you decide how much you should be spending on acquiring new customer (Customer Acqusition Cost - CAC).
This report can be thought as a simpler way to look at cohort retention analysis , where the focus is not trying to segment (cohort) your customer base into different groups, but to see how the their aggregate purchasing behaviour changes at each month-age: Is someone likely to spend more with us when they just knew, or after a year?
If you’re feeling in a data mode, instead of looking at just average, you can dig further into percentile-25, percentile-75, percentile-90 to understand more about your customer spending at each month-age.
Conclusion - Takeaway
The above approach would work well for ecommerce, retail or F&B businesses, where you have customers that visit you regularly.
In this post I showed you a simple way of answering the question: "Do my customers come back and spend more with us over time? If so how much?".
I explained what it is, and why you should look into it. I hope to follow up with another blog post to show how you can build such a report above using SQL and Holistics.
Meanwhile, if want to draw more insights from your raw business data, consider giving us a try: https://www.holistics.io.

Data Engineer turned Product; writes SQL for a living.