Business Intelligence
Data at Work
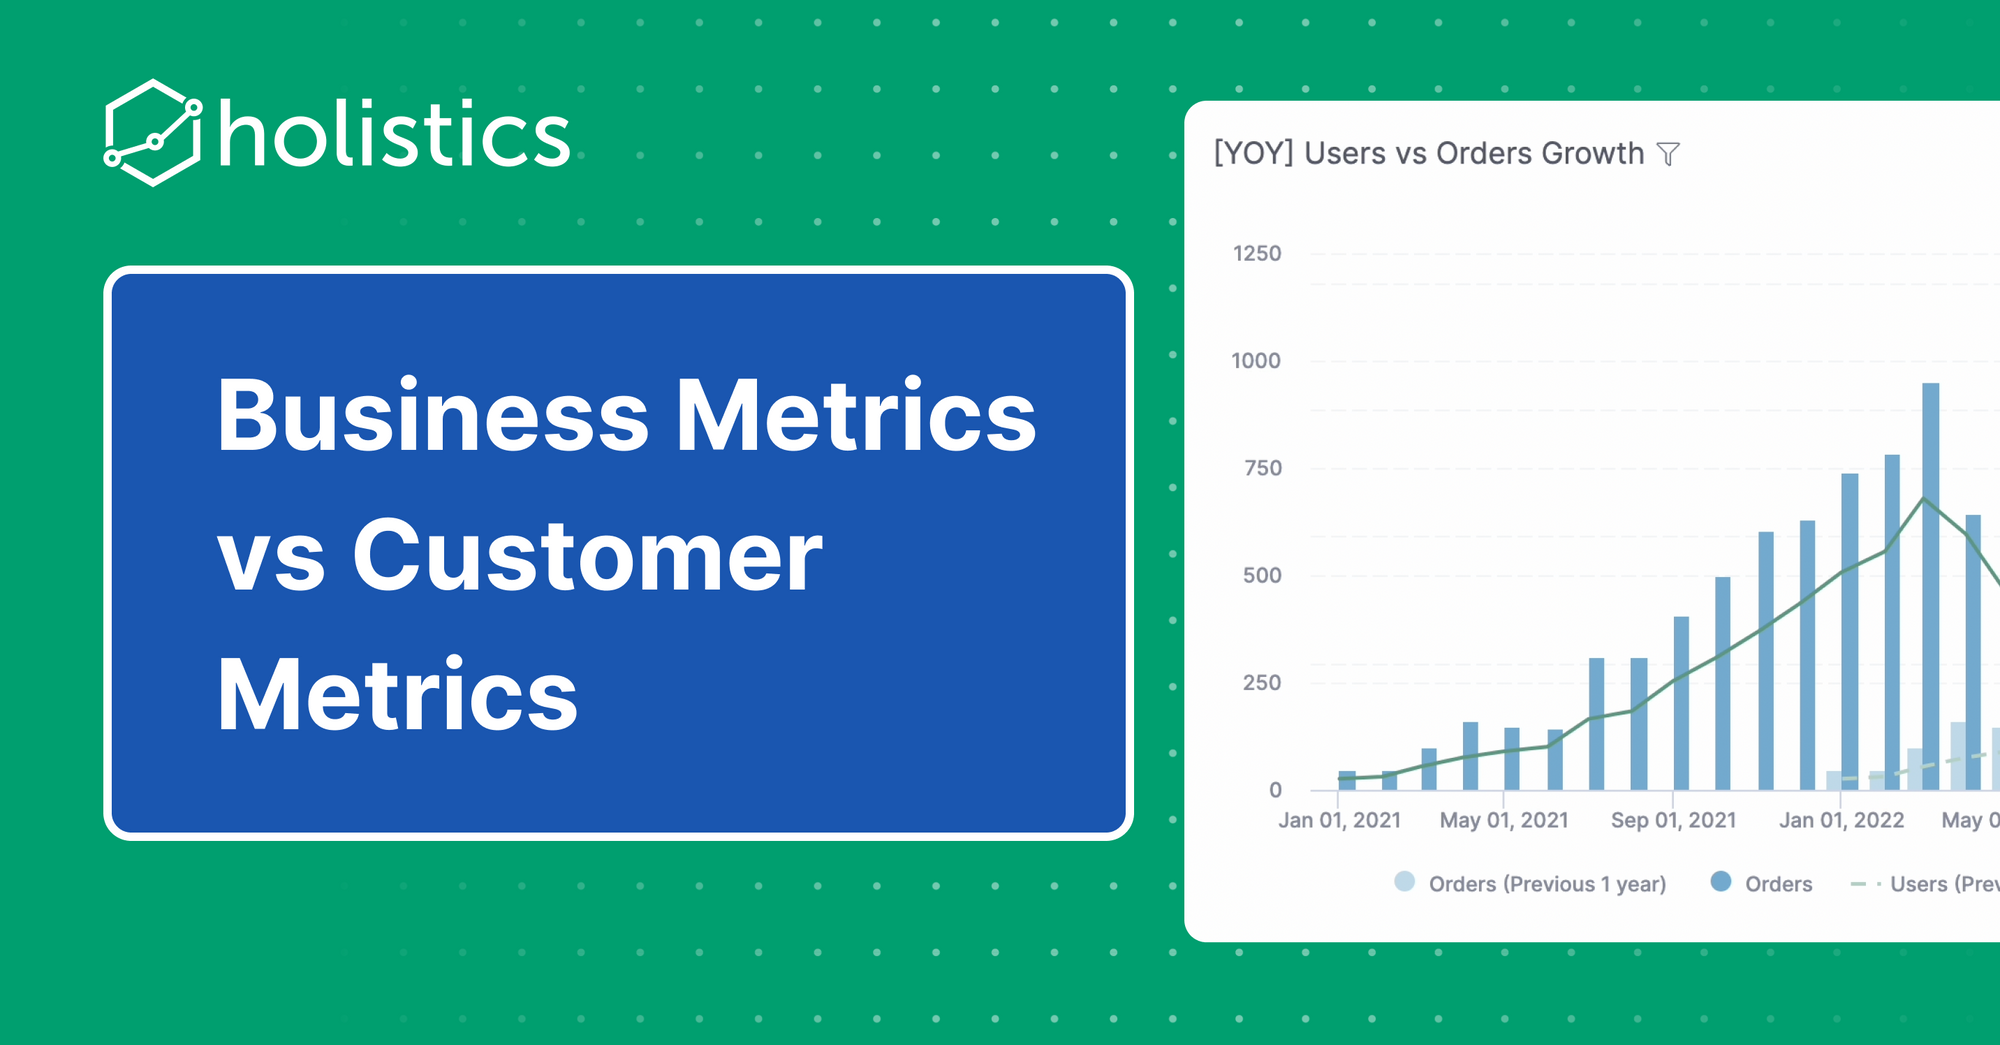
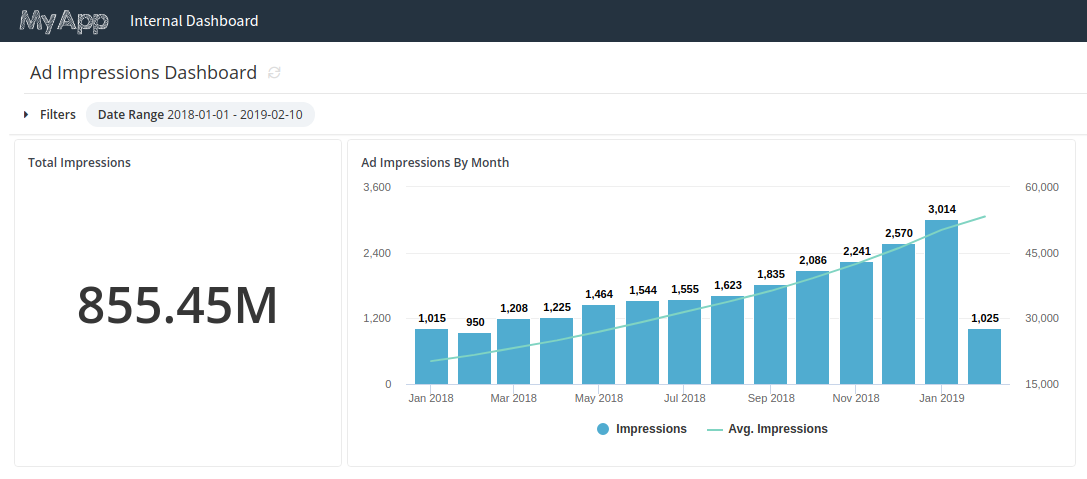
Business Metrics vs Customer Metrics
What are the typical metrics that you’d normally look at weekly? If you're like me (a startup founder), you …

What are the typical metrics that you’d normally look at weekly? If you're like me (a startup founder), you …

Why Amazon's notion of measuring controllable input metrics is a lot more profound than you might think.


“There is nothing so terrible as activity without insight.” Insight has become an essential need for every company in order to understand what the company is experiencing, why it happens, and what might come in handy in the future.
Using custom SQL for your Tableau workbooks is usually a really bad idea. Here's how using Holistics with Tableau makes this a non-problem.
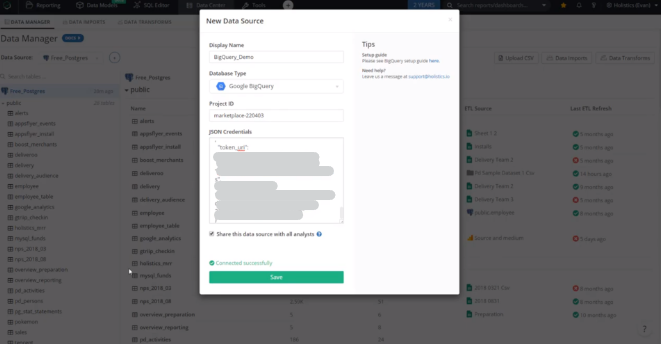
With cloud services today like Google Cloud Platform (GCP) and Holistics, setting up a data warehouse is insanely simple. In this video, …


As we are still a very small startup, we do not have a dedicated data team but we want to democratize data access. Holistics plays a big role in our company by providing visualization and reporting features via connecting with our database.


Tableau is a great data visualization tool to help data teams provide senior executives with summarized data. However, there is typically lots …

In this post, we will be sharing with you two tips to make dbdiagram.io work better for you * How to define …
Your embedded analytics dashboard in Holistics takes a long time to load, thus impacting your customers' experience. This post shows you how to optimize the performance of embedded dashboard by preaggregating the data.
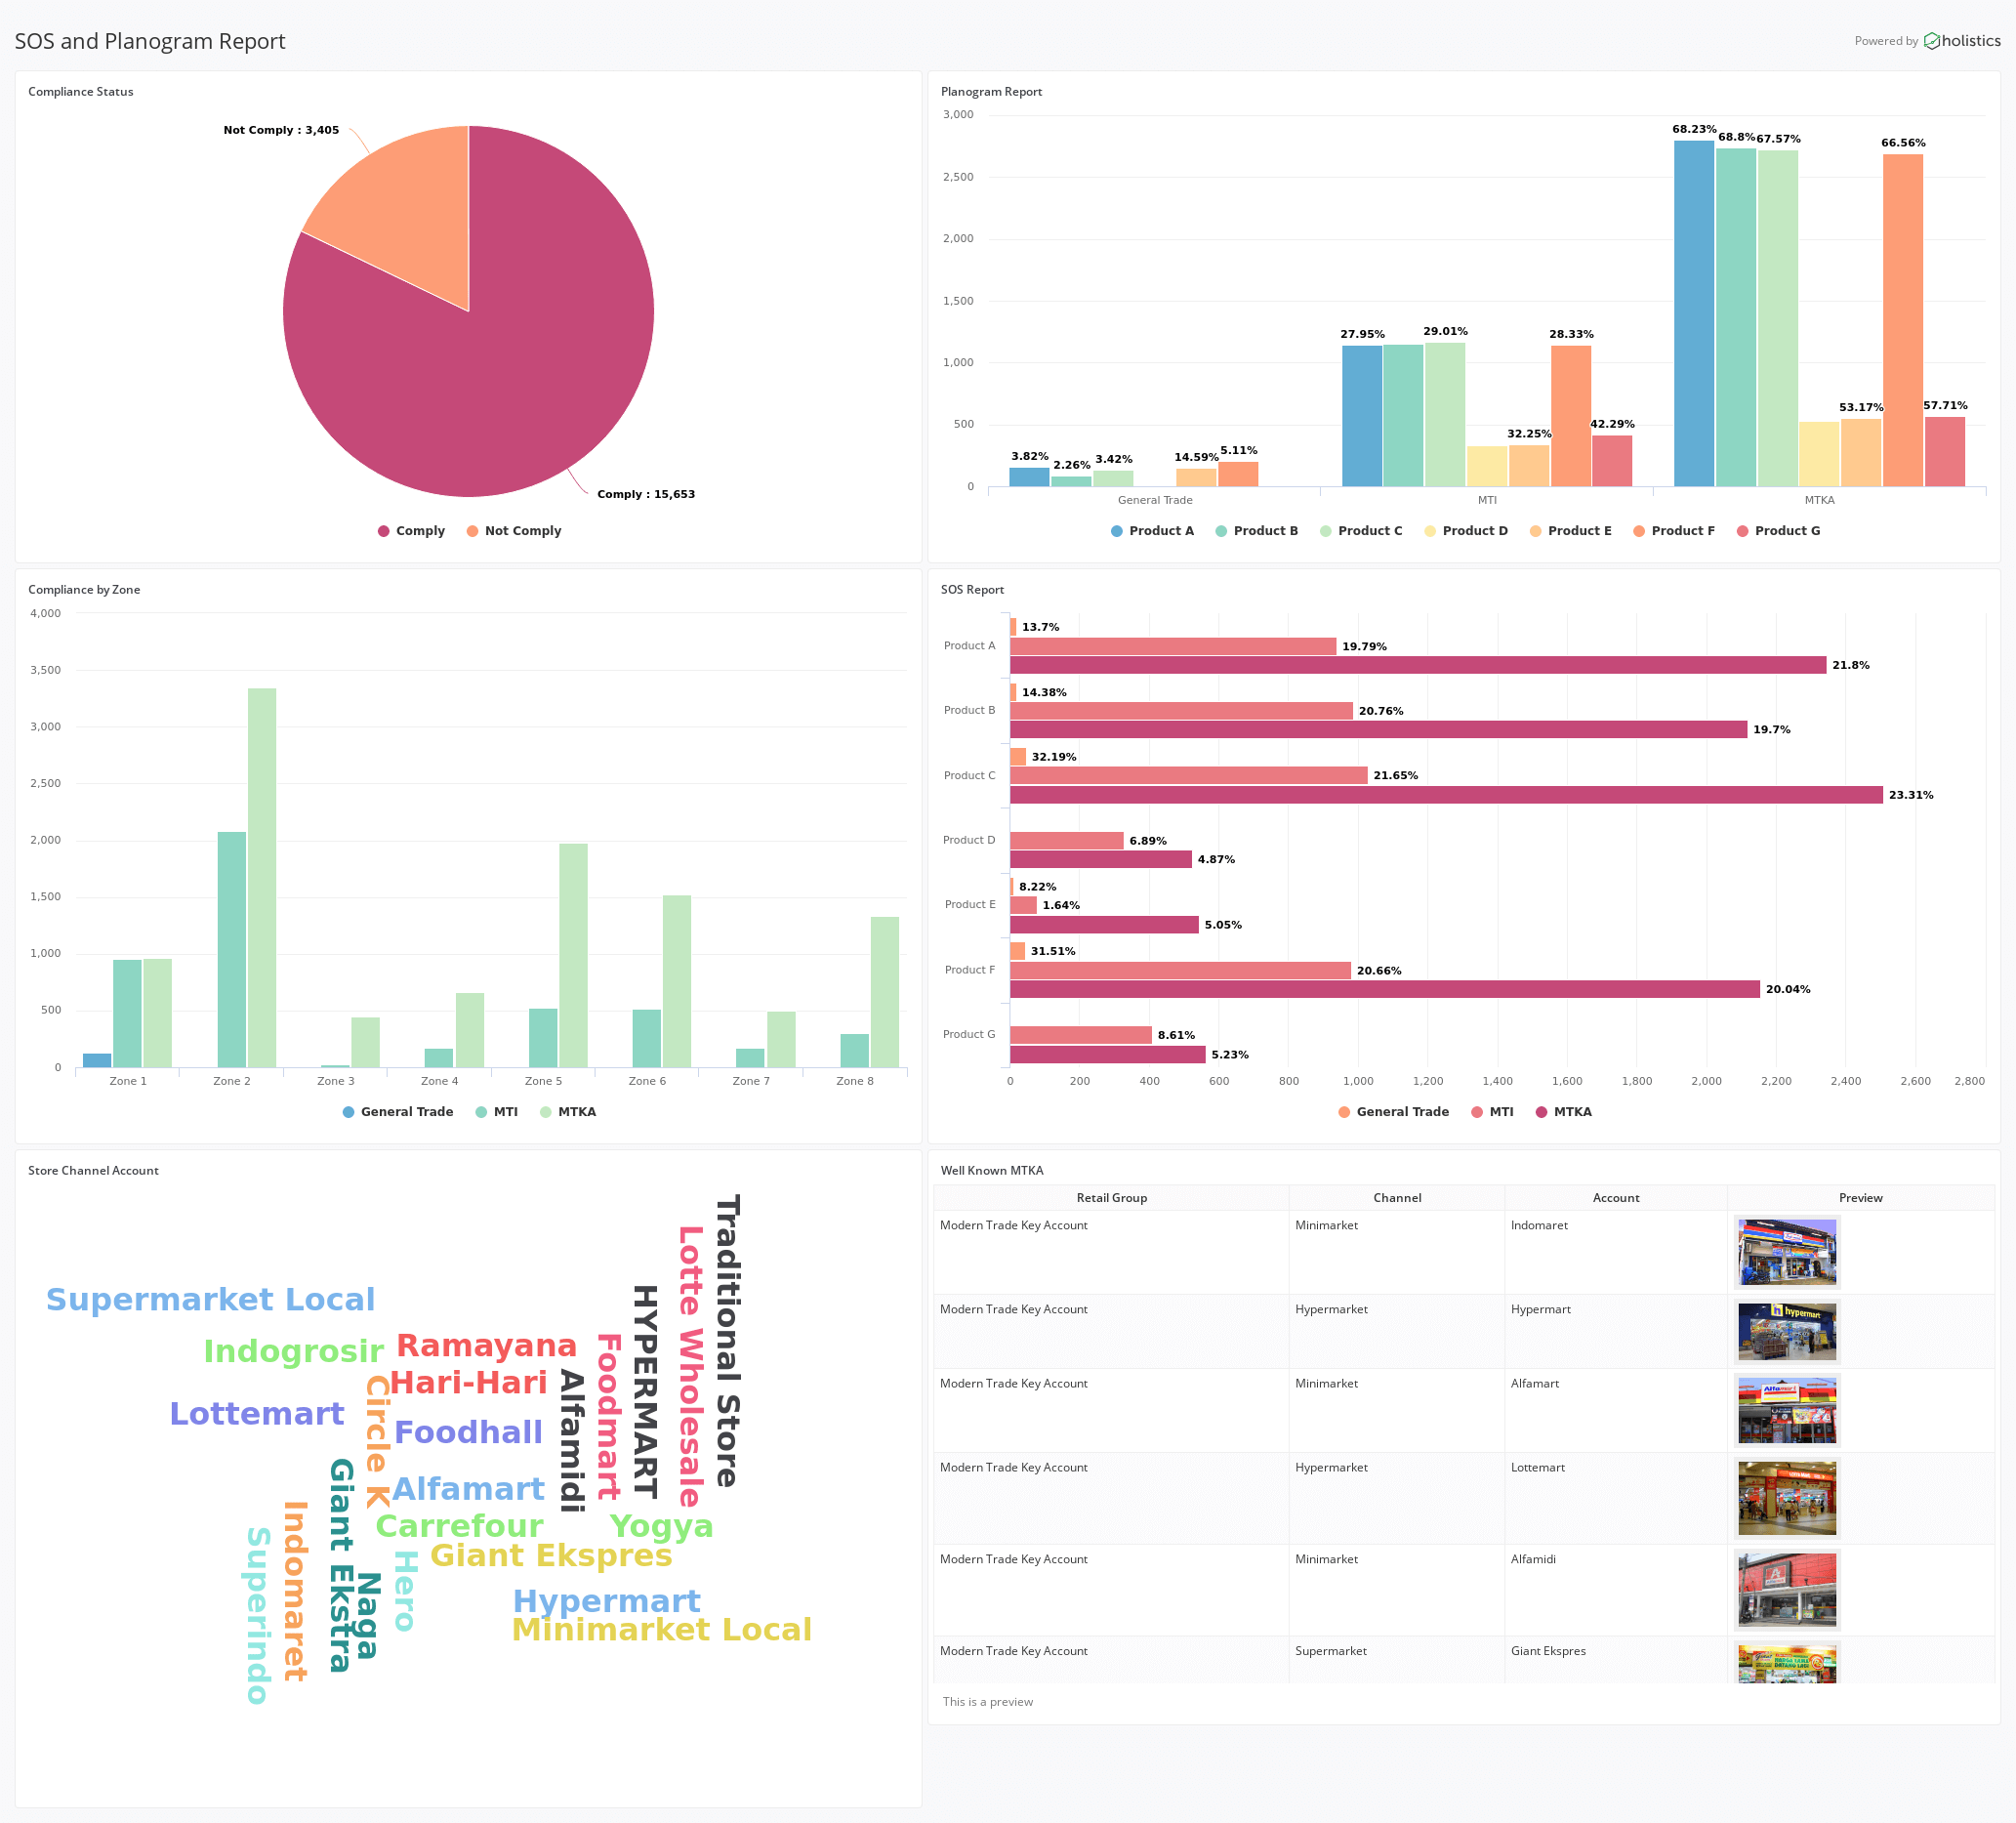
Planogram and Share of Shelf/Space (SOS) reports are key field execution reports that are important concerns for decision makers to carry out the marketing strategy. In this article, we will explain what Planogram and SOS reports are.

A good data analyst is one who has an absolute passion for data, he/she has a strong understanding of the business/product you are running, and will be always seeking meaningful insights to help the team make better decisions.
Many Mongo users get stuck going from MongoDB data to analytics. Getting data out of Mongo and into a relational database lets you build your reporting workflow.

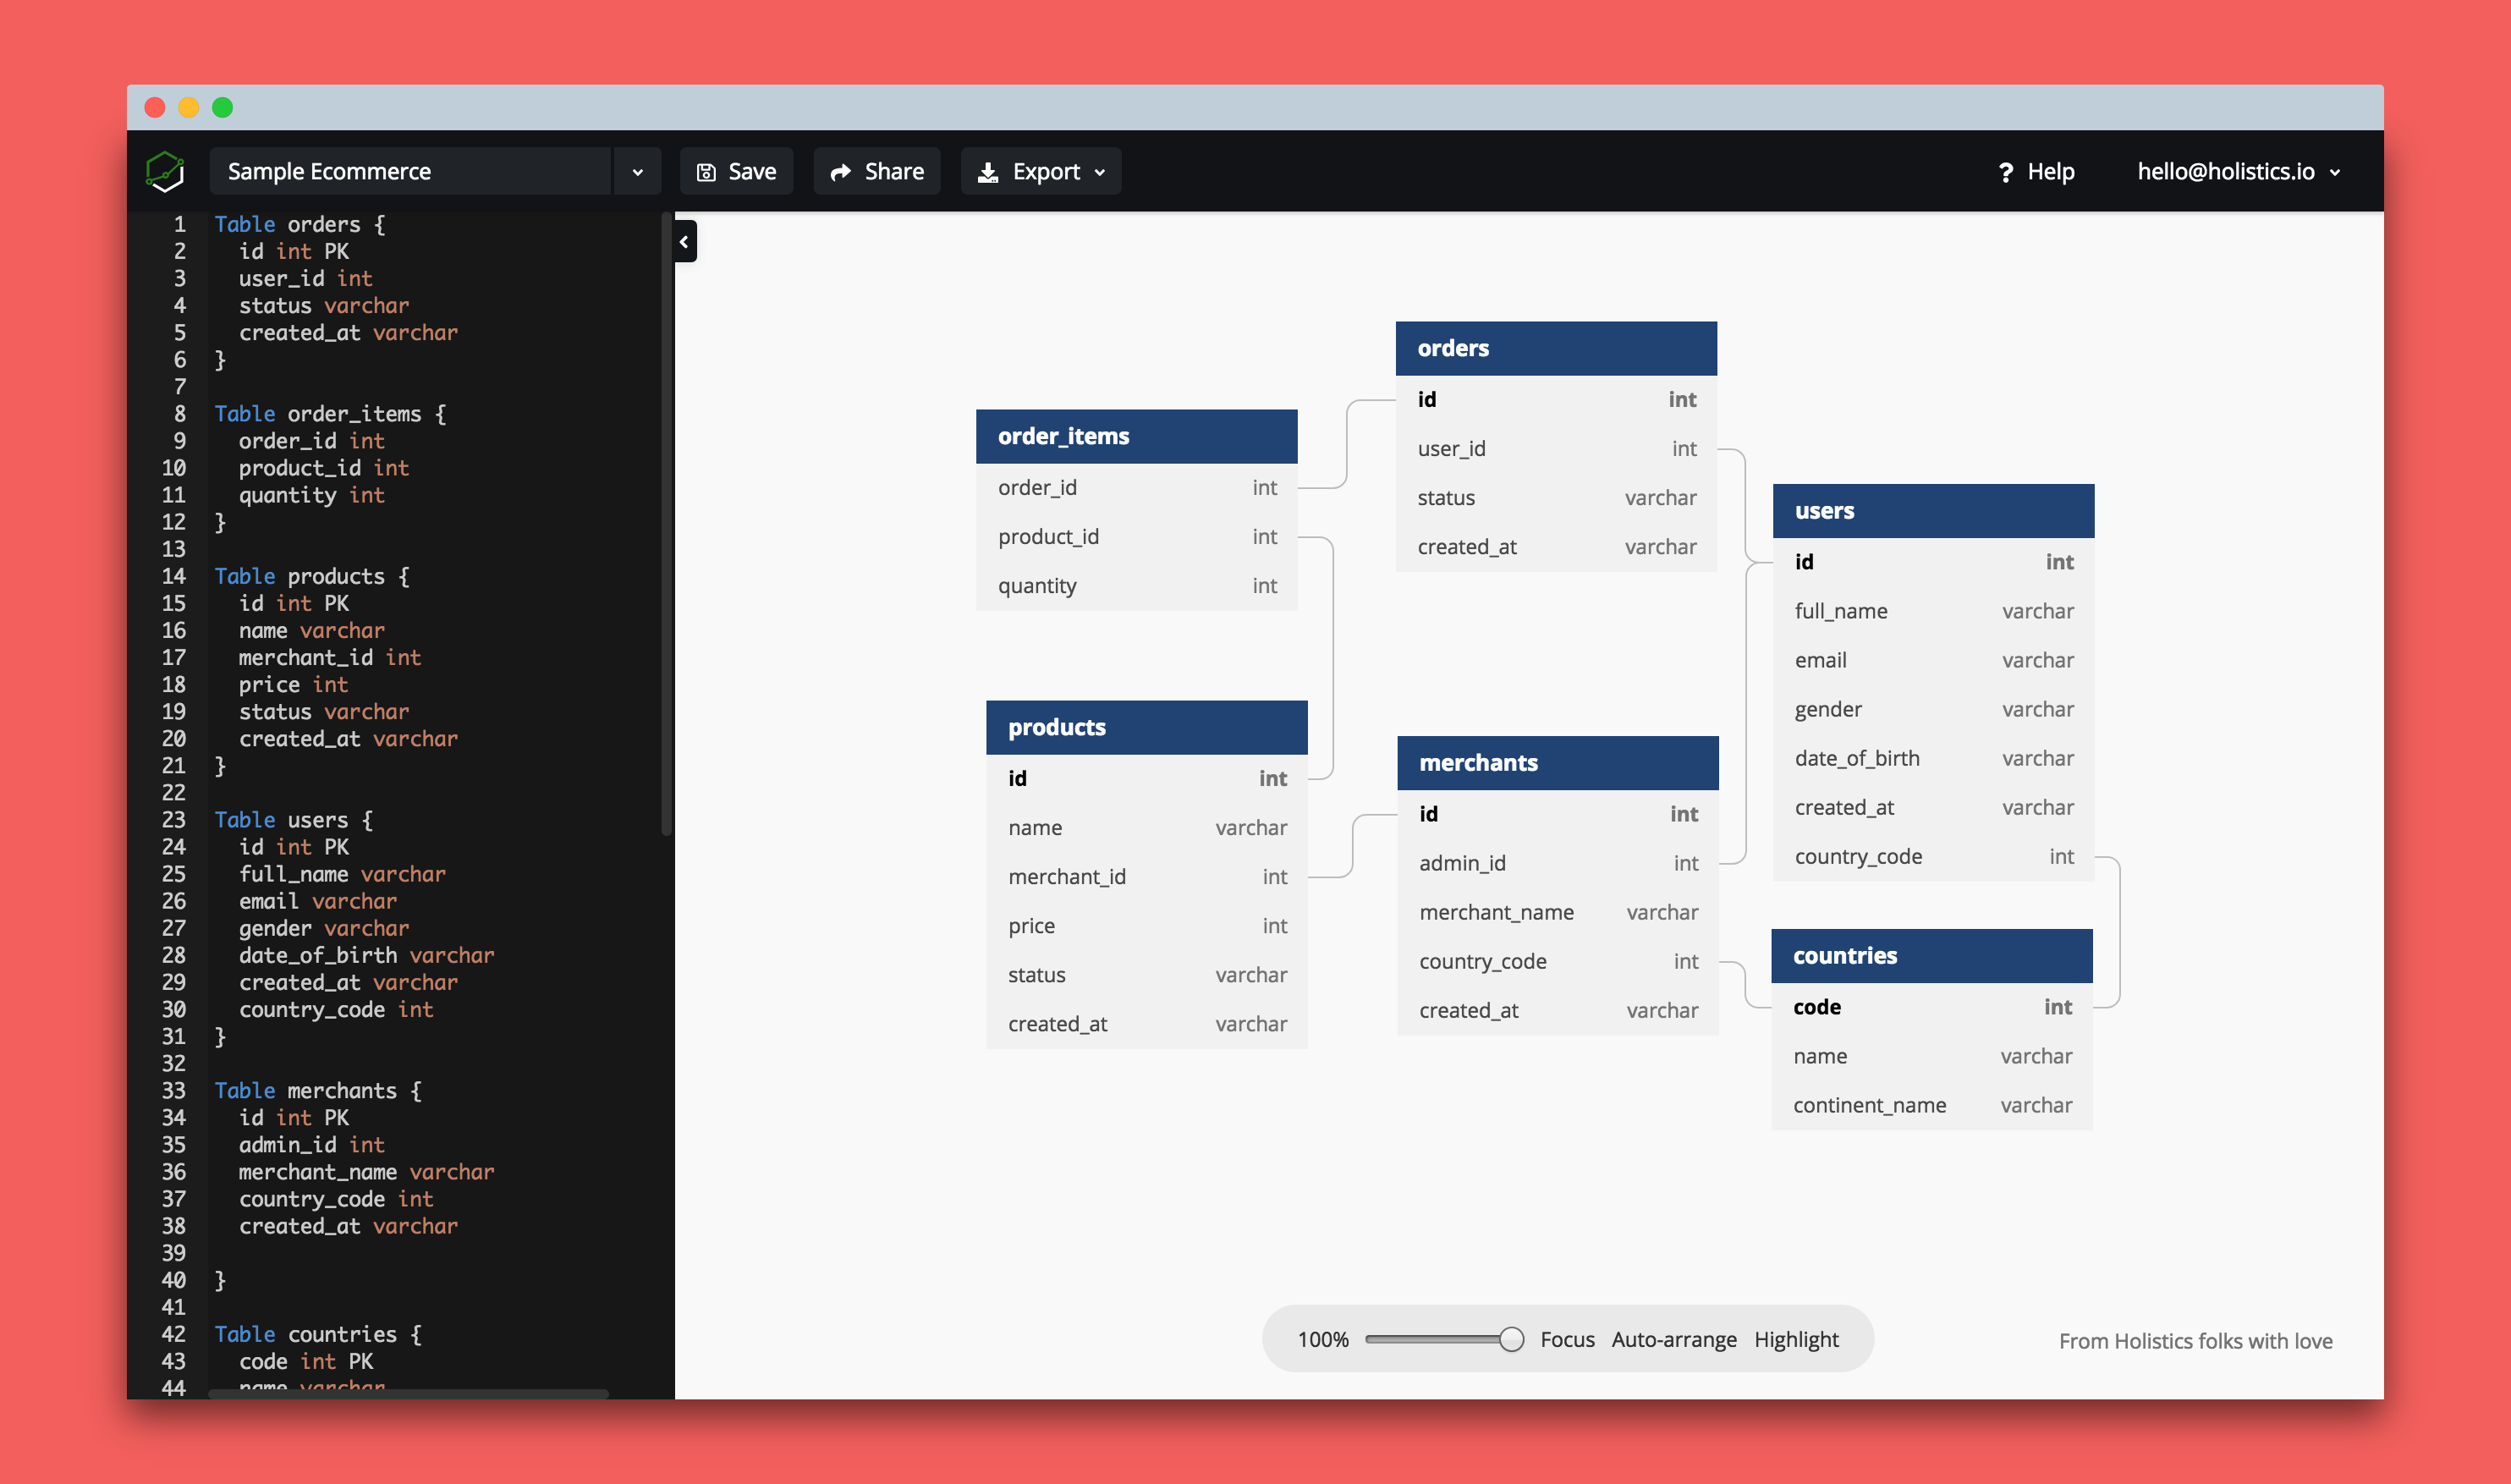
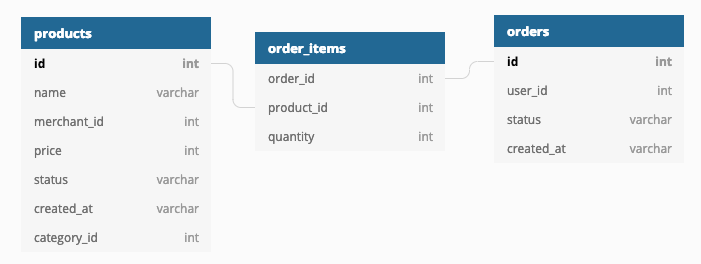
Starting as a feature developed by our interns to help our customers visualize their database schemas on holistics.io (Business Intelligence Platform) …
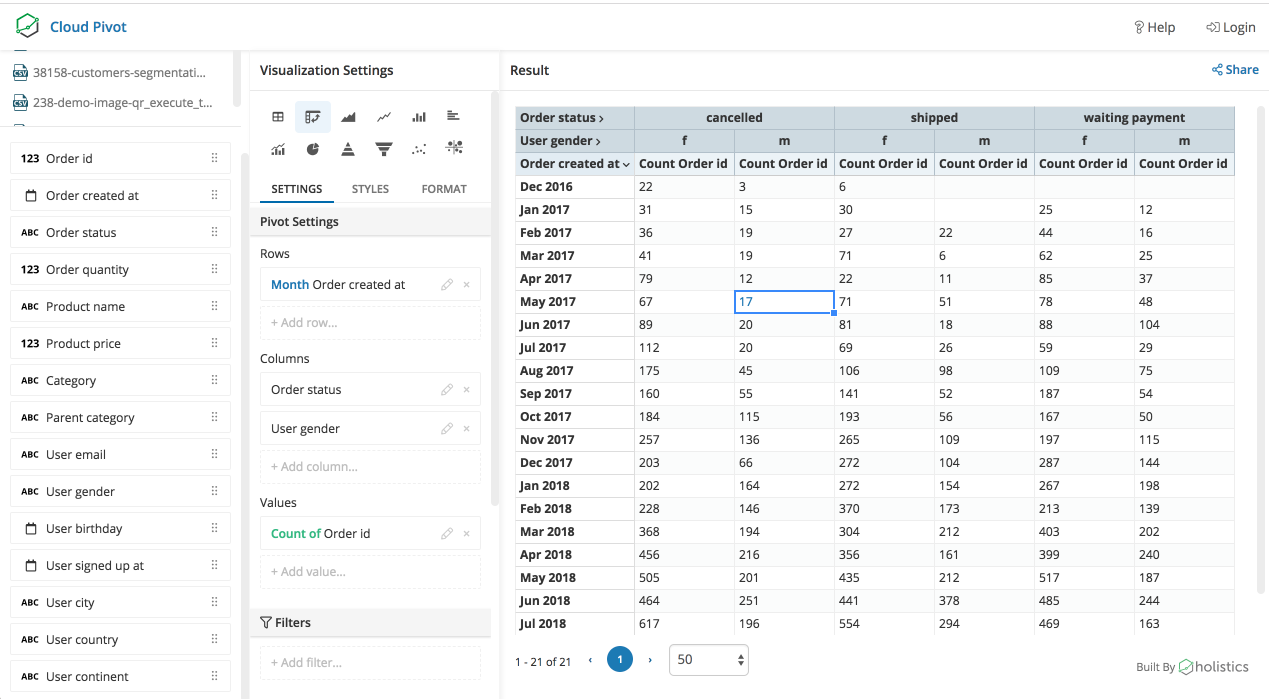
Pivot Table is a concept that allows you to summarize and aggregate a set of data by different groups of fields. The …


Preparing for a data analyst interview can be intimidating. Learn a few tips to help you prepare your interview better.
Join 30k+ people to get insights from BI practitioners around the globe. In your inbox. Every week. Learn more
No spam, ever. We respect your email privacy. Unsubscribe anytime.