How To Choose A BI Tool - Insights from Datanest
“There is nothing so terrible as activity without insight.” Insight has become an essential need for every company in order to understand what the company is experiencing, why it happens, and what might come in handy in the future.

This guest post originally appeared on Medium, on the Datanest blog
“There is nothing so terrible as activity without insight.” — Johann Wolfgang von Goethe
Insight has become an essential need for every company in order to understand what the company is experiencing, why it happens, and what might come in handy in the future. However, gaining insights from data can become a little bit challenging if it is not facilitated with the right tool. That’s why choosing an appropriate BI (Business Intelligence) tool which can answer all of the company’s needs is learning by doing process.
Datanest is a Data Science as a Service startup from Indonesia which provides a full end-to-end solution for businesses to leverage the data they have using AI and Machine Learning Algorithm. Because what we do is processing our client’s data, we need a BI tool to gain insights and provide visualizations which can satisfy the client’s expectation.
Here are 2 of the products that require strong data visualization capabilities:
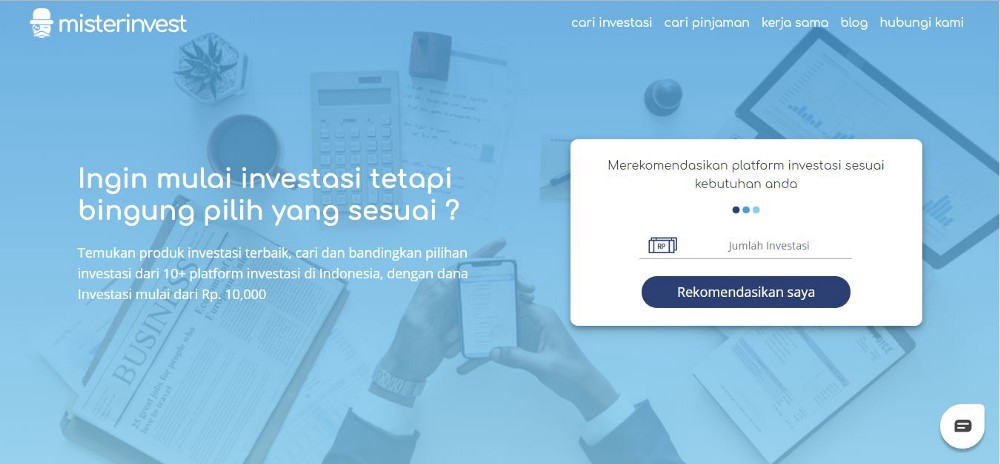
- misterinvest.com, an aggregator platform to allow people to search, compare, and invest through one of our partners (P2P Fintech, Banks, etc.).
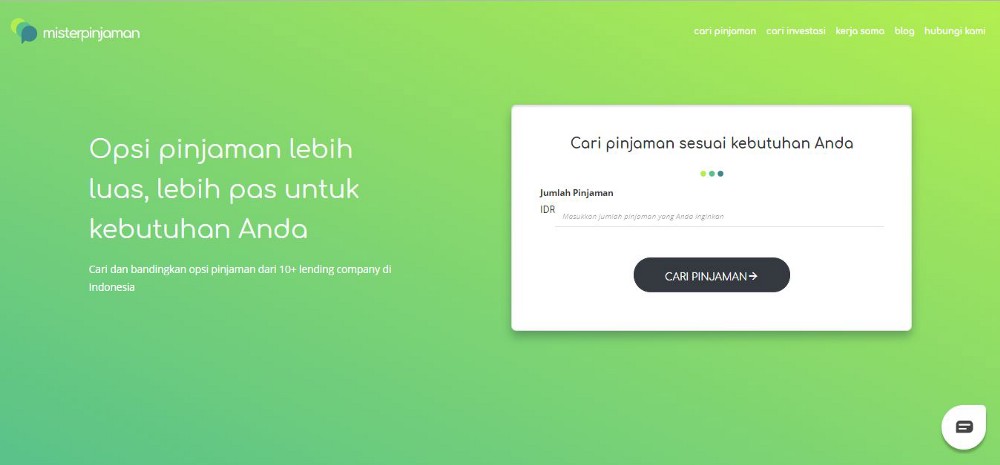
- misterpinjaman.com, also an aggregator, that allows people to search, compare, and apply for a loan.
These two websites have a considerable number of visitors each day; both platforms have multiple and different data points: Mailchimp for email campaign, social media, google analytics, google ads, and/or internal database with all forms of data. Therefore, we need a BI tool to visualize the full user funnel in order to optimize it later on.
Another big project that we are handling comes from one of our clients, which is one of the biggest distribution company in Indonesia called Tigaraksa. They need to be able to monitor their sales per channel. We received a huge amount of data from them and we stored the data in BigQuery. Meanwhile, because the data size is very important, we need a BI tool which can query the data to make sure that we extract the right data. Not only that, we also need a BI tool which provides a variety of charts and colors because there are many kind of data that require different types of visualization.
We tried many self-service BI tools such as Metabase, Redash, Tableau, and Google Data Studio but we still feel there are certain aspects which are not quite the right fit for our case. For example: not able to query the data, not enough variety of charts, limited number of colors, and last but not least, the number one problem for most people: limited self-service capabilities.
Fortunately, we find Holistics which we feel as the most suitable tool for our needs right now.
Here are the reasons why we feel Holistics is the best fit for us:
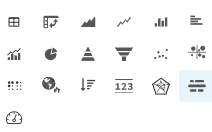
1. A wide variety of charts
There are more than 14 types of visualizations that we can play with. Not to mention, we can customize the color to our hearts’ content too!
- Pivot Tables
- Metrics
- Line Charts
- Column Charts
- Bar Charts
- Area Charts
- Pie Charts
- Funnel Charts
- Conversion Funnels
- Geo Heatmap
- Cohort Retention
- Scatter Charts
- Bubble Charts
- Etc.
2. Able to query the data
As mentioned above, because the data size is very big, it is important to know what data we are extracting and make sure that we do not miss out something. As we know, in BigQuery, some functions take statistical approximation, so they are not showing the exact number (for example: count(distinct _ ) function). However, this can be solved by adding a particular code to our query code. That is why being able to query the data is a crucial and beneficial factor.
3. Scheduled Slack and Email Reports
This feature allows us to send reports to our client periodically without having to do it manually. It will save us a lot of time and what matters the most is, our clients are happy!
4. Parent-child Filter
With this type of filter, we can filter a filter based on a filter. Well…of course this is a little bit confusing, but chill! So basically, we can filter the “child” based on what we choose in the “parent” filter. The examples of parent-child filter that we used in our cases are country-province, principal-product, location-merchant, etc.
5. Fast Response Service
We cannot avoid that sometimes we encounter errors or we have many questions to ask because we simply have no idea why the problem occurs in the first place. There is nothing to worry though! We encountered the same problems and we are very happy that Holistics provides not only a quick response but also a cooperative one.
To sum up, we are very satisfied with Holistics feature and what it has in store for us. Of course, every case might have its own preferences, but for our cases, Holistics is definitely the one.
“Hollistics has been really helpful to help us to democratize our customers data through visualization in order to help to identify key opportunities and to focus on what matters.” - Thibaud Plaquet, Chief Business Officer at Datanest
Article written by Monica Stephanie — Datanest