Make Tableau work better for you with Holistics
Tableau is a great data visualization tool to help data teams provide senior executives with summarized data. However, there is typically lots of work that data teams need to work on outside Tableau for use-cases that Tableau is not designed for.
These are the 5 key areas that Holistics can help Tableau customers in:
- Tabular Reporting: Free your business from the 16 column limitations of Tableau. With Holistics, you can build and share flexible large tabular reports with your business team which they may be forced to do outside of Tableau.
- Improve Query Performance: Instead of spending time preparing materialized views, refreshed extracts, or to setup your own data warehouse to improve your Tableau query performance, Holistics optimizes your data infrastructure to support fast Tableau queries
- Build Complex Reports: Use Tableau for simple summarized dashboard, and Holistics to build reports that trace root-cause analysis, or more advanced adhoc analysis where the data is not prepared.
- More Sharing Options: Instead of being restricted to subscribed views in Tableau, Holistics provides you multiple ways and formats to share your insights via shareable links, schedule automated emails, setup alert thresholds, and automate file exports to SFTP and Google Sheets output.
- Data Governance: Managing data access control for companies with cross-functional teams across geographies, roles, and products may not be the easiest for Tableau customers. Holistics makes it easy to control data access without the need to create multiple backend database user credentials, and duplicate multiple dashboards and reports.
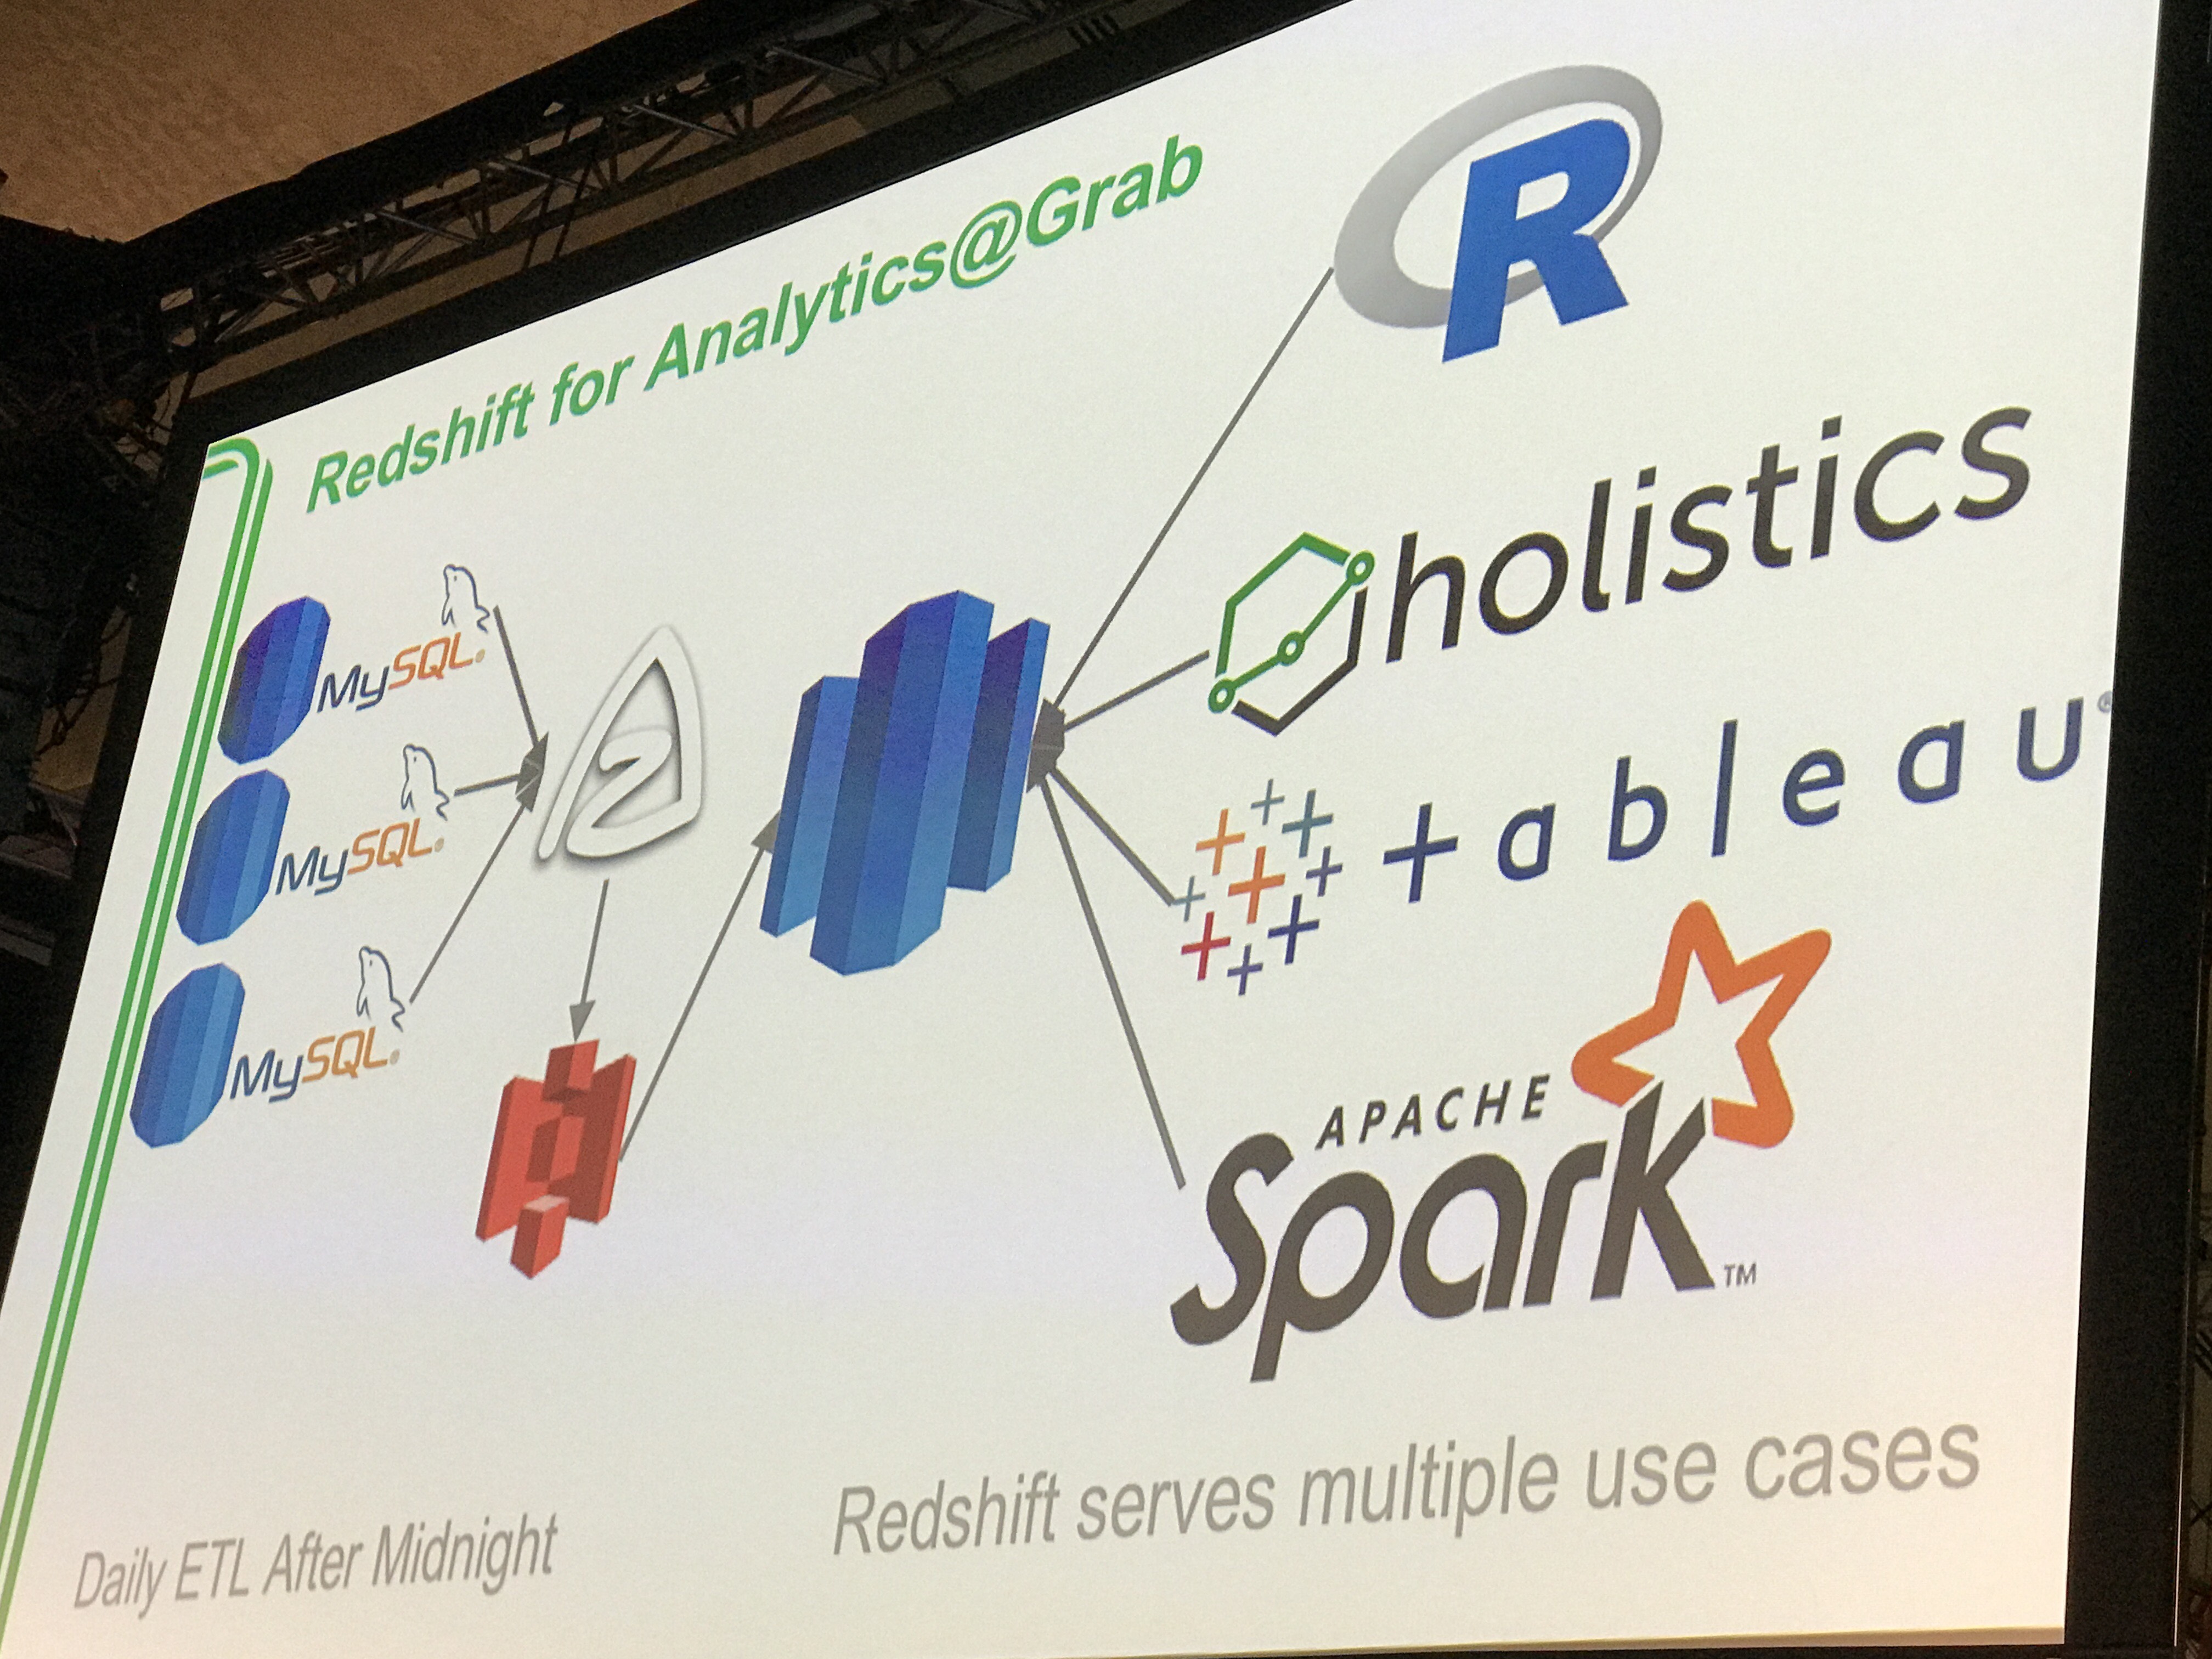
Holistics featured at Grab Engineering's presentation at AWS Summit Singapore 2017, alongside with Tableau
1. Overcome Tableau 16 Column Limits Table Display with Holistics
If you have users that need to access or download raw data, Tableau may not be intuitive for them. With a 16 column limits on table views, Tableau is not designed to display large tables with multiple columns.
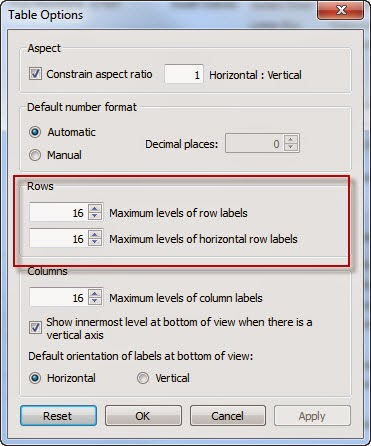
While this does not impact the summarized dashboards for senior management, it may be important for some business teams who wants to download these data into spreadsheets like Excel/CSVs for further root cause analysis. There's limited flexibility in Tableau for numeric/table reports, or for use-cases where you want to get data to the detailed level (which Tableau is not designed to achieve).
Holistics for Large Tables Reporting
If you want the flexibility to display large tables with multiple columns outside of Tableau, Holistics can help. You can display tables with over 16 columns (or any number), and these data can be easily made available for your business teams to download. You can even schedule these data to be (1) automatically emailed to your business team to save them time from accessing and downloading data, or (2) export these data automatically to Google Sheets.
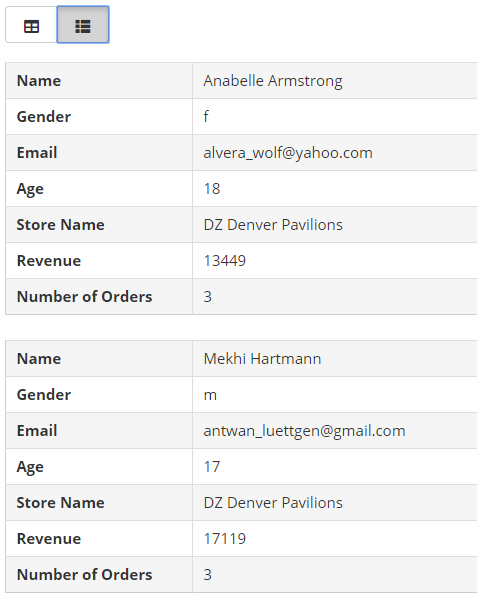
In addition, Holistics lets you toggle between 2 views for tables - The normal table view, or a record-based view. And a sweetener on top of this is the ability to have row numbers besides your record.
Holistics Table View

Holistics Record View
2. Overcome Tableau Performance Issues with Holistics
Tableau offers 2 ways to connect your source data - Live Connection (for most RDBMS database), or Tableau Data Extracts (TDEs). Each of these connection methods come with their pros and cons.
While Tableau Live Connections work well (and is now the preferred way with affordable MPP data warehouse technologies) to provide real-time data, it can run into performance issues when querying and processing large data-sets. While this performance issue is not unique to Tableau, their recommendations revolve around
- Finding your own way to generate Tableau Data Extracts (TDEs) from your source data and automate its refresh.
- Finding your own way to move (ETL) data from your source data to a separate data warehouse instance.
- If you are already running this off your data warehouse - find your own way to setup materialized views that you can query your data off.
Note that these approaches typically require the help of a skilled professional. Unless you already have a Tableau expert in your team, you typically need a data engineer, or a Tableau partner to address these issues.
Holistics can address the above 3 use-cases in your Tableau environment, saving you the need to decide between creating a Tableau Data Extracts (TDEs), or to scale up your current data infrastructure to help in your performance issues.
Step 1: Spin up your preferred data warehouse
You can spin up an empty new Google BigQuery or Amazon Redshift instance, and use Holistics Data Imports to move your source data into it. See below video on how you can create your own ETL (or data import) from your source data into any of your destination data warehouse.
Step 2: Automatically transform your data, store the results in your database
After moving your source data in, you can use Holistics Data Transforms to automate the creation (and refreshing) of materialized views in minutes. Check the below video to find out how you can setup materialized views to speed up your query performance. Because Holistics Data Transforms helps you write a table into your own database, you can run your Tableau visualizations off this materialized table that Holistics created for you.
3. Overcome Advanced Report Analysis Limitations in Tableau
High learning curve for advanced report analysis in Tableau
Tableau does not have the most intuitive learning curve for data teams (developers and analysts). While data analysts can summarize and group data well, it is very limited to use case involving count distinct and usually requires a "hack" to get most things working. For example, combining sums and count distinct in a single sheet is not easy, especially when dealing with calculated grand totals.
The way Tableau works (as a drag-and-drop interface) may not be intuitive to a SQL-trained person familiar with data thinking, making it more difficult to run advanced analysis in Tableau. This complexity ramps up quite steeply and isn't always intuitive when trying to produce more complex reports.
"More advanced functions can require significantly more time to set up, and some of the other functions can be a little mysterious in how they work. For the visualizations, it can take some time and knowledge to effectively get what you want visualized, and it's not always clear what you need to do differently when things go wrong." - Tableau online review
As a result, data analysts may find themselves constantly looking around for the way to build their reports, or to request for skilled data engineers or Tableau developer to prepare the datasets outside of Tableau. For example, it may take a fair bit of work to create reports that answer the below questions without first preparing the data outside Tableau.
- How many users made their first purchase in the past week?
- How many users bought at least 3 items from us in the past month?
- How many users bought a book from at least 2 out of 3 genres in the past year?
Tableau focuses on the tip of the iceberg for data preparation
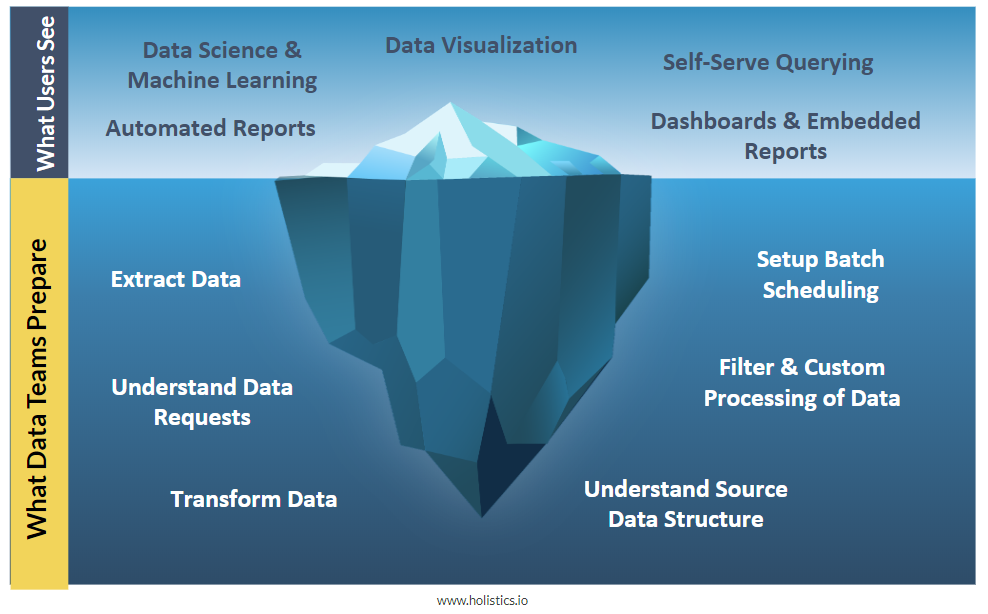
While Tableau makes it easy for data explorers to view and explore dashboards prepared by their data teams, some of them may be overwhelmed by the multiple ways to filter and customize the data shared with them.
As a dashboarding tool, Tableau is easy to use, but there is a learning curve. There's a lot of functionality to unlock, and, without a significant time investment, you're just not going to get all the benefit.
This is a typical example of the iceberg issue that goes into preparing automated reports and dashboards. While most business team members only see the tip of the ice-berg (charts, metrics, automated refreshes), the reality is that data teams have to do a lot of work behind the scenes to make these data available.
Although Tableau has launched their data preparation tool recently, it seems more like a simple alternative to Alteryx, their long-time data preparation partner (before Tableau launches this product). It's not very clear how their desktop creator (for building reports) and data prep tool can/should work together in an integrated manner outside of 2 silo products.
Holistics makes it intuitive for Tableau analysts to build advanced data analysis and reports
Holistics handles the heavy lifting of the data preparation work beneath the iceberg. Your Tableau reports can run off the data that Holistics has moved and transformed within your own database so your Tableau dashboard continues to show the most up-to-date data.
Window Functions, Custom Table Expressions (CTEs) and Sub-Queries for Tableau
If you can think about the data you need to display in data terms that you need, you can create window functions, custom table expressions (CTE), or nested sub-queries to extract the specific results-set for analysis. If this data works for you, you can either visualize it as a published report in Holistics, or use Holistics data transforms to easily create a materialized table using SQL (automatically updated with fresh data), stored within your own database that Tableau can query off.
A dedicated data workspace for Tableau analysts to run adhoc queries
Tableau is not SQL-friendly, which makes it difficult for some Tableau analysts to run and test adhoc queries. The non-SQL friendly experience goes beyond explicitly discouraging the use of custom SQL (due to possibility of performance overheads) to providing a bare-bone text editor for data sources added through custom SQL queries.
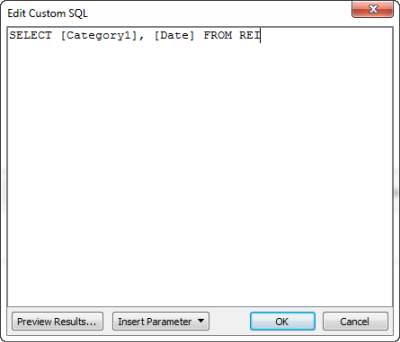
Some Tableau analysts overcome this by installing a separate SQL editor (typically on their desktop) to validate their query results, before visualizing them in Tableau.
Holistics provides an intuitive data workspace for analysts to run adhoc queries, and also to share it easily with other team members for quick one-off analysis. They can also visualize the results of the SQL queries into an existing dashboard.
4. More Options to Share Data Beyond Tableau
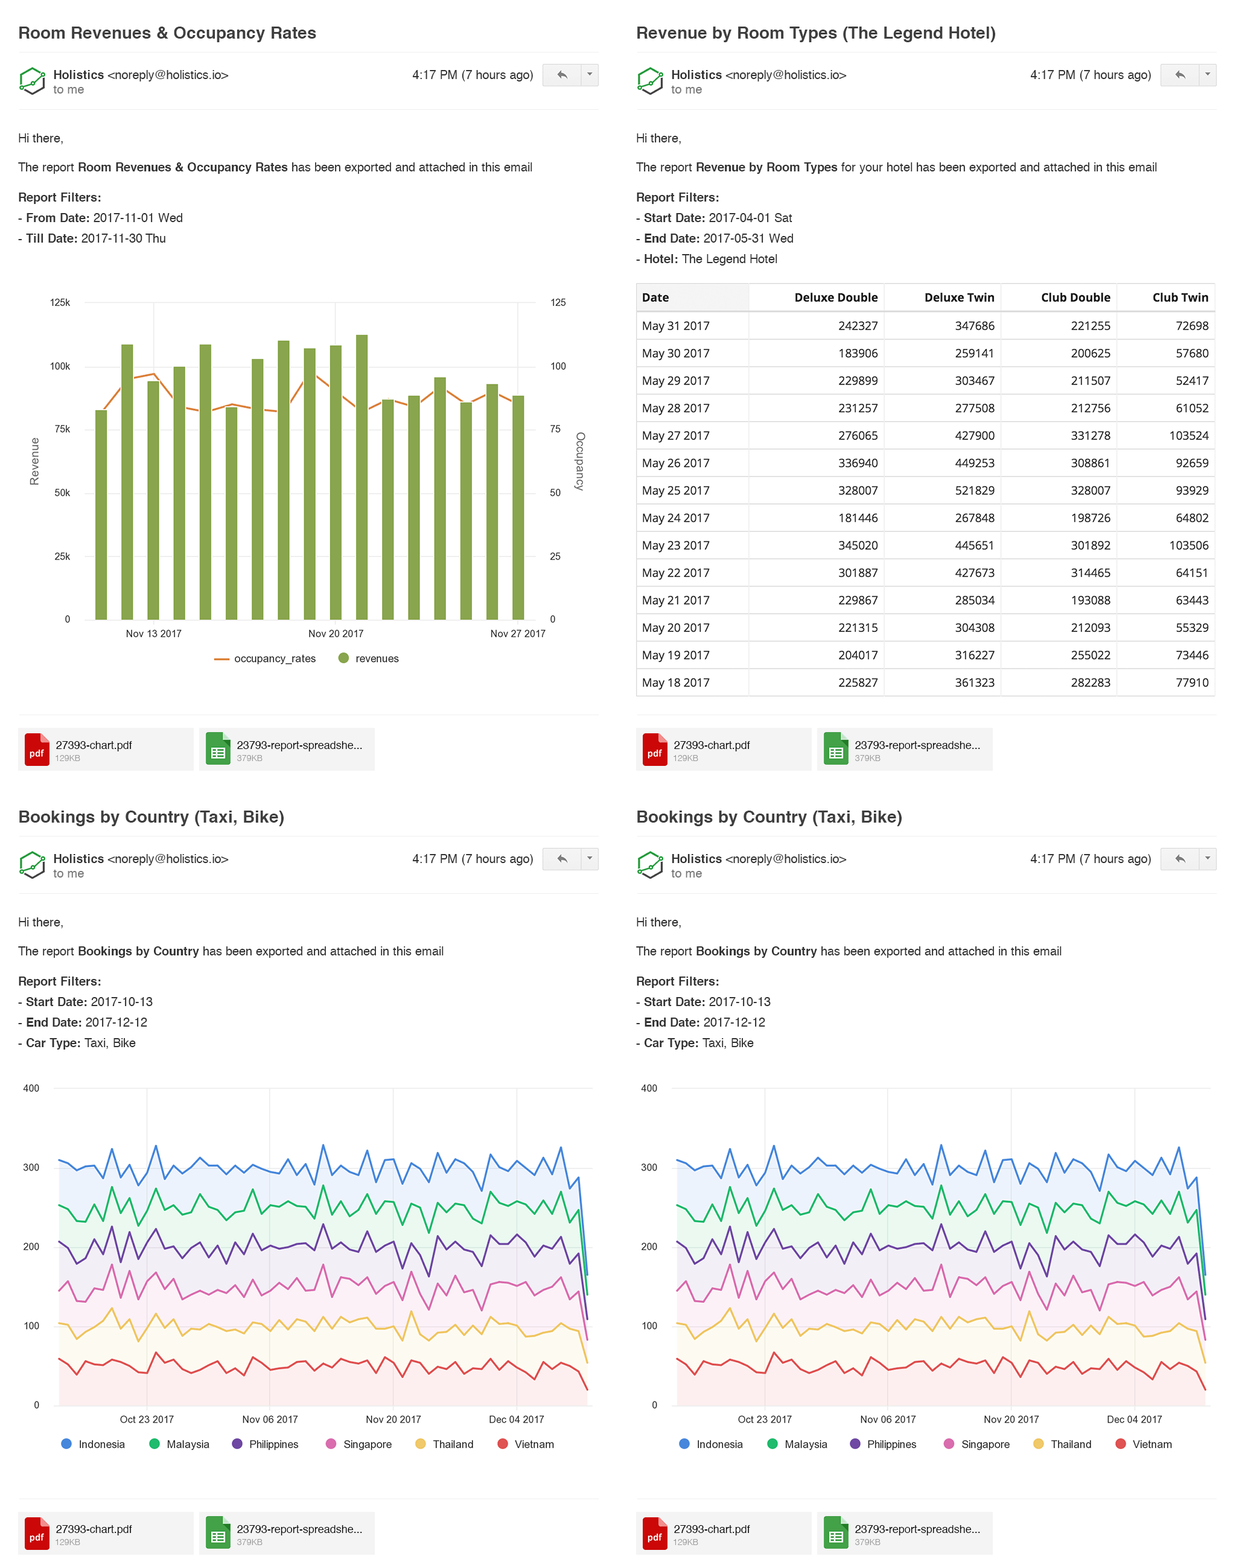
Automated Email Reporting
If you want more flexibility beyond Tableau's way of subscribing to dashboard report emails, Holistics allows you to schedule email reports to any recipients of your choice. This lets you sends automated email reports to non-Tableau users.
Shareable Links
If you just need to send a temporary dashboard or chart to a third party who does not require full user access to your internal Tableau dashboards on an adhoc basis, you can create the dashboard in Holistics and send them shareable links. These shareable links allow your non-Tableau users to easily access data for the use-case that they need.

Learn more information on shareable links from our docs.
SFTP Exports
Holistics lets you automate and schedule the exports of CSV and Excels into any SFTP destination folder. You can then connect to these spreadsheets using Tableau to run your analysis.

Google Sheets Exports
If your team wants to works with live data on Google Sheets, it may not be that easy to do so from Tableau. Holistics can help to automate the export of your database data to a specific Google Sheet link that your team can use for further analysis.
5. Data Governance
A single copy of truth for everybody
If you have a large team of Tableau analysts and users, it may not be that easy (though not impossible) to maintain a consistent set of records (and common definitions) with Tableau. It's easy to have multiple different workbooks with similar data, and it may be difficult to find out which is the agreed version of data across different teams.
For your operation and performance reporting metrics, Holistics provides you an easy way to centrally manage your report queries, and also track your query revision history so you can track how your queries change over time, and who changed it.
Password Protected Sharing
If you are concerned about data governance when you share data through automated emails or shareable links, Holistics allows you the option to add a password protect option to them. This gives an additional layer of security control before anyone can access the data you want to share with them.

Can I use Holistics without Tableau?
Yes you can choose to use Holistics independently if you do not have a strong need for complex visualizations and storytelling. Because Tableau has been around for so long, we also worked with customers who has already established some dashboard and basic processes around Tableau.
While they are happy with Tableau for the dashboards they have prepared, they see value in Holistics helping them be more productive in their data analytics operation activities, which typically exist outside of Tableau.
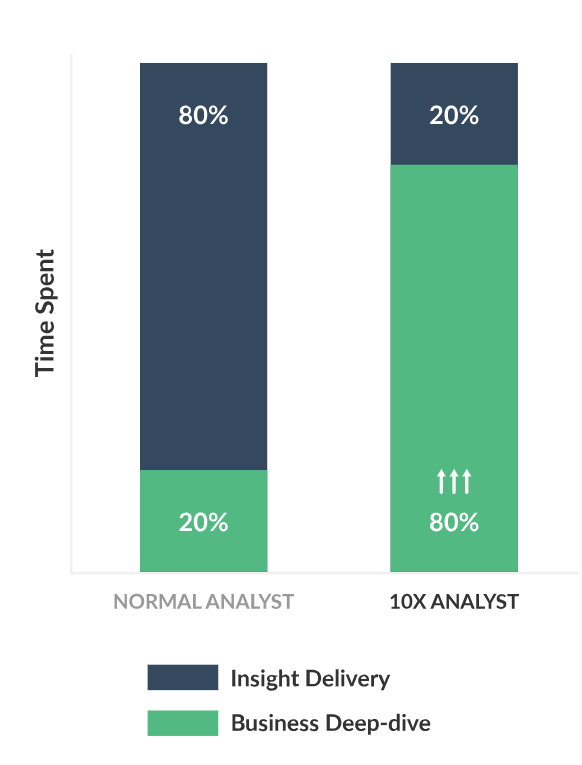
In doing so, data teams can free up time and inter-team communication overheads when preparing data for Tableau. The time freed up from insight delivery enables your analyst to now spend more time for business deep-dive, empowering your data teams to be 10x more effective in their daily roles.
If you do not have any obligation to work with an existing Tableau setup in your organization, you can consider using Holistics independently as a modern BI tool developed for your data reporting needs in the age of big data analytics. You can always have Tableau to complement Holistics later on for more variety of visualizations that goes beyond what Holistics offer!
What's happening in the BI world?
Join 30k+ people to get insights from BI practitioners around the globe. In your inbox. Every week. Learn more
No spam, ever. We respect your email privacy. Unsubscribe anytime.

