Using Holistics
Holistics Power-ups
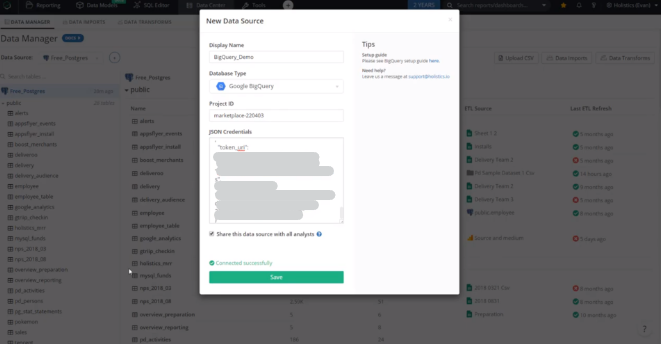
Data Modeling
Holistics Data Modeling, Explained
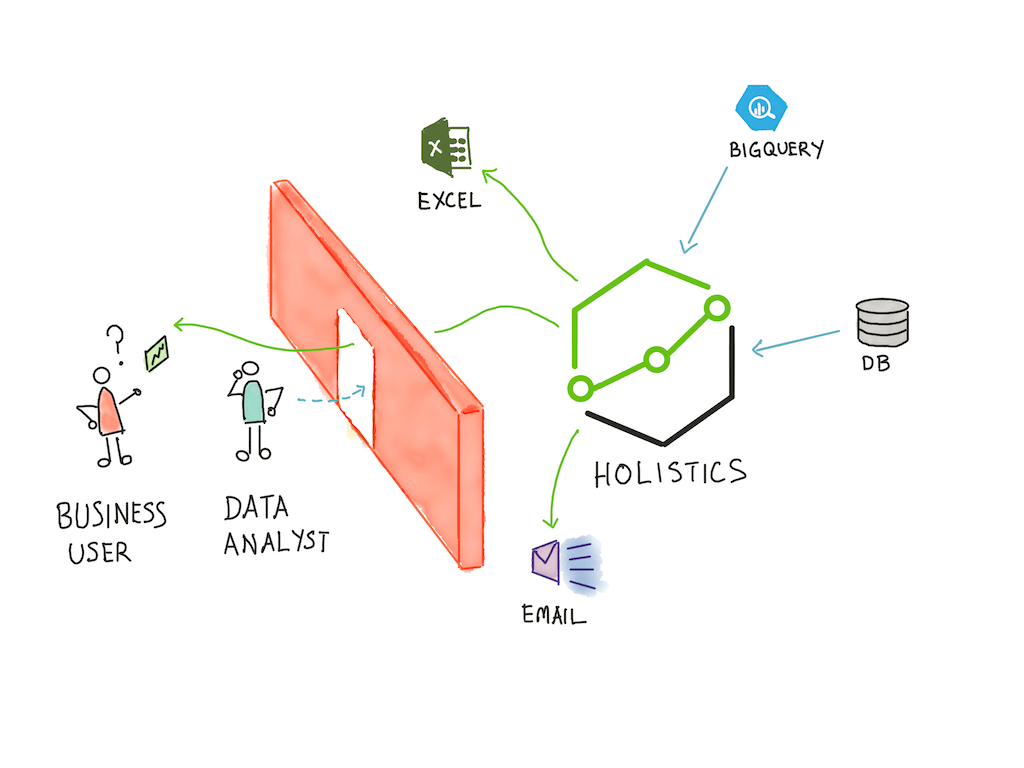
Holistics's data modeling layer allows data teams to radically increase their productivity. No repeated queries. Self-serve reports and dashboards. Here's how it works.