How We Built Our MRR Dashboard (Using Pipedrive & Holistics)
Want to customize and automate MRR reporting, to suit your company's specific data needs? Luckily, Holistics integrates with Pipedrive, here's our guide!
You've been building your startup online for a while now, and your customer count is growing. Your remote sales team has been closing deals across various countries, and you're looking to automate your monthly recurring revenue (MRR) calculations and reports, to share with your internal team and investors.
Like most B2B companies out there, we use a Sales CRM platform to manage our deal flow. We're currently on Pipedrive due to its ease of use. Unfortunately, Pipedrive doesn't have native support for recurring revenue. But it has a strong, extensive API that can integrate with other tools very well. So since we're a data company, we thought why not build something ourselves to cater for this!
If you're using a service like Stripe or Braintree, you can probably connect directly to tools like Baremetrics, which gives you formatted pre-made dashboards. In our case, our data doesn't sit in Stripe, and we even have enterprise customer accounts who pay us through bank tranfers.
Step 1: Model A Database Schema For Recurring Revenue
Unlike ecommerce transactions where it's relatively straightforward to model your database (starting with 4 tables: users, products, orders and order_items), modeling SaaS recurring revenue is a lot trickier.
We looked around the net and couldn't find any existing technical designs for this. So we thought we'd just build one.
For every deal, we add a few custom attributes:
- Payment Type: One-off, Monthly, Annually
We have some custom-built integrations, so when a customer signs up, a deal is added to Pipedrive, and this deal gets updated with more details about their account.
To account for churn (which happens, and still hurts), we add a "won" deal in Pipedrive with a negative deal value.
Step 2: Getting The Data Into Our Data Warehouse
Next, we use Holistics' Data Preparation features to get our Pipedrive sales data into our data warehouse (which runs on BigQuery). Holistics has a direct integration with Pipedrive, so this is very straightforward.
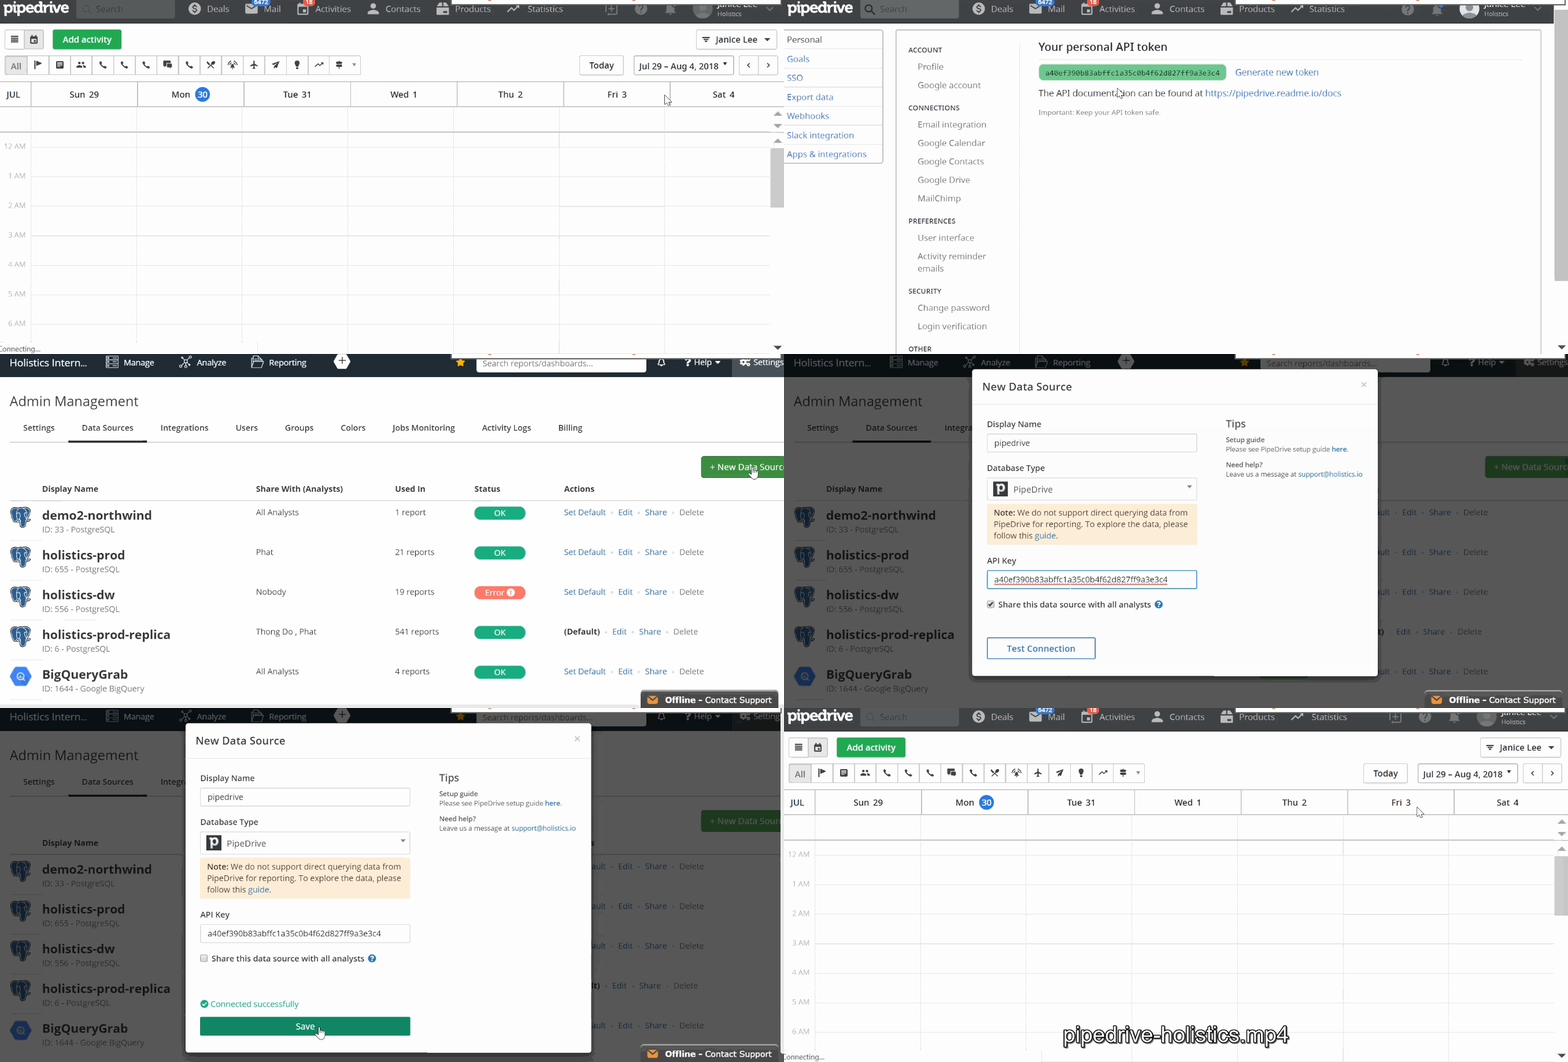
In Pipedrive, engineers can create APIs to get more information that is not included in the default tables. We needed additional information such as customer_id, country, subscription_type etc., that we had to set-up manually on Pipedrive. Previously, we would export data from Pipedrive to Excel and create reports, charts and aggregate numbers on that (yuck). Because the process was so manual, it was very hard for us to track our current MRR instantly.
Once imported, the data sits in these nice, clean tables: deals, people, organizations. The sync happens automatically everyday in Holistics, so we don't have to worry about manual data updates.
Using Data Imports on Holistics, we could schedule and move data directly from Pipedrive to Holistics using their API. Our developers could also add more columns into Pipedrive, and extract these with a hash key.
Step 3: Building The MRR Dashboard
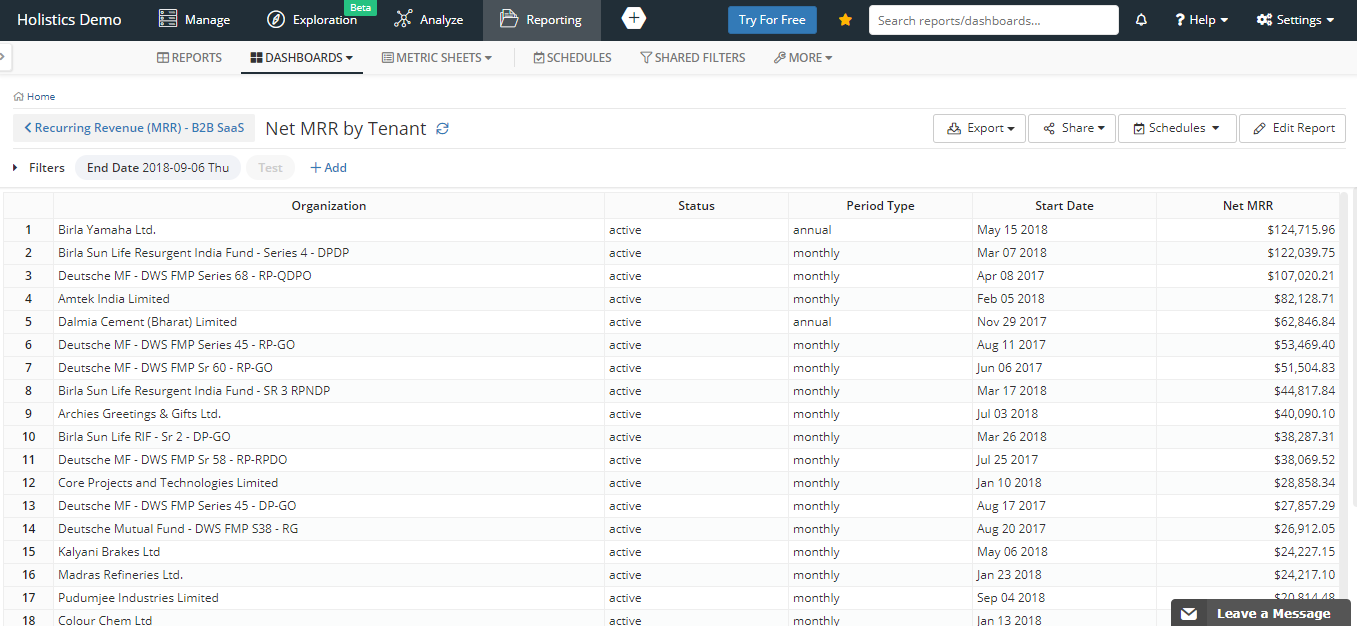
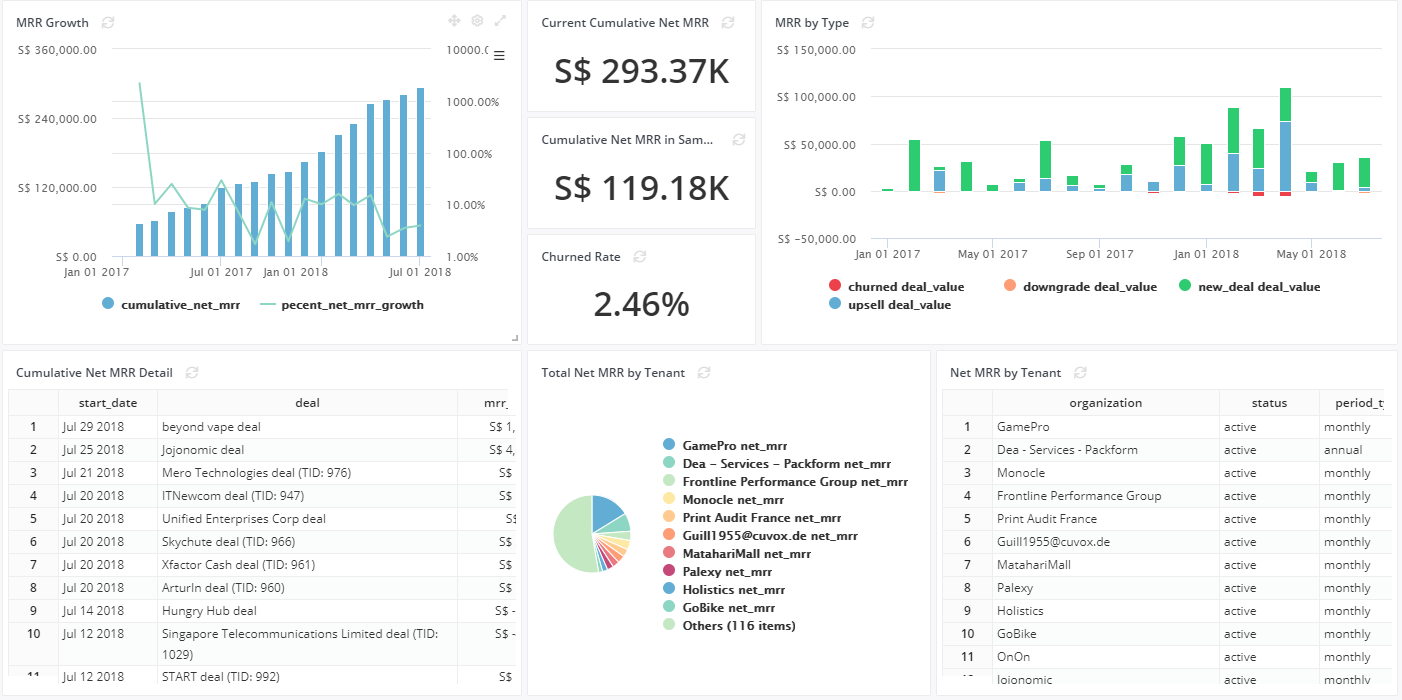
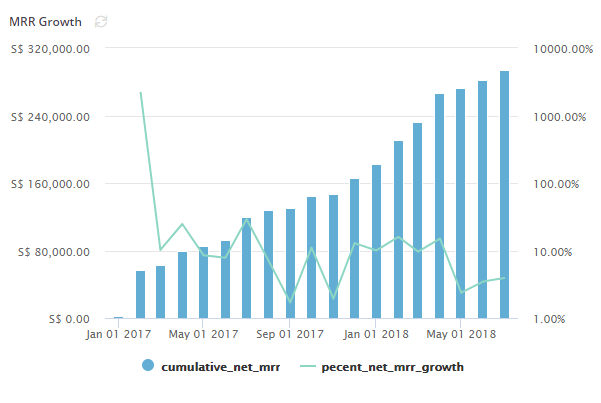
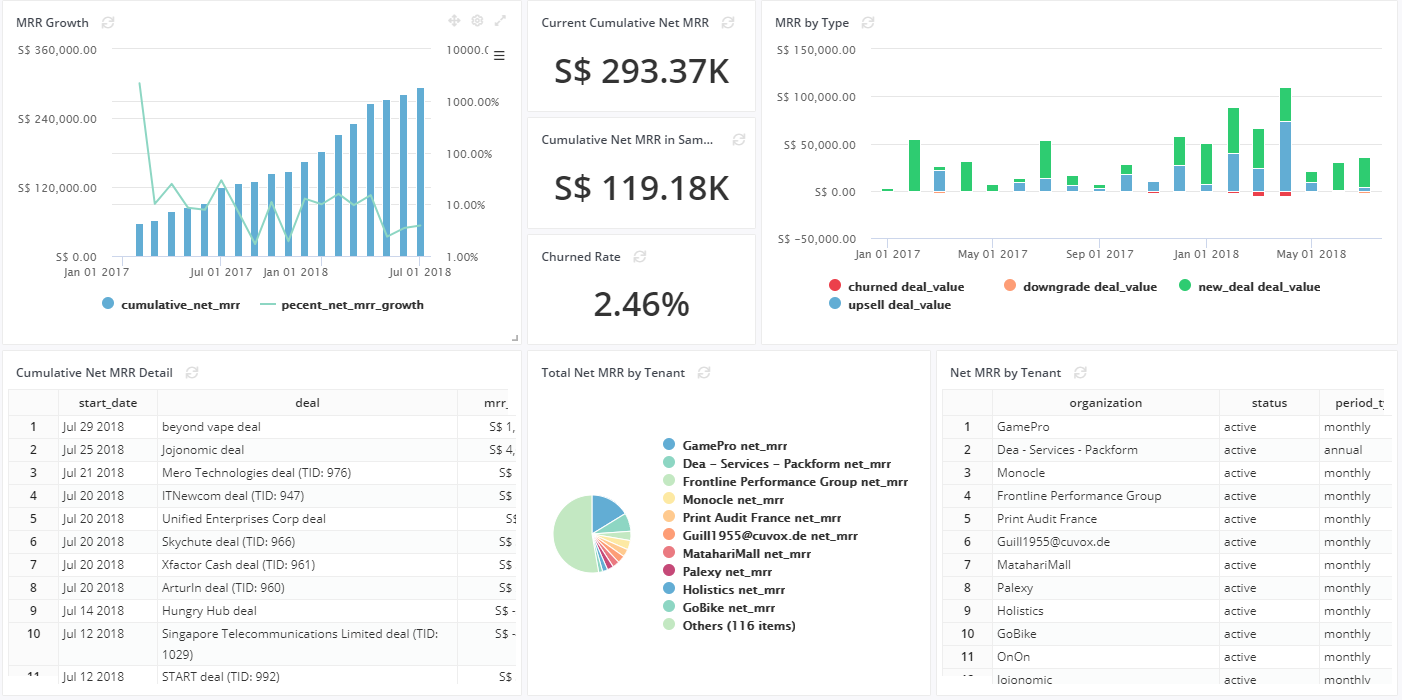
The last step of the puzzle is to build up the MRR Dashboard using Holistics' Reporting features. Within just 2 days with her expert database and SQL skills, our data analyst quickly drafted up these amazing, detailed dashboards.

Values in the Pipedrive pd_deal table is the price that users pay us this month. In Holistics, customers can pay on a monthly or annual basis, with a mix of users and usage-based pricing.
- Monthly: Customers make monthly payments, this is a positive number.
- Annually: Customers will pay payment for a year, so we will divide the figure by 12 months for this calculation, to arrive at a positive monthly figure.
- One-off: Customers make a one-time payment, attributed to the month that payment is received, and is a positive number.
- Upsells: Customers upgrade their plans, and add-on more objects and users. The value reflects the higher amount that customers pay for, and is a positive number.
- Churned: Customers that cancel their subscription. The value is the amount that customers would have payed for this month, and is a nagative number.
- Downgrades: Customers downsize their plan types, and reduce their objects and user count. The value is the amount that customers reduced their subscription by, and is a negative number.
On our own data records, we can then label the subscription types, and the revenue event that occurred.
{"options": [
{
"id": 1,
"label": "New Deal"
},
{
"id": 2,
"label": "Monthly"
},
{
"id": 3,
"label": "Annual"
},
{
"id": 4,
"label": "Upsell"
},
{
"id": 5,
"label": "Downgrade"
},
{
"id": 6,
"label": "Churned"
},
{
"id": 7,
"label": "Switch Period"
},
{
"id": 8,
"label": "Professional Services"
},
{
"id": 9,
"label": "One-Off"
}}
Based on this concept, we use created_at to indicate the base month, and calculate MRR using window functions.
sum(sum(value * csgd.rate / c.rate)) OVER (order by (won_time + interval '1 day')::date) AS "Cumulative Amount (SGD)"
This way we can calculate cummulative MRR amounts for the following month.
select (won_time + interval '1 day')::date as "Start Date",
     sum(sum(value * csgd.rate / c.rate)) OVER (order by (won_time + interval '1 day')::date) AS "Cumulative Amount (SGD)"
from public.pd_deals pd
    left join ({{ @currency() }}) as c on c.code = pd.currency
    left join ({{ @currency() }}) as csgd on csgd.code = 'SGD'
where subscription_type is not null and status = 'won'
      and subscription_type NOT SIMILAR TO {{ @exclude_subcription_type() }}
group by 1
order by 1
You may notice our {{ @example() }} SQL variables, this is a unique Holistics feature called Query Templates, that allows us to reference a commonly-used block of SQL code that appears in several reports. This let us quickly make changes to our MRR calculations across several reports and dashboards, as updating the underlying template will push the changes out to all other reports and dashboards that use the template.
And there you go, your MRR dashboard is ready to face the world!
In part 2 (coming later), we'll share more for those of you who are data analysts (and aspiring data types), on the specifics of how we built these dashboards inside Holistics, like handling annual/monthly logic for dates etc.
What's happening in the BI world?
Join 30k+ people to get insights from BI practitioners around the globe. In your inbox. Every week. Learn more
No spam, ever. We respect your email privacy. Unsubscribe anytime.

