10 Metabase Alternatives for Embedded & Internal Analytics
Metabase is a go-to for startups and small teams— but it starts to fall behind when you need more flexibility and control, and that’s when you’ll find yourself searching for an alternative. In this article, we'll look into 10 best alternatives, their pros, cons, and pricing.

Contents
Metabase is a go-to for startups and small teams. It’s open-source, user-friendly, and doesn’t require a data science degree to get started. However, it starts to fall behind when you need more flexibility and control, and that’s when you’ll find yourself searching for an alternative. If you’re looking for a tool that scales better or has more advanced features, there are plenty of options worth exploring.
Metabase At A Glance: Pros and cons
Metabase Pros
Metabase definitely has its strong points, it offers a simple approach that appeals to companies looking for something straightforward. Let’s break down some of the reasons why Metabase has earned its spot in the BI toolset.
Free (or close to it)
One of the biggest selling points of Metabase is that it’s free. You’re not stuck convincing the boss to shell out thousands for a BI tool. Metabase’s open-source model makes it an easy win for teams on a budget who need to get something up and running fast. Plus, it’s got enough features to keep smaller teams happy without the need for a big investment.
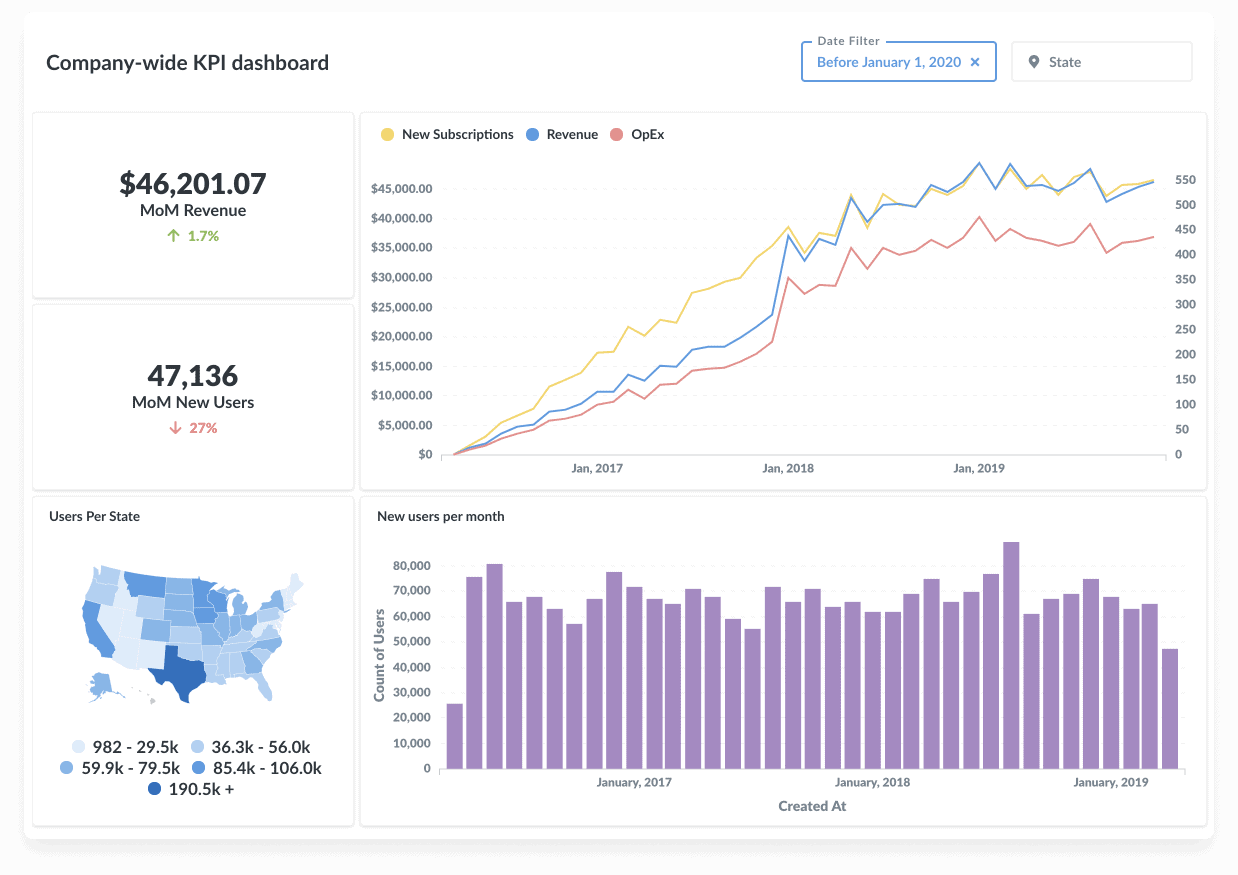
Simple Data Visualization
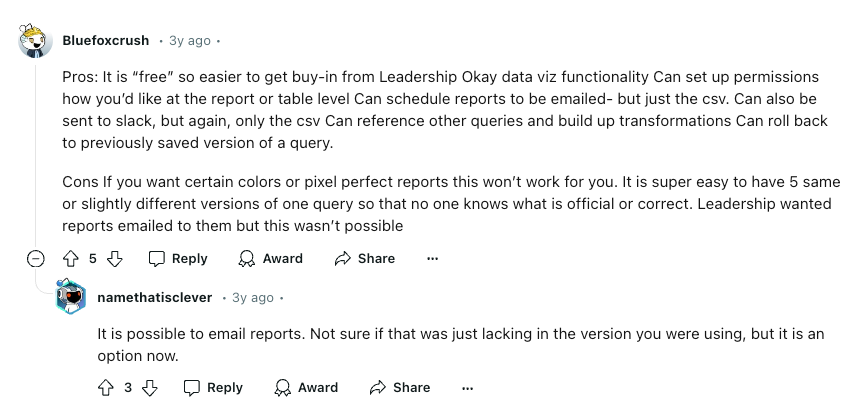
Metabase gets the job done when it comes to basic data visualization. It’s not the flashiest tool out there, but if you need to spin up some quick charts or dashboards without needing a designer, it’ll do the trick. According to users on r/BusinessIntelligence, it offers "okay data viz functionality," which is a win for teams that need something easy and straightforward.
Scheduling and Automating Reports
Need to send reports regularly? Metabase has you covered. It allows you to schedule reports to be emailed (although it’s just CSVs), and you can even shoot those reports over to Slack. Sure it’s not the most robust automation, but for most small teams, it gets the job done.
Metabase Limitations
Metabase has its strengths, but it’s not all smooth sailing. Once your team grows or your data gets more complicated, a few cracks start to show. From limited collaboration features to missing advanced customization, Metabase can start feeling like it’s out of its depth. So, let’s look at where it might fall short.
Limited Self-Service Analytics
One of Metabase’s biggest drawbacks is its limited capacity for true self-service analytics. Business users are often stuck with pre-made SQL queries, so exploring data beyond the basics? Not happening. This ends up putting a lot of pressure on data teams, who get bogged down with constant ad-hoc requests and maintaining custom SQL, which, let’s face it, isn’t great for productivity and creates unnecessary bottlenecks.
No Version Control
As your team grows and more people start using Metabase, tracking who's changing what can quickly become a real headache.
Metabase didn’t design their product with version control in mind. In order to support version control, the BI tool itself needs to be code-first, and Metabase is not. Its suggestion to use serialization is a poor fit as it's clunky one way: build dashboards in the UI -> run script -> serialized code -> push to Git. On the other hand, the ideal Git-based experience should be two-way: You make changes in the app -> auto-push to Git, and vice versa, make changes in Git -> auto-update in the app.
Not to mention, you’ll need to be on the Pro plan, which starts at $500+, to access Serialization.
Without version control, it’s easy for teams to lose track of updates or changes to queries, which makes it hard to keep reports consistent. Before you know it, different versions of the same report start piling up, leading to confusion and inaccurate results.
Disparate SQL Metric Definitions
As the number of reports grows, analysts end up with multiple different SQL definitions of the same business logic, scattered across the entire system making bulk-update impossible. Data consumers turn into data skeptics as different reports give different values for the same metric.
User Experience and Collaboration Issues
Metabase wins points for simplicity, but when it comes to user experience—especially for collaboration—it’s a different story. Reddit users aren’t shy about calling out the dashboard functionality as clunky and unintuitive, falling short of the polish you’d expect for large-scale teamwork.

Not to mention the lack of features like color customization or pixel-perfect report generation, it often disappoints teams used to more sophisticated BI tools.
Top 10 Metabase Alternatives For Growing Data Teams
1. Holistics
Holistics is a cloud-based BI platform that provides a code-based modeling layer and self-service BI features. Like Metabase, it lets you map your database tables into models and relationships, making them accessible to end-users for self-service exploration.
Holistics goes a step further, offering what Metabase lacks and introducing a few key innovations.
- Canvas Dashboard: Flexible canvas-based dashboard that allows the data team to curate a customized reporting experience.
- Analytics As Code: Every component of the analytics logic, from data models to dashboards, is stored and versioned in Git, allowing for full programmatic control and customization.
- Reusable BI Components: All BI components, from visualizations and dashboards to data models and metrics, can be parameterized and reused across the organization, fostering consistency and efficiency.
- Better Developer Experience: Holistics provides a powerful IDE-like environment, enabling analysts to work with analytics code with ease, leveraging features like auto-completion, syntax highlighting, and debugging tools.
- Intuitive Data Exploration: Common analytical functions (period over period, percent of total, etc, with more coming) are 1-click operations without the complex SQL setup.
Holistics pricing begins at $800/month with a usage-based model, letting data teams start small and scale up as needed, all without the burden of hefty upfront costs.
2. Tableau
Tableau is considered the best tool when it comes to visualization as it's their primary focus.
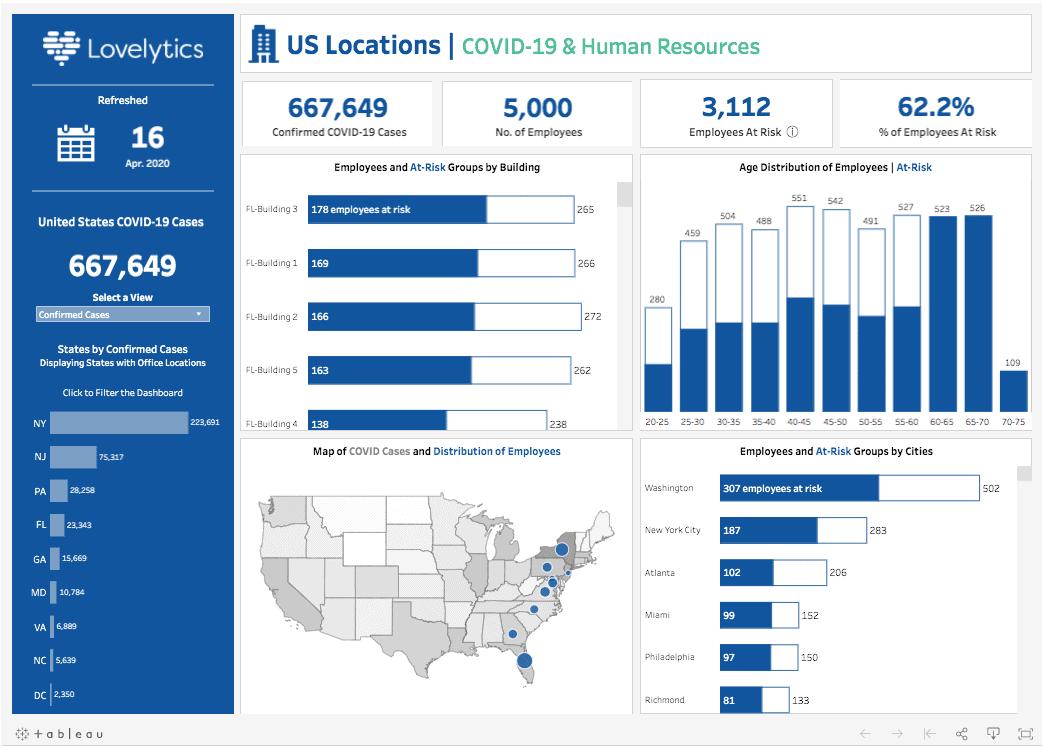
Tableau is a powerhouse for creating stunning data visualizations and interactive dashboards. With robust data connectivity options and features like Tableau Prep and Tableau Desktop, it’s perfect for teams that need deep analytical insights. It’s also well-suited for both desktop and cloud environments, giving teams flexibility in how they deploy and share reports. Tableau also offers embedded capabilities, enabling data teams to easily add user-facing analytics to their apps.
While Metabase translates everything to SQL, by default, Tableau uses their in-memory datastore, making it more difficult to debug when things go wrong (you can't look at the SQL query to troubleshoot).
Tableau is not exactly the cheapest option. Creator licenses start at $70/user/month, and you’ll need at least one to get started. Plus, there’s a learning curve if you’re new to data visualization tools. For companies that want to scale, the Premium plans start at $4,995/month, which includes advanced data management and dedicated support.
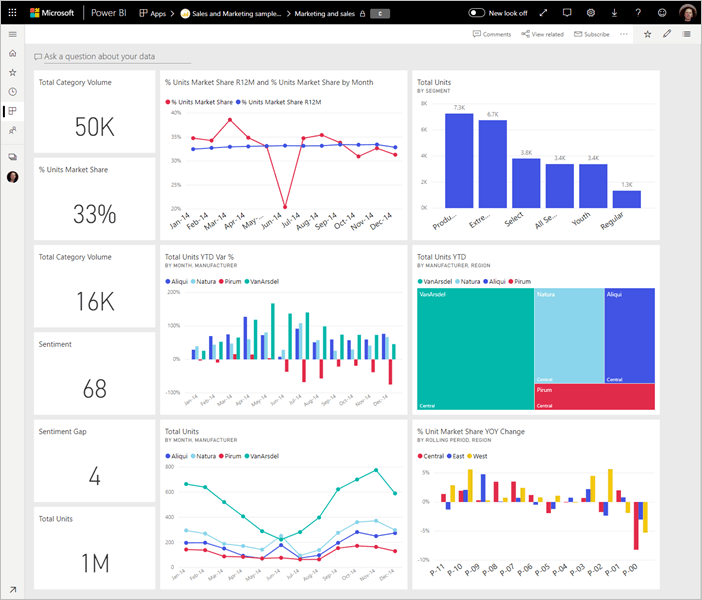
3. PowerBI
Power BI is Microsoft’s multi-tool for data, packed with real-time dashboards, AI-driven insights, and smooth integrations with Excel, Azure, and SharePoint. If you’re already in the Microsoft ecosystem, it’s an easy pick.
Similarities/Differences from Metabase: While Metabase translates everything to SQL, by default PowerBI uses their in-memory datastore and their proprietary language DAX, making it more difficult to debug when things go wrong (you can't look at the SQL query to troubleshoot).
PowerBI offers powerful analytical capabilities with DAX, yet, it can be challenging to learn for both technical and non-technical users which can further limit self-serve data exploration and dampen analysts’ productivity.
PowerBI’s workflow is also not designed to have code checked into the Git repository, making it difficult to manage changes, perform code branching, and maintain the accuracy of analytics logic. If you're not a Microsoft user, Power BI may not be the best fit since it doesn't support non-Microsoft operating systems like Linux or macOS.
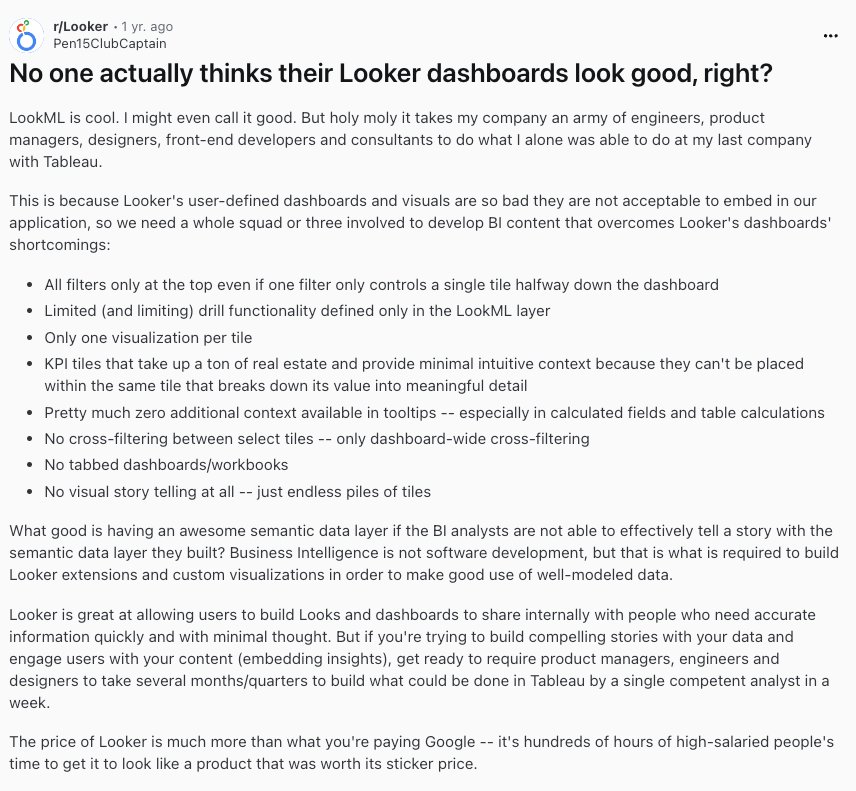
4. Looker
Looker (now part of Google) is quite a good BI tool to replace Metabase, but only if you're a big organization with a large budget.
Looker is a great innovative BI tool with a strong code-based semantic layer, Git version control, and self-serve analytics. Its powerful LookML language lets data teams define metrics and create reusable data models, making it easier to maintain consistent reporting. Plus, it offers a user-friendly interface, built to make data exploration accessible for both analysts and business users.
However, Looker’s flexibility comes with a learning curve. Mastering LookML can take some time, and if you don’t have a dedicated data team, getting the most out of Looker might feel a bit daunting. Pricing is another issue as Looker often comes with a hefty upfront cost. Smaller teams or startups might find it hard to justify the steep investment, especially since the cost can quickly scale with user count.
Looker users often share their concerns over Looker’s lack of friendly visualization options and support experience (after Google acquisition).

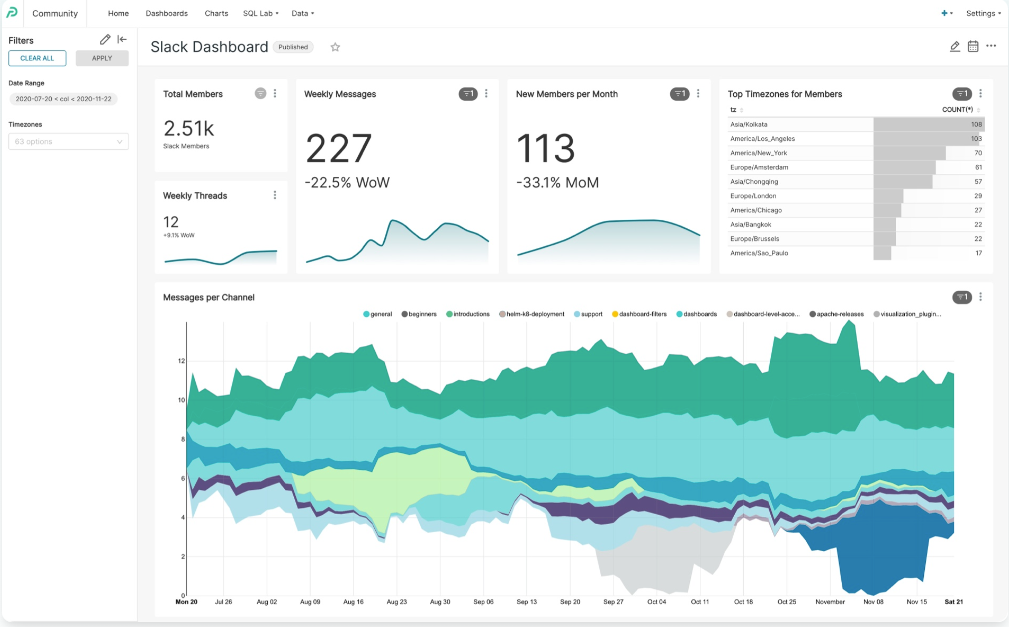
5. Preset
Apache Preset, built on the foundation of Apache Superset, is an open-source BI tool that’s packed with features for data exploration and visualization. It offers a wide range of charts, dashboards, and the ability to connect to almost any data source. Users also shared Preset offers more options than other tools in its price range.
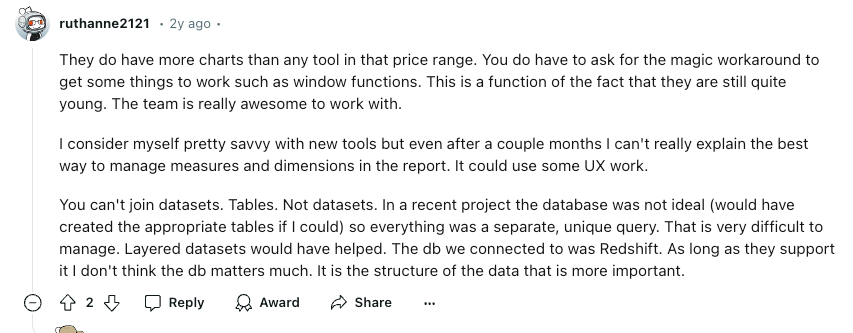
For teams that love customizing their tools, Preset’s open-source nature means you can tweak and extend it as much as you need. Being open-source like Metabase also makes it a budget-friendly choice for small data teams.
While Preset offers a lot of flexibility, it doesn’t quite have the polished, intuitive interface that some other BI tools offer. If you’re looking for a lot of out-of-the-box features like drag-and-drop exploration or simple sharing options, you might hit some roadblocks. Common analytical functions, like window functions, also require a cumbersome workaround, which seems to be a sign of their early-stage development.
Pricing starts with a free Starter plan (up to 5 users), while the Professional plan is $25/user per month. For larger teams, the Enterprise plan comes with custom pricing and features like managed private cloud deployments and advanced security.
For more blog posts about BI tool evaluation, check out:
6. Redash
Designed to make data exploration easier for everyone, Redash is a go-to tool for teams looking to run queries, visualize results, and create shareable dashboards—all from a browser. It supports both SQL and NoSQL queries, making it versatile for different data sources. Plus, being open-source, Redash offers the flexibility to customize it as needed.
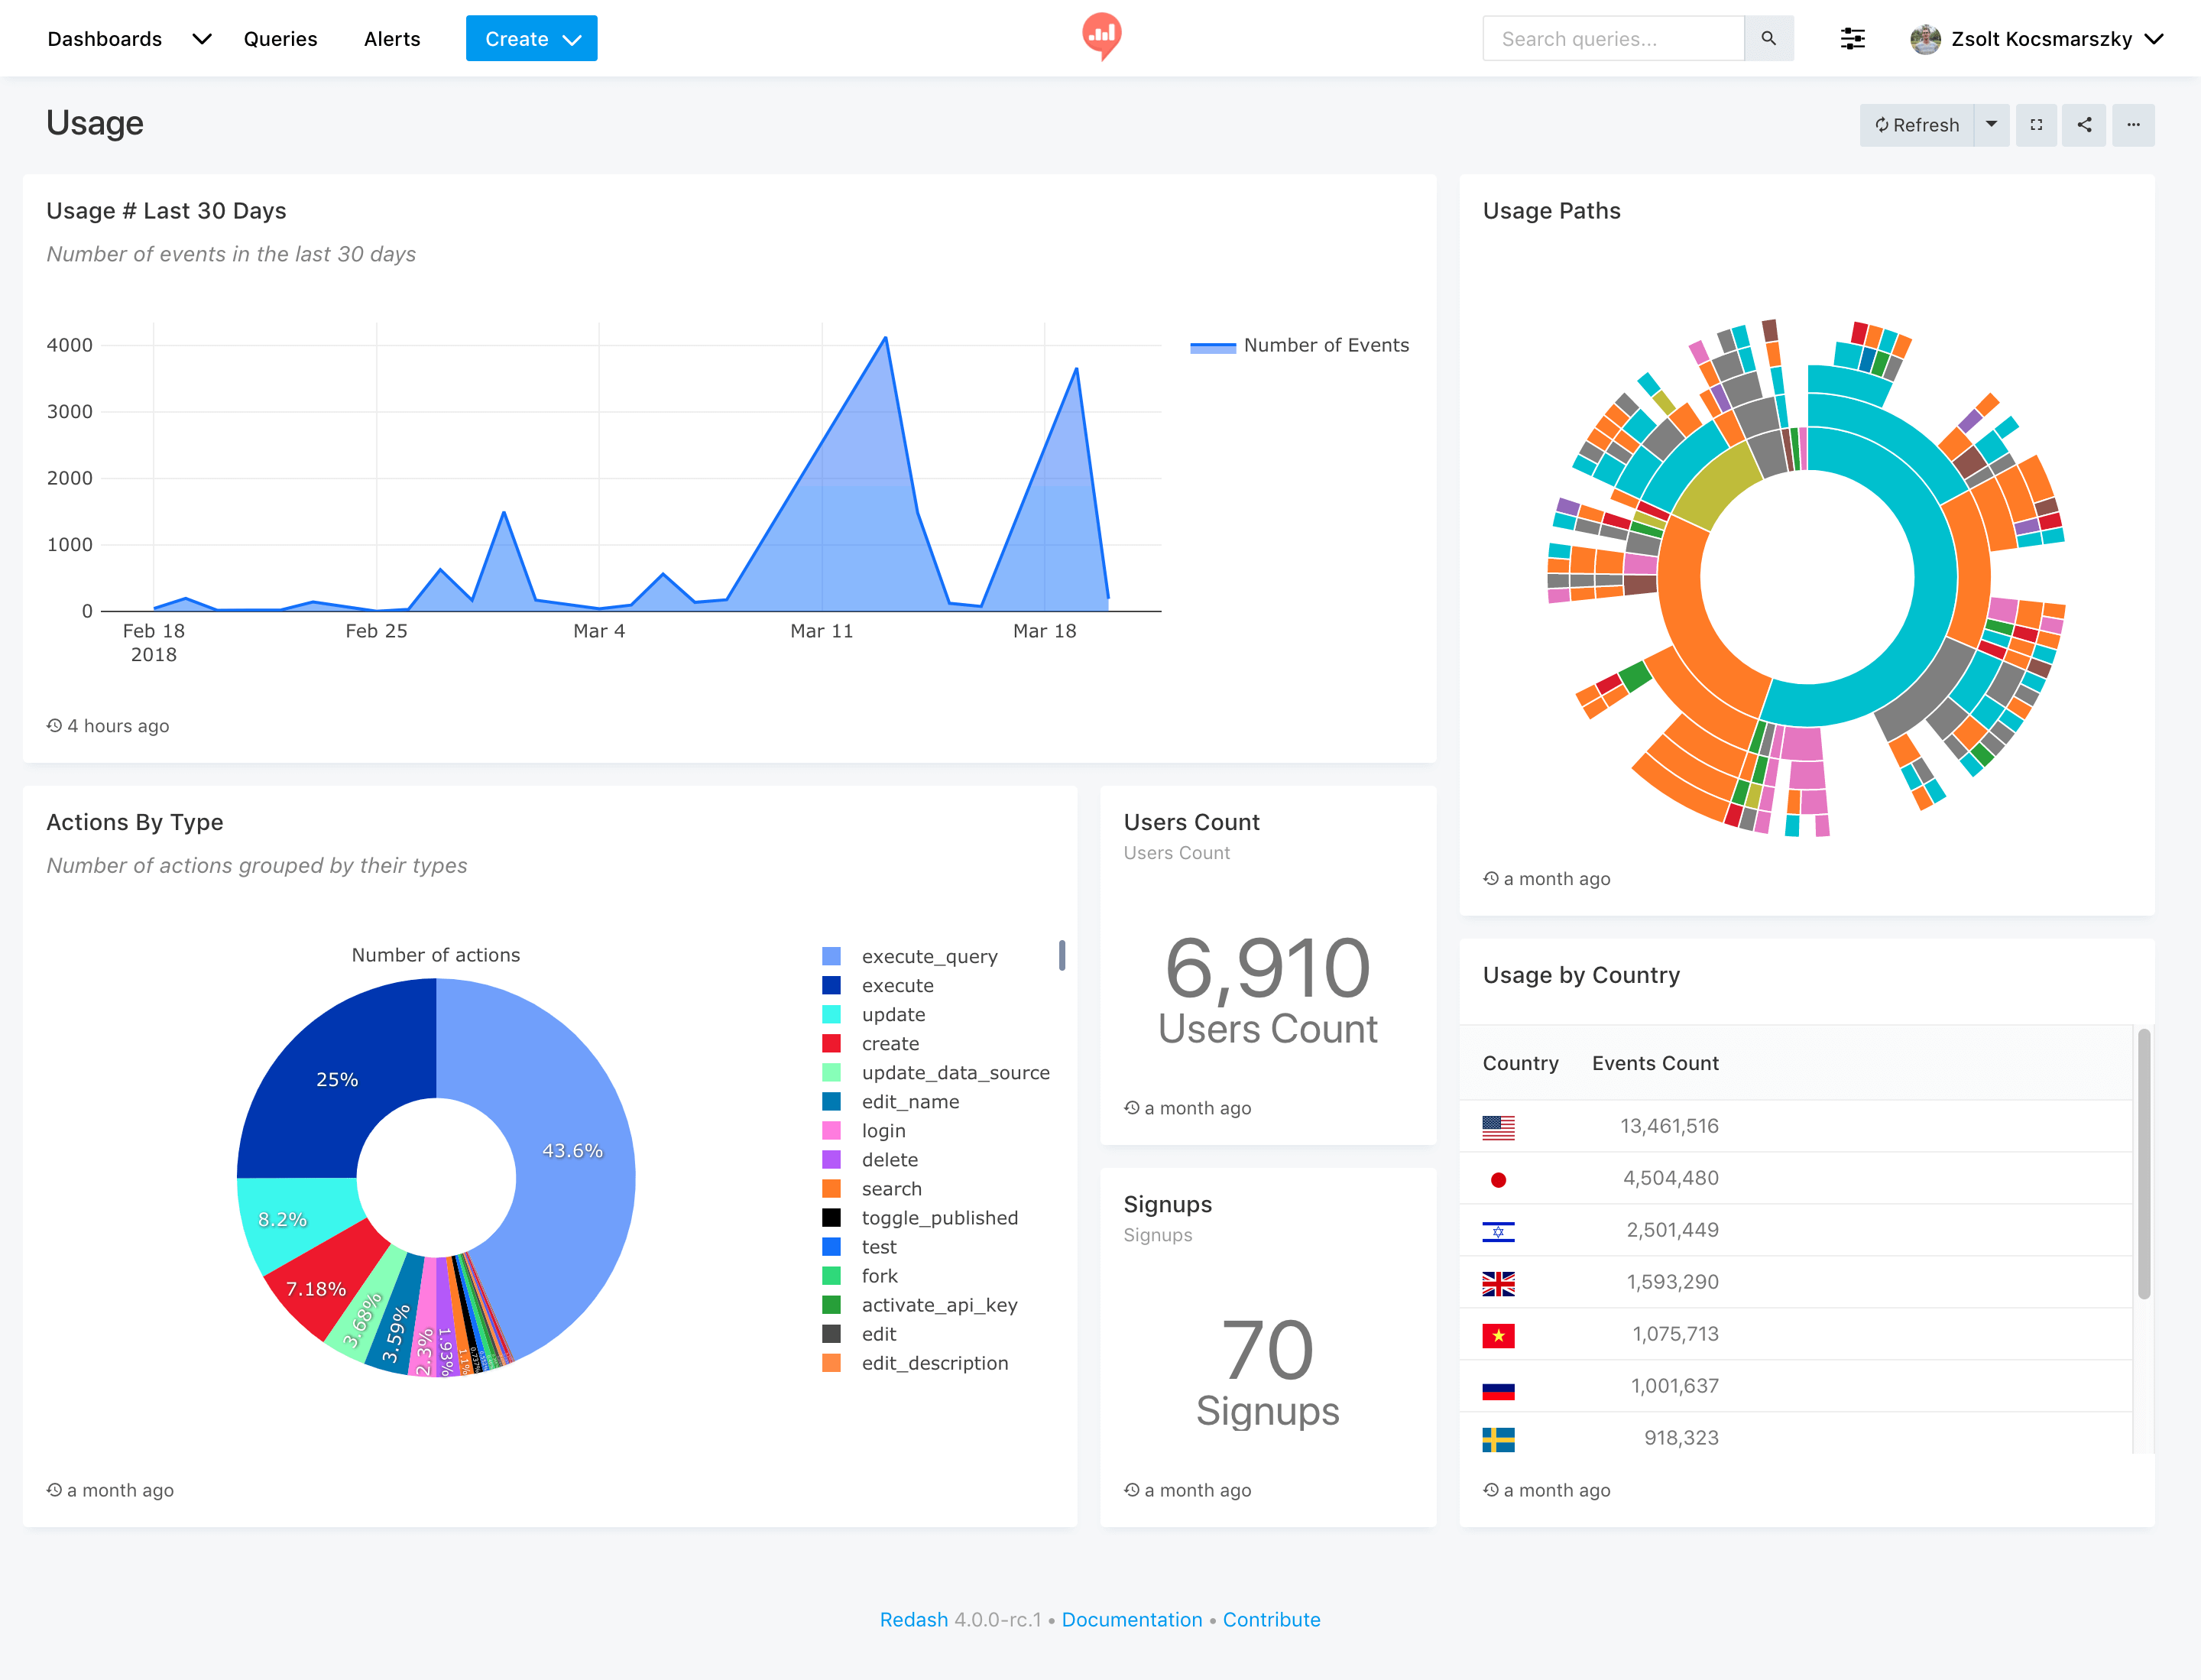
On the flip side, Redash doesn’t have the flashy visualizations or advanced analytics that some premium BI tools provide. No version control or collaboration tools make teamwork a bit chaotic, and it lacks features like scriptability or CI/CD integration. Data transformations are limited, and there’s no support for reusable SQL templates, so you might find yourself redoing the same work over and over.
It’s best suited for teams comfortable with writing queries and building visualizations themselves. While Redash offers a free open-source version, hosted plans typically start around $49/month through partner providers.
7. Hex
Hex combines collaborative notebooks with BI features, making it a great choice for data teams that want to code, analyze, and build interactive apps all in one place. You can connect to popular data sources, use SQL or Python for analysis, and then turn your work into shareable apps that anyone can use. With features like version control, real-time collaboration, and integration with GitHub and dbt, it’s a strong choice for technical teams.
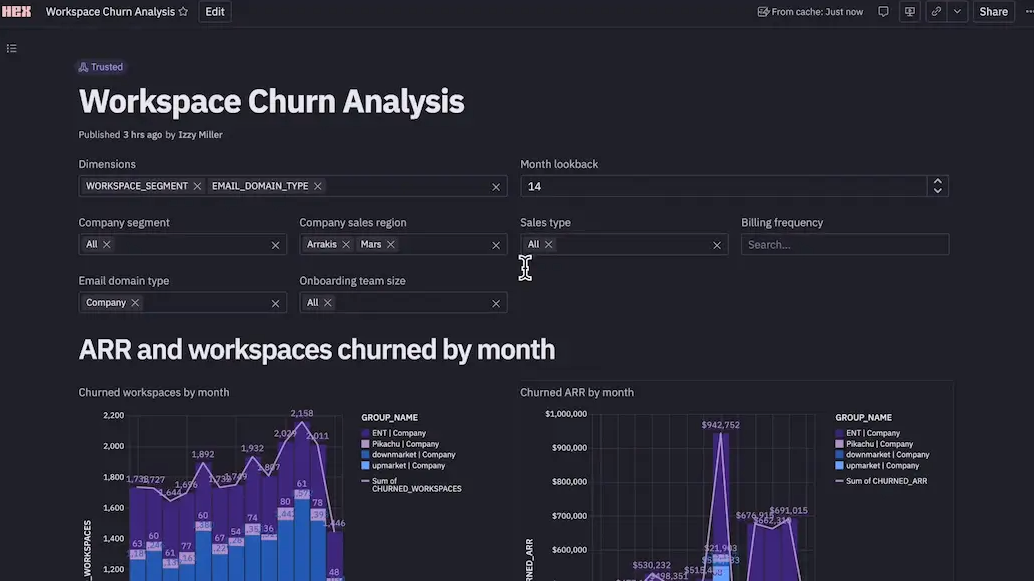
That said, Hex is definitely built with data engineers and analysts in mind—so if coding isn’t your thing, or you don't need your business users to self-serve, it might not be the best choice.
Pricing starts at $36 per Editor/month for the Professional plan, $75/month for Team plans, and custom options for Enterprise needs.
8. ThoughtSpot
If you’re looking for a tool that makes data as easy as Google search, this is it. Just type out a question in plain English, and ThoughtSpot will pull up insights faster than you can say “SQL.”
With seamless integrations to cloud data sources like Snowflake and BigQuery, it’s a good fit for teams that want everyone—tech-savvy or not—to explore data. However, it may not handle complex data schemas as effectively as traditional BI tools, and managing large datasets can sometimes slow down performance.
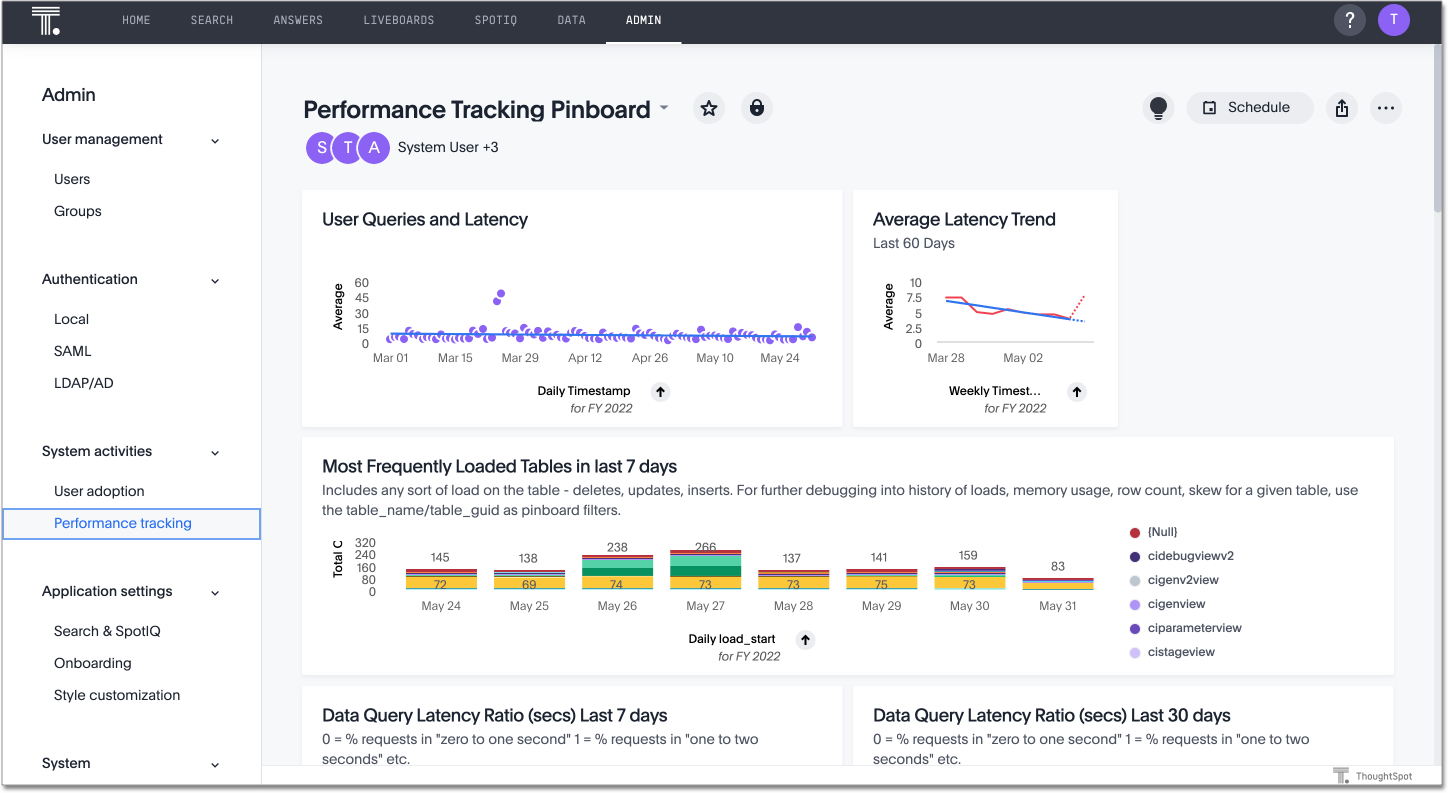
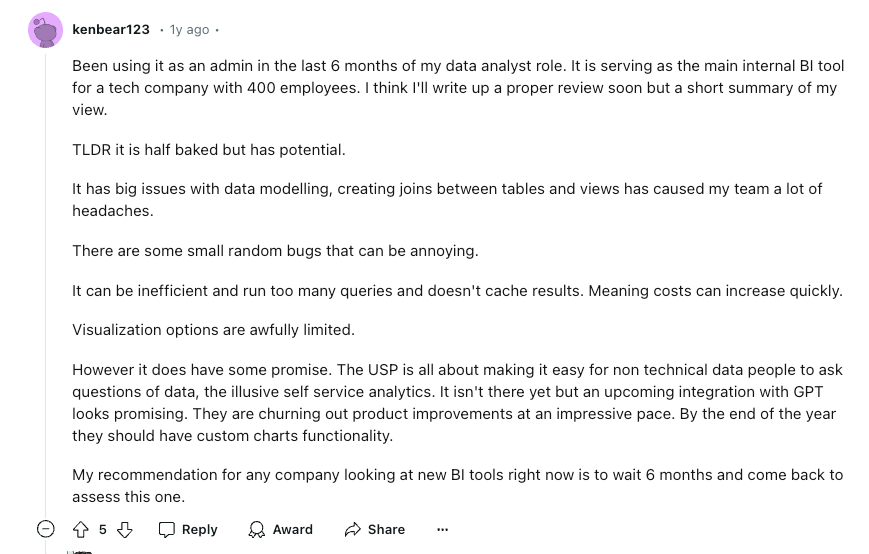
While users recognized the potential of NLP/AI applications in self-service analytics, they also pointed out that the visualization options are still limited. According to this user, Thoughtspot's data modeling can be difficult, as creating joins between tables and views is tricky. This has caused plenty of frustration for teams trying to build more complex models. There are also small, random bugs that pop up, adding to the annoyance.
While it’s easy to use, pricing isn’t exactly straightforward. The Essentials plan starts at $1,250/month for up to 20 users, and higher-tier Pro and Enterprise plans come with custom pricing based on your usage, offering features like unlimited data and 24/7 support.
9. Evidence.dev
Evidence.dev is like a breath of fresh air for data pros who love working with code. Instead of drag-and-drop dashboards, it uses SQL and markdown to let you build reports and dashboards straight from your codebase. It’s perfect if you want full control and don’t mind getting your hands a bit dirty with SQL.
But it’s definitely not built for everyone—if you’re not comfortable with SQL or coding, the learning curve might feel more like a mountain. A free open-source version is available, and for scaling teams, the Team plan is priced at $15/month per viewer. Additionally, an Enterprise plan offers custom pricing for extra features like cloud hosting and dedicated support.
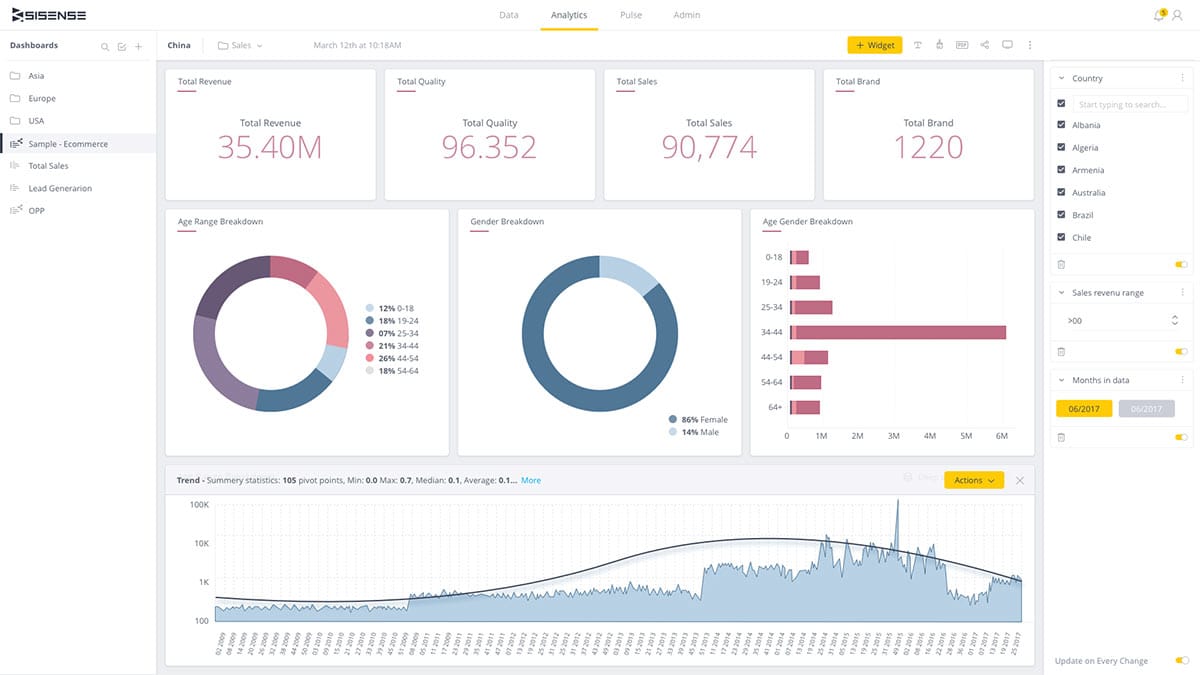
10. Sisense
If you've ever surveyed the market for embedded BI tools, Sisense is a name you’ve probably come across. This is well-deserved as they've put a lot of thought into multi-tenancy and slicing data on different levels for access control. Sisense's APIs and level of extensibility are some of the best in the embedded game.
This also means Sisense's pricing for embedded analytics can be prohibitively expensive, as many have pointed out.
On the other hand, maintaining Elasticubes—the core of Sisense's data processing—can be a time sink. It requires constant upkeep, and while it’s hard to directly compare to other platforms, the maintenance overhead can become a real chore.
According to Sisense users on Reddit, Sisense support quality is not the best, as the first-line support team often gives generic responses, which aren’t super helpful when you’re dealing with specific, complex issues. While they do offer back-and-forth communication with their platform team, it can lead to a lot of back-and-forth emails that take up valuable time.
Sisense UI isn’t exactly intuitive either. The way filters and features work can feel clunky, especially for less tech-savvy users.
Conclusion
Finding the right BI tool isn’t a one-size-fits-all decision. It really depends on what your team needs, whether it’s ease of use, advanced data modeling, or smooth compatibility with existing systems. Metabase might be great for startups that want something straightforward, while tools like Holistics are ideal if you’re after a more structured approach to data modeling and reusing business logic across reports. Each of these tools in this list has its strengths and trade-offs, so think about what you value most to your team and go from there!
What's happening in the BI world?
Join 30k+ people to get insights from BI practitioners around the globe. In your inbox. Every week. Learn more
No spam, ever. We respect your email privacy. Unsubscribe anytime.
