Qlik sense limitations and top 05 alternatives


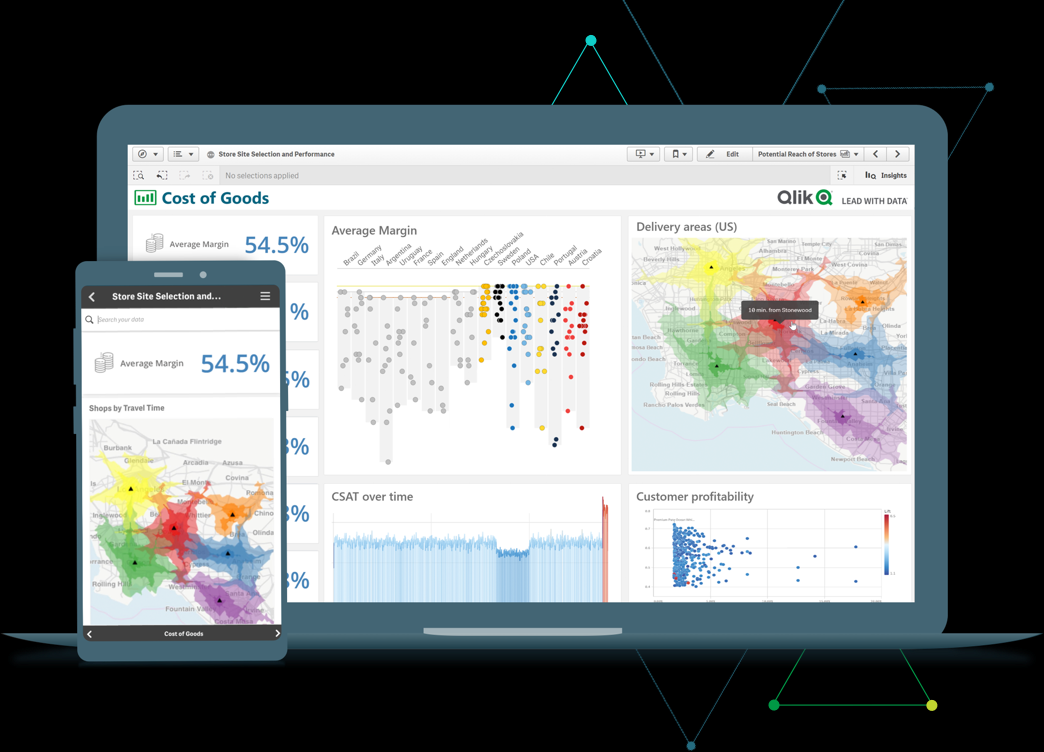
Qlik Sense is a dynamic self-service analytics and visualization tool that simplifies data exploration for a full spectrum of users. With intuitive data prep, drag-and-drop abilities, and drill-down features, organizations can easily spot and share data relationships and key insights quickly and efficiently.
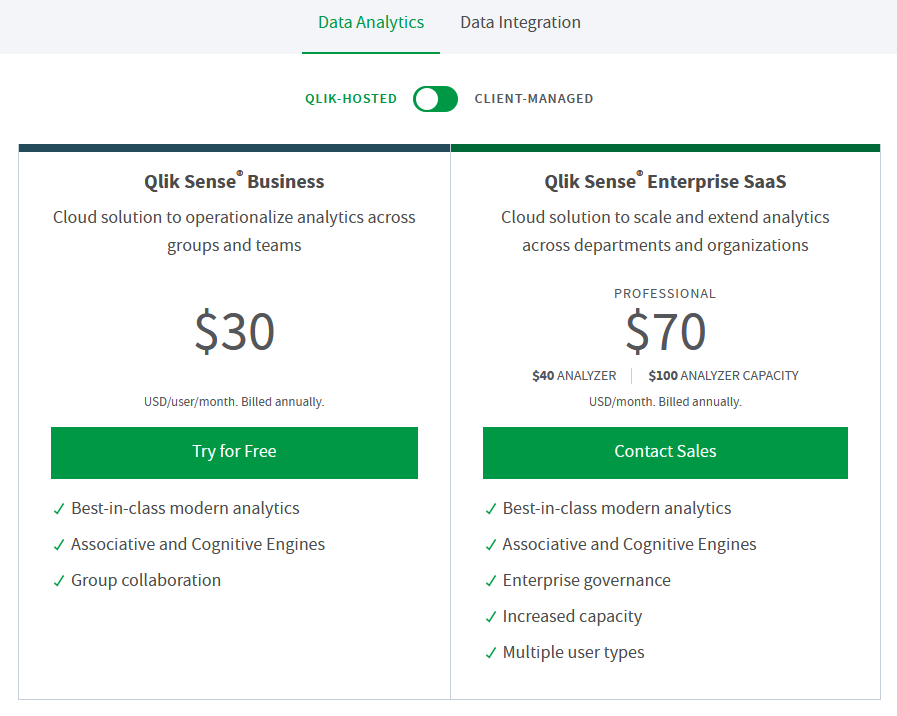
Free and Starting from $30/user per month.
Nevertheless, Qlik Sense still has several limitations:
- Inflexible data extraction capabilities
- Limited visualization due to lack of some basic charts
- Complicated token pricing model
- Data solution is normally sluggish when working with large data sets
In this article, we will go through the top 5 Qlik Sense alternatives, offering not only their own robust feature sets such as data modeling, self-service analytics, data reusability, etc. but also more flexible pricing plans. Hopefully, after reading our blog post, you’ll find the alternative that best fits your needs.
Top Five Chartio Alternatives
Holistics
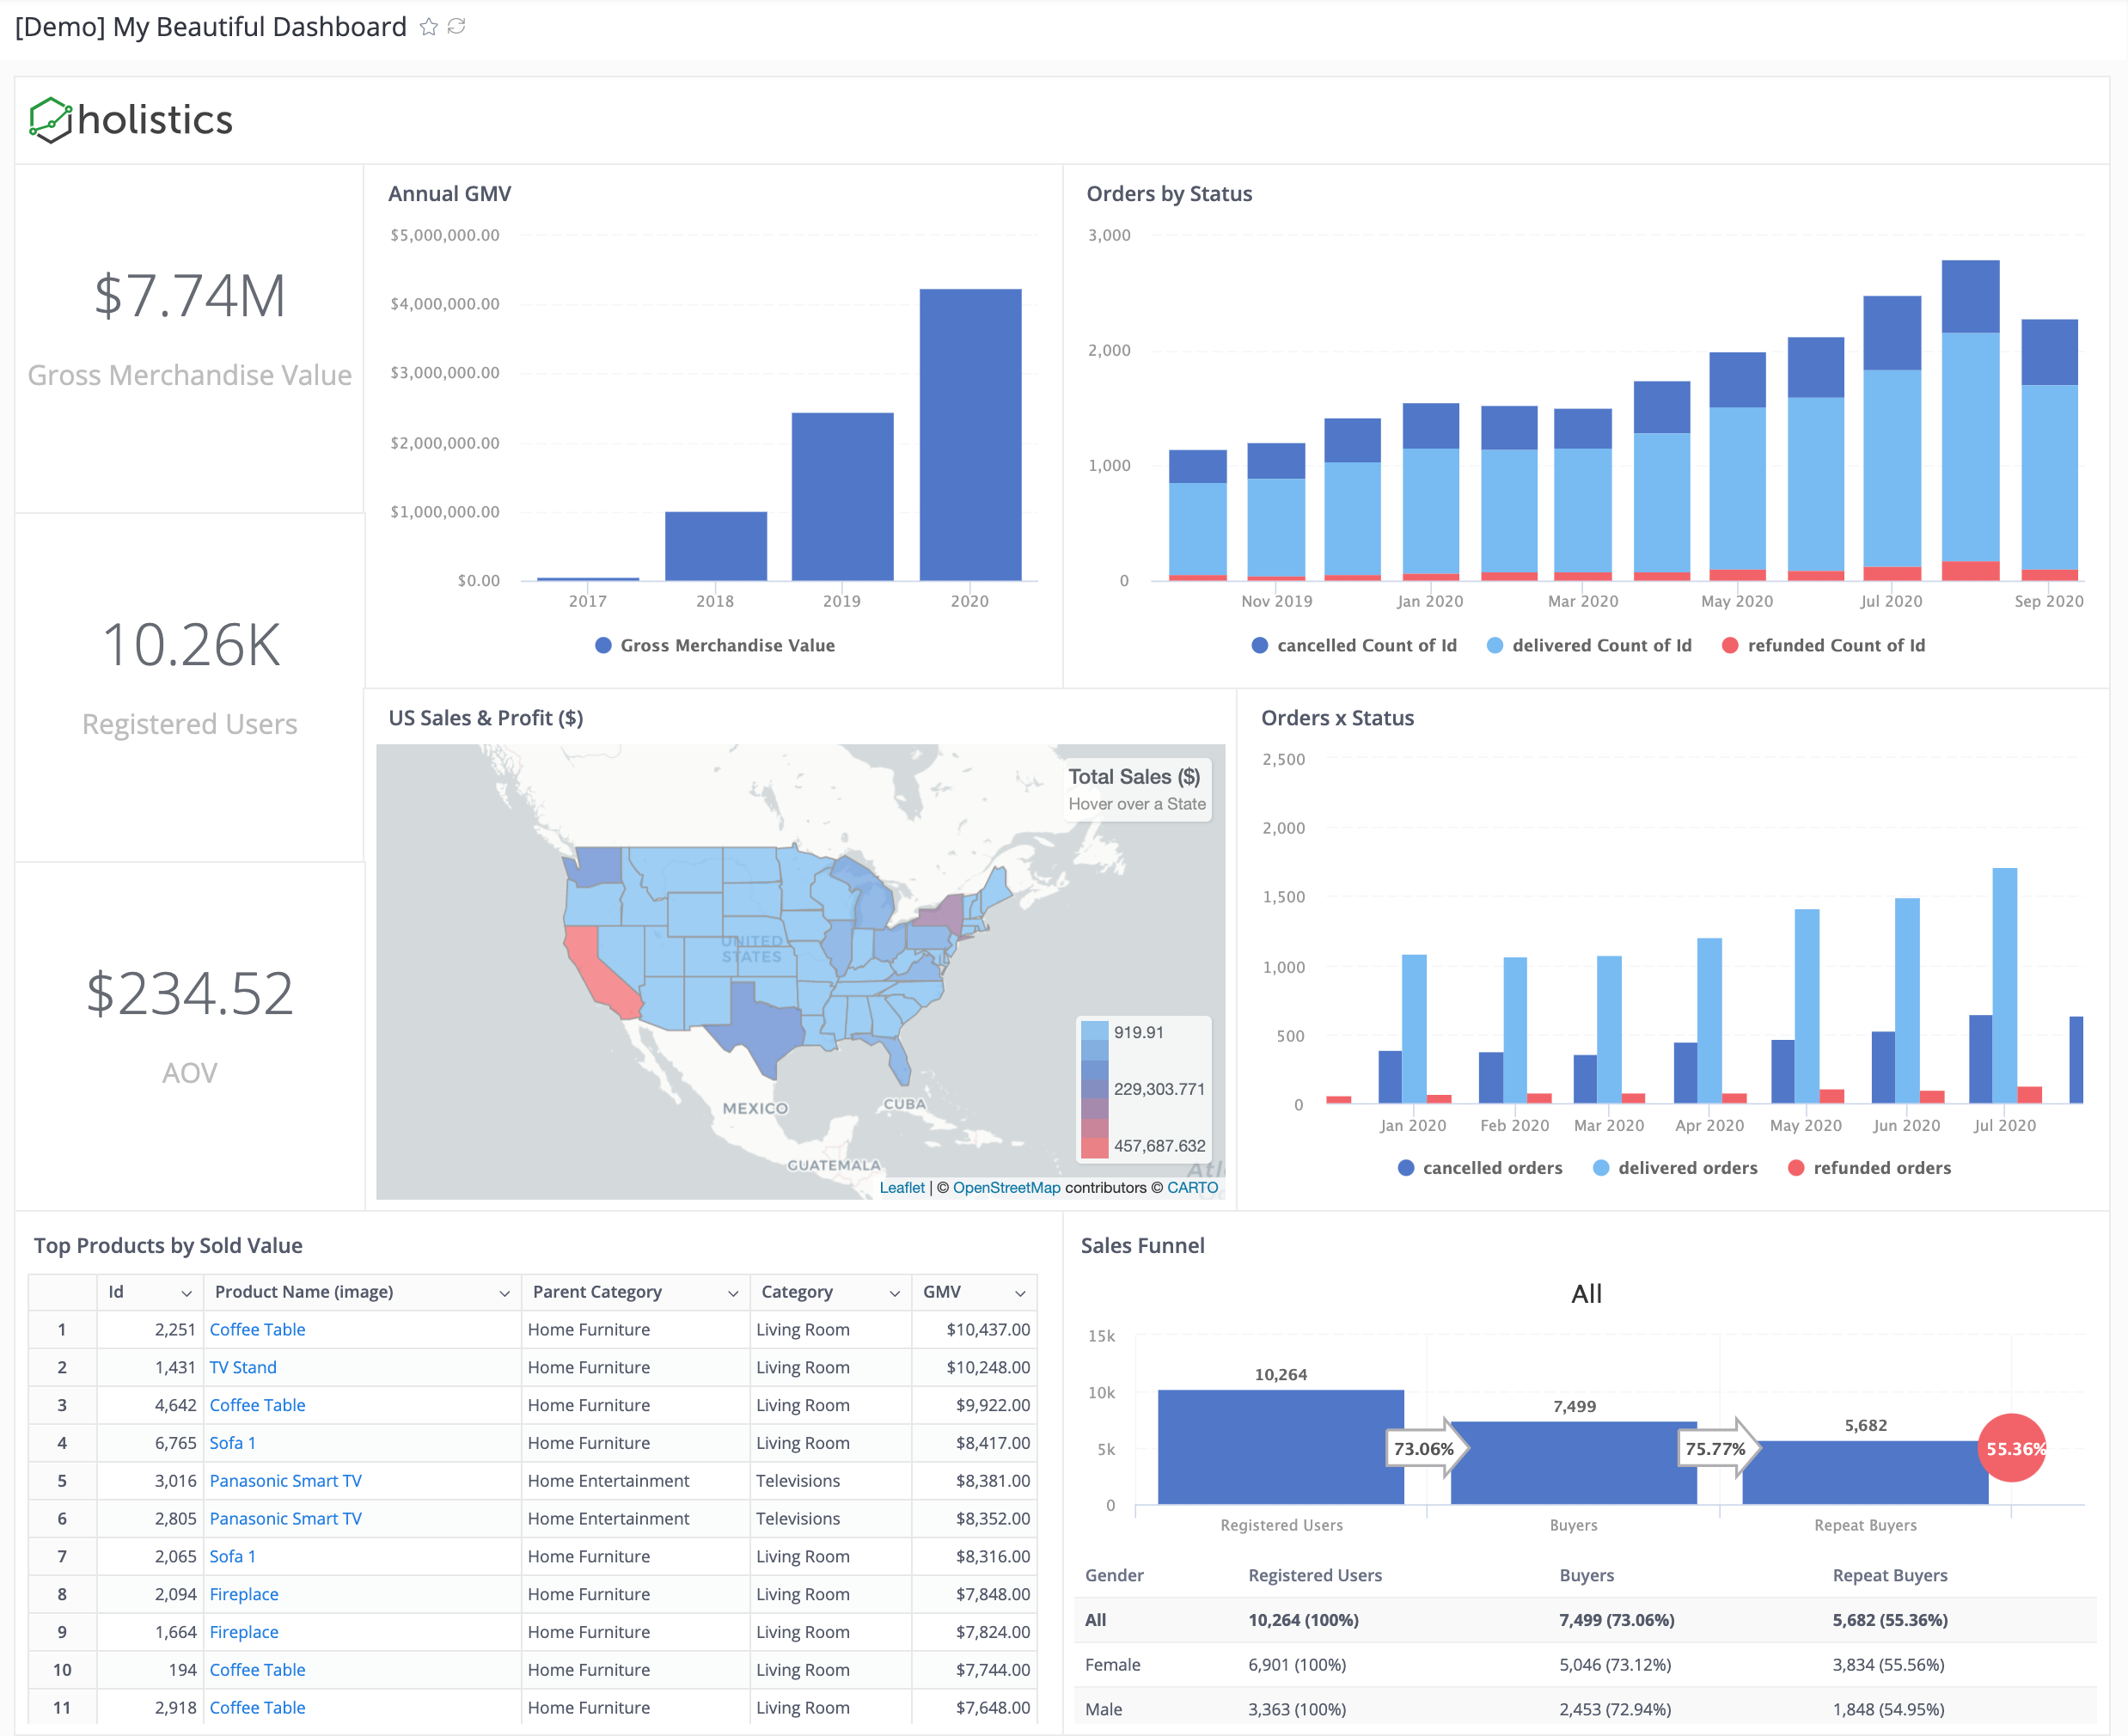
Holistics is a powerful and scalable data platform for companies seeking a self-service BI solution. Data Analysts can build a reusable set of data for the Business Team to do self-service data exploration with minimal involvement of the data engineers.
Pros
- Self-service analyticsin with an ad-hocintuitive drag-and-drop interface for non-technical teams to answer adhoc data questions.
- Support data consolidation from multiple sources (Spreadsheet, Google Analytics, MongoDB, etc.)
- Work well with almost all the popular database in the market (PostgreSQL, MySQL, MS SQL, Snowflake, Amazon Athena, Google Big Query, etc.)
- Powerful delivery capabilities via Email/Slack Schedule and Alerts, Shareable links.
- Support team is super responsive and helpful.
Cons
- You need to have a good foundation in Data Modeling concepts to fully master Holistics
- Holistics is a fairly new tool in the market so there are a lot of features still in the roadmap
- The chart gallery can support most of the visualization needs, other complex charts are still under development
Looker
Looker is a modern analytics and BI platform that enables users to integrate, explore, and visualize data. Looker is primarily deployed in the cloud. Core to its approach is its data modeling language, LookML, in which data analysts write code to define business metrics and manipulate data. The platform supports a wide range of data sources and visualizations and can be embedded in websites, portals, and applications.
Pricing
Looker's pricing is customizable based on your needs so they don't public their price. Looking at some online communities, the price could range from $3000 - $5000 per month for 10 users with an annual subscription
Pros
- Cloud-based so it doesn't take time to set up (as compared to Metabase)
- Have a custom-built DSL layer (called LookML) to perform the mapping between database tables and business logic, thus it's more flexible and customizable.
- Looker supports collaboration and version control with Git Integration
- Looker's pre-sale team is very helpful and supportive. They will go side-by-side with your for your initial setups.
Cons
- Steep learning curve (have to acquire LookML skills to work with models).
- Require strong data team with high level of data maturity to manage LookML projects and do all the setups for your business team.
- Looker can only work directly one database per project and does not offer ETL capability.
Metabase
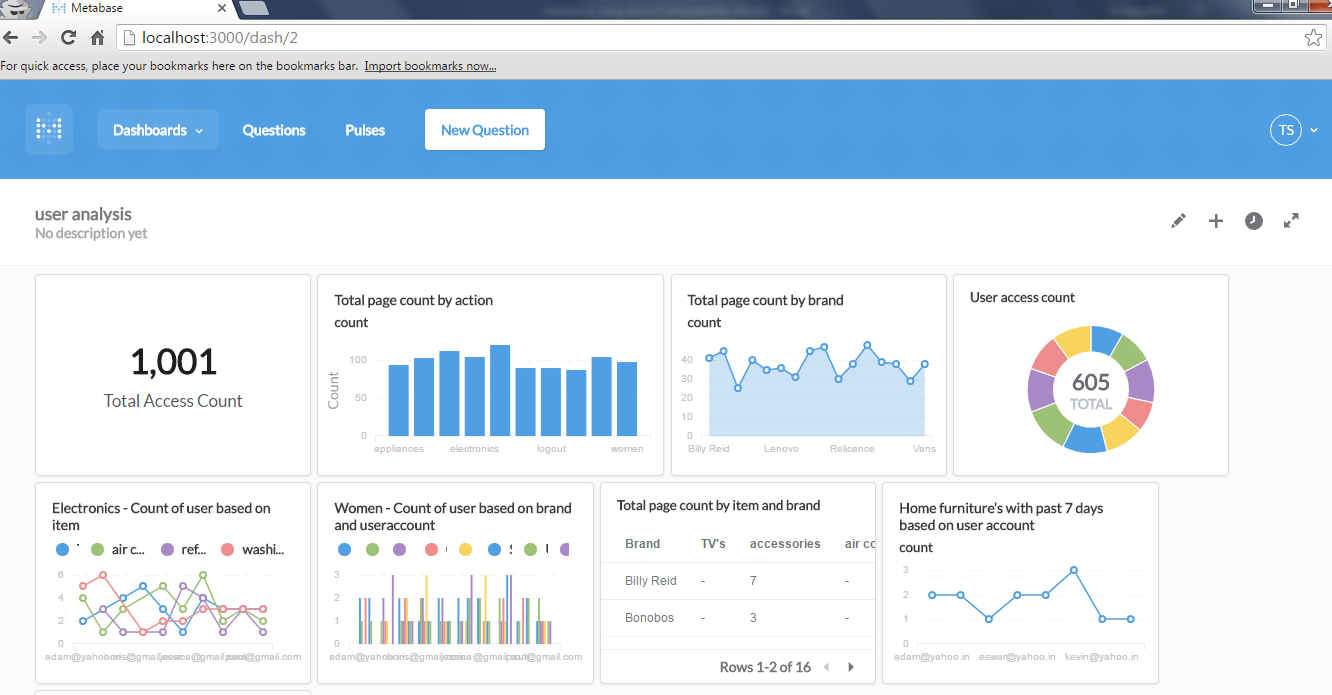
Metabase is an open-source business intelligence tool that makes analytics accessible to everyone without knowledge of SQL. This Looker alternative lets you ask questions about your data and displays answers in formats that make sense, whether that's a bar graph or a detailed table.
However, Metabase's data modeling functionality is very limited, giving you only the most basic ability to define logic and relationships between data models. That said, we think Metabase is perfect for teams that do not need to do very complex things with their data.
Pricing
Free business intelligence software
Pros
- Free business intelligence tool
- Open-source
- Lightweight
- Simplified and easy-to-use interface, which is suitable for the less technical-savvy
Cons
- Have to set up your own server and maintain the infrastructure
- Limited multiple integrations
- Limited variety of charts and settings
- Weak permission control
- Not suitable for comprehensive and ad-hoc analytics
- Rudimentary data modeling layer, nowhere near Looker's data modeling.
Redash
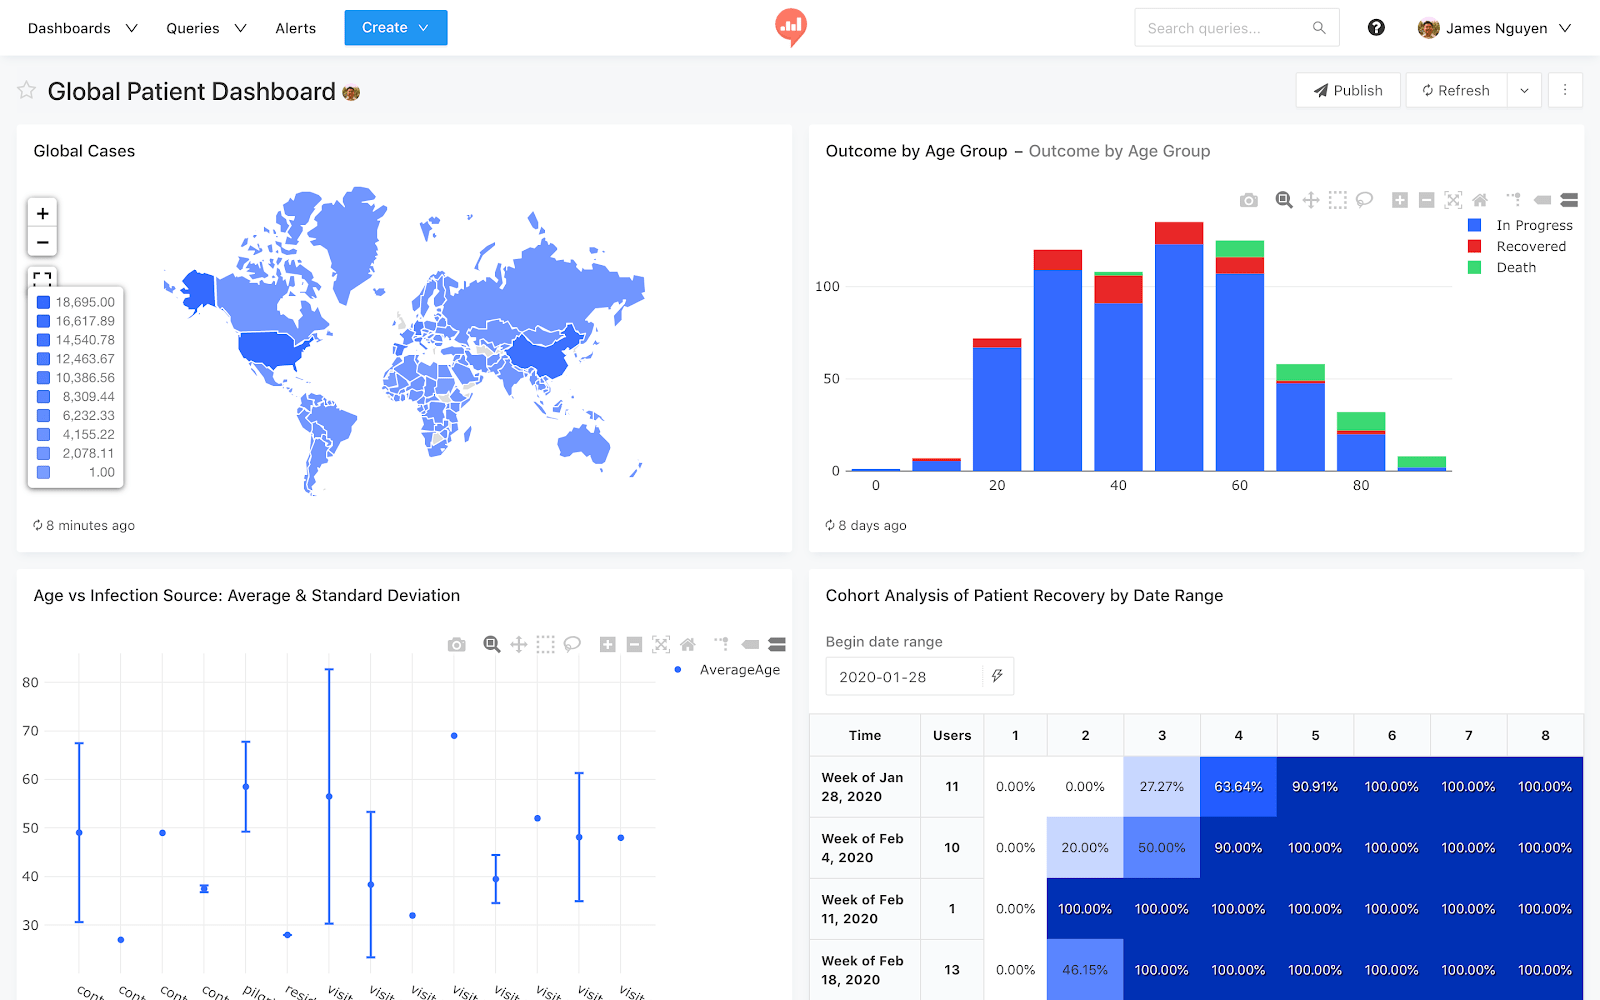
Redash is a good, popular open-source SQL-based BI tool that can be installed easily on a local environment to get a simple SQL-to-chart functionality going.
Pros
- Very light-weight and quick to set up
- Cost-effective
Cons
- Need to know SQL: Redash requires your business users to really know SQL languages instead of being able to interact with the data the way they want.
- Support for multiple sources: It works well with a single SQL data source. If you have a large amount of data coming from multiple sources, Redash likely won't work well for you.
- Transformation Pipeline: With Redash, you can only work directly with your database tables, there's little support for transform pipelines.
- Unmanageable: As the number of queries in Redash grow, it's difficult to manage
- Visualization: Very limited number of Visualization Types and each one has very limited configurations (chart styles, colors,...)
Google Data Studio
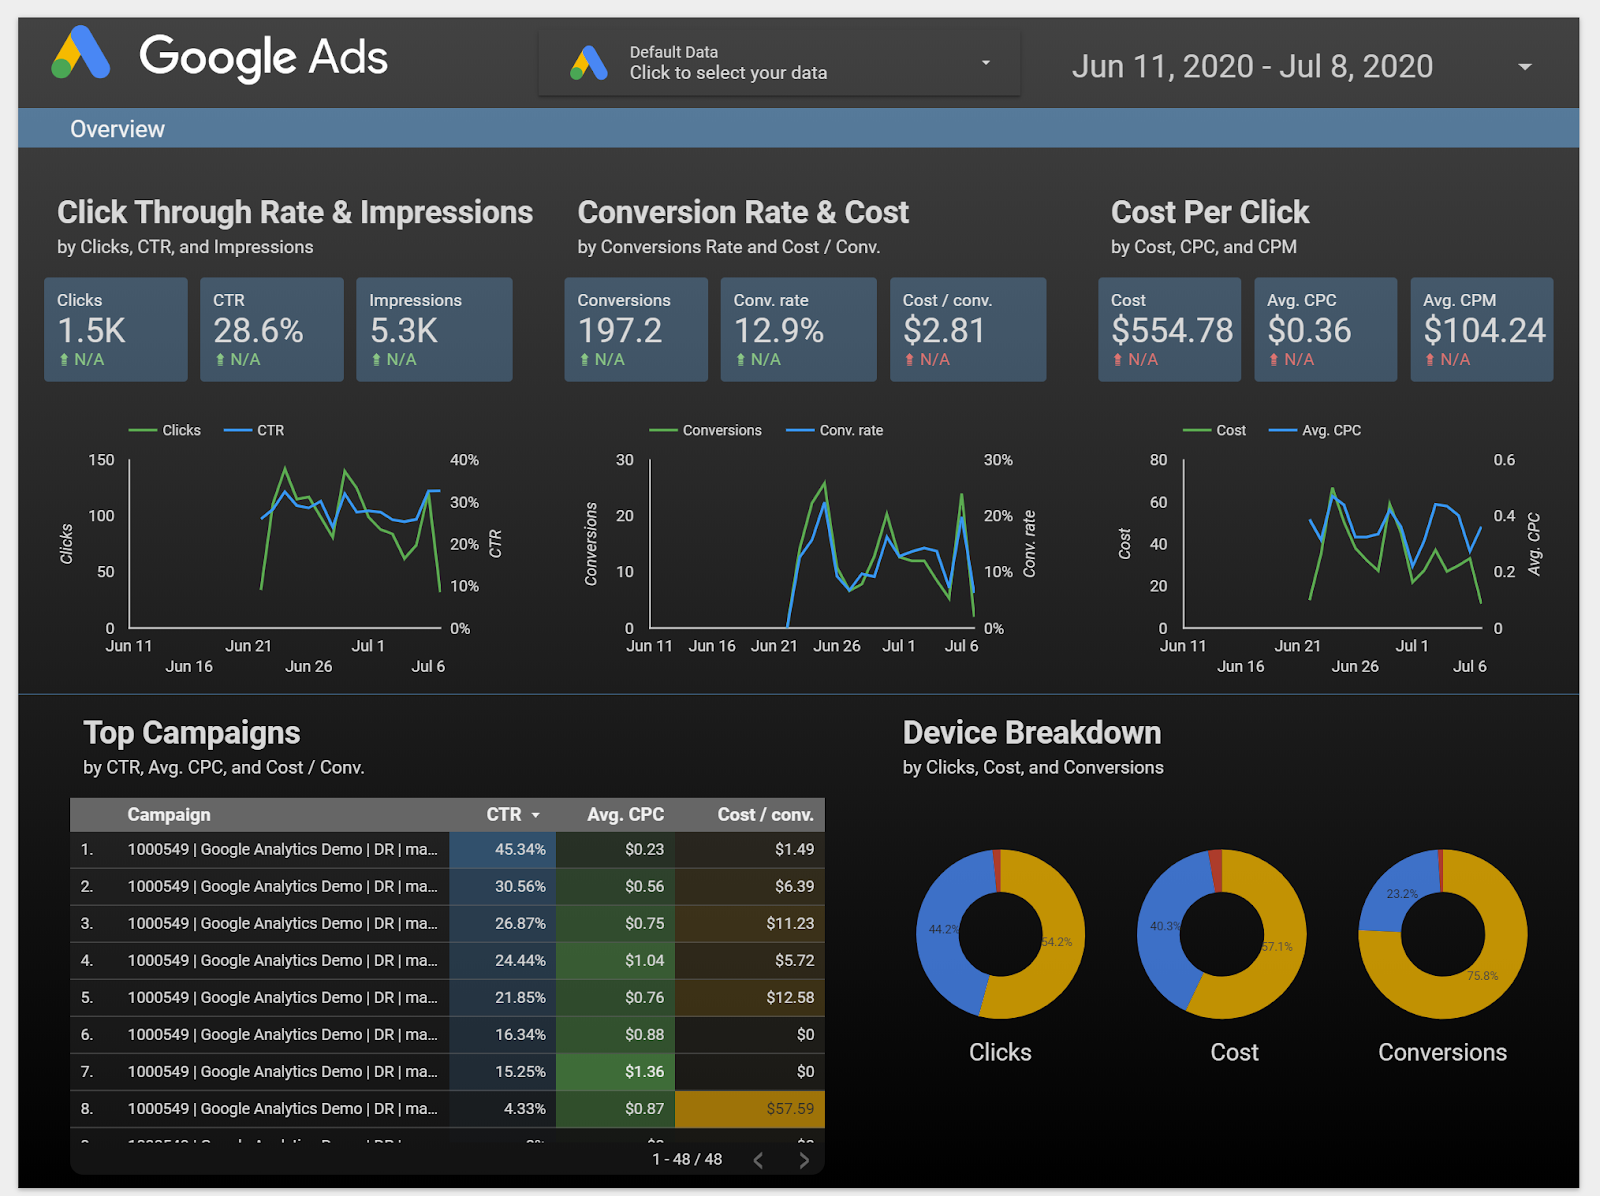
Google Data Studio is a reporting tool that nicely integrates within GA360 ecosystem (alongside Google BigQuery and Google Sheet) and evolving on a monthly basis with an intuitive interface to explore and build insights. And it's completely free.
The tool seems to targets a set of semi-technical users, who work with numbers and know Excel very well. They might even know a bit of scripting language (Python, JS), but not technical enough to work on data infrastructure or building full reports from scratch, or building complex analysis that requires some SQL acrobatics.
Pros
- Great report presentation layer. GDS provides a highly interactive drag & drop interface, where you can customize and re-style your charts.
- Easily integrate other Google products like Google Analytics, Google Sheets, and AdWords so you can have even more information
- The UI is friendly and intuitive. You can just start creating reports and dashboards within a few clicks.
Cons
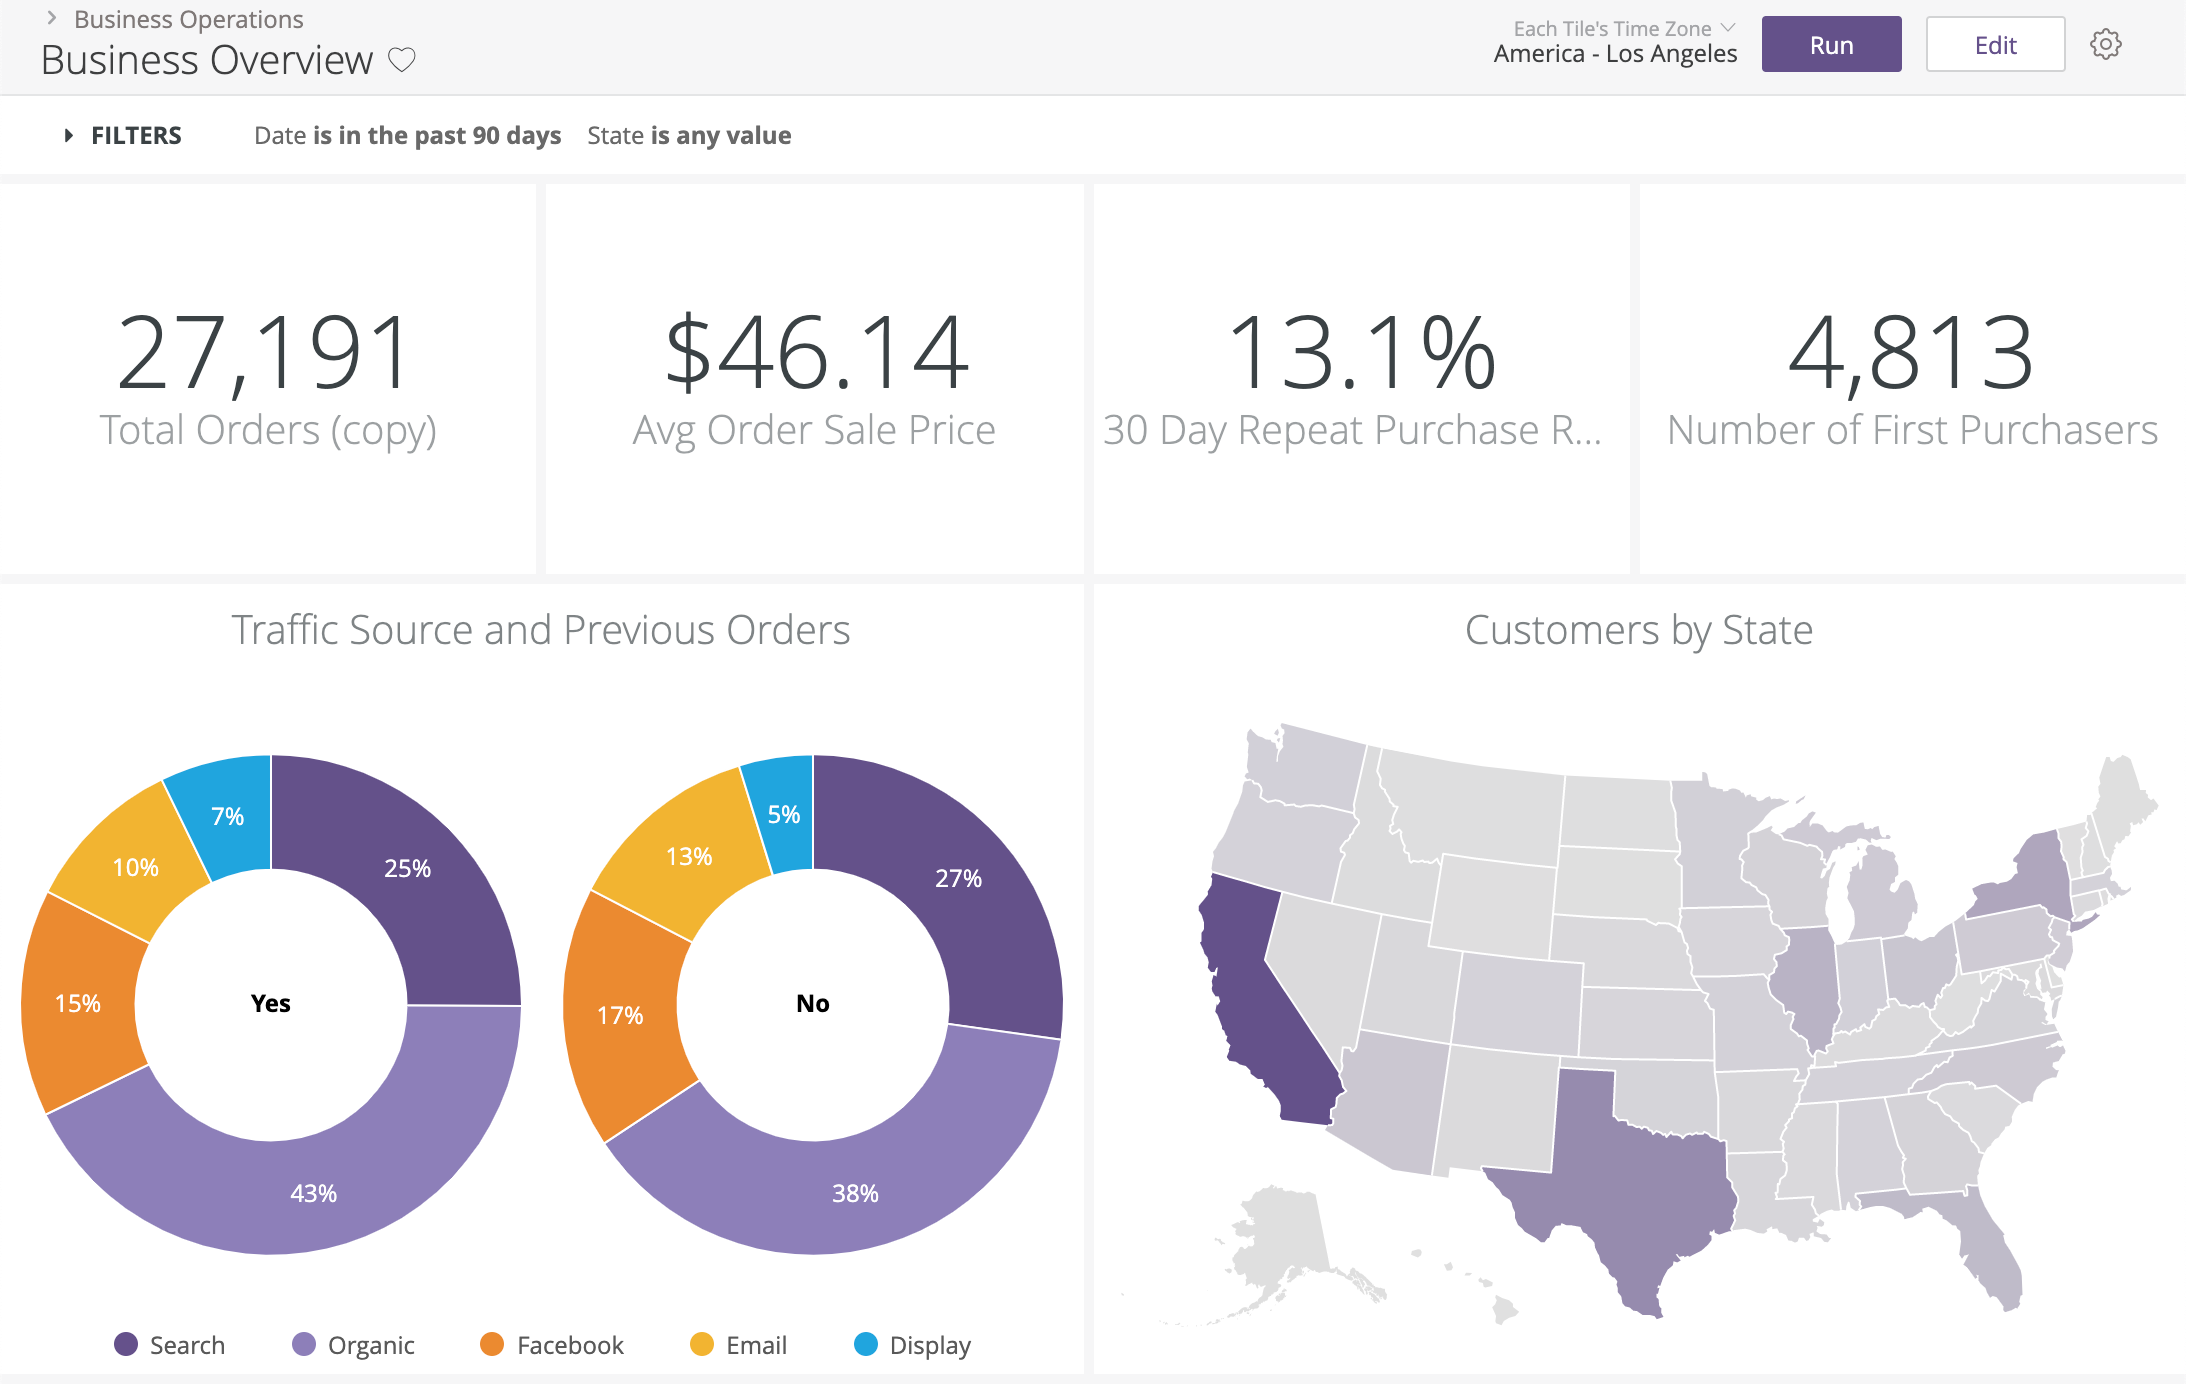
- Limited self-service data exploration capabilities. If you give the dashboard above to a user, it's highly likely that he doesn't know where to find relevant data or drill down/ drill through.
- Lack of auto data refreshing capability. If you want to have real-time data, you would need to install a third-party browser extension (like this one)
- If your data source is not Google-owned and needs to be integrated with Google Data Studio, it takes extra SQL code or ETL effort.
Conclusion
All the above products have their own benefits and drawbacks. Choosing an appropriate one for your company will depend on a lot of aspects including the size of the company, your data maturity, your budget, and importantly, the use cases you want to solve.
It is not a one-day job so my recommendation is that you should involve all the related parties (data builders and data consumers) of your company to clearly list out all the requirements, narrow down to the top 4-5 tools, and try out all the tools.
If you need a little more pointer to choose the right tool, you might want to check out Chapter 4 in The Analytics Setup Guidebook which will discuss in detail how you can navigate the Business Intelligence tool space.
For more Business Intelligence recommendation, check out:
- [Best Grafana Alternatives For Data Exploration and Visualization](https://www.holistics.io/blog/best-grafana-alternatives/
- Best BI and Analytics Tools for Mid-sized Startups
What's happening in the BI world?
Join 30k+ people to get insights from BI practitioners around the globe. In your inbox. Every week. Learn more
No spam, ever. We respect your email privacy. Unsubscribe anytime.
