Top 05 Analytics & BI Tools for Microsoft SQL Server
This article compares 5 best BI and reporting tools for Microsft SQL Server (2021). Learn how to choose the most suitable tool for you.

Throughout the past decade, Microsoft SQL Server (or MSSQL) has been competing fiercely with MySQL for the second rank in the most popular database chart.
Although MSSQL and MySQL differ from each other when it comes to supported platforms, programming language and many other aspects, they share quite the same capability to work with most popular BI tools on the market.
In this blog post, I will introduce the best BI & Reporting tools for your MSSQL.
The Top 05 SQL Reporting Tools
1. Power BI
Power BI is the indisputable complements to MSSQL, like Google Data Studio to BigQuery, since both are created by the giant Microsoft.
Power BI is quite well-known in the BI & Data Analytics industry, especially for enterprises that adopt the Microsoft ecosystem. It supports an impressive number of data sources, giving companies the power to centralize their data in one place.
Power BI has a user-friendly interface with amazing data visualization capabilities like interactive dashboards, numerous types of charts, powerful filters and much more.

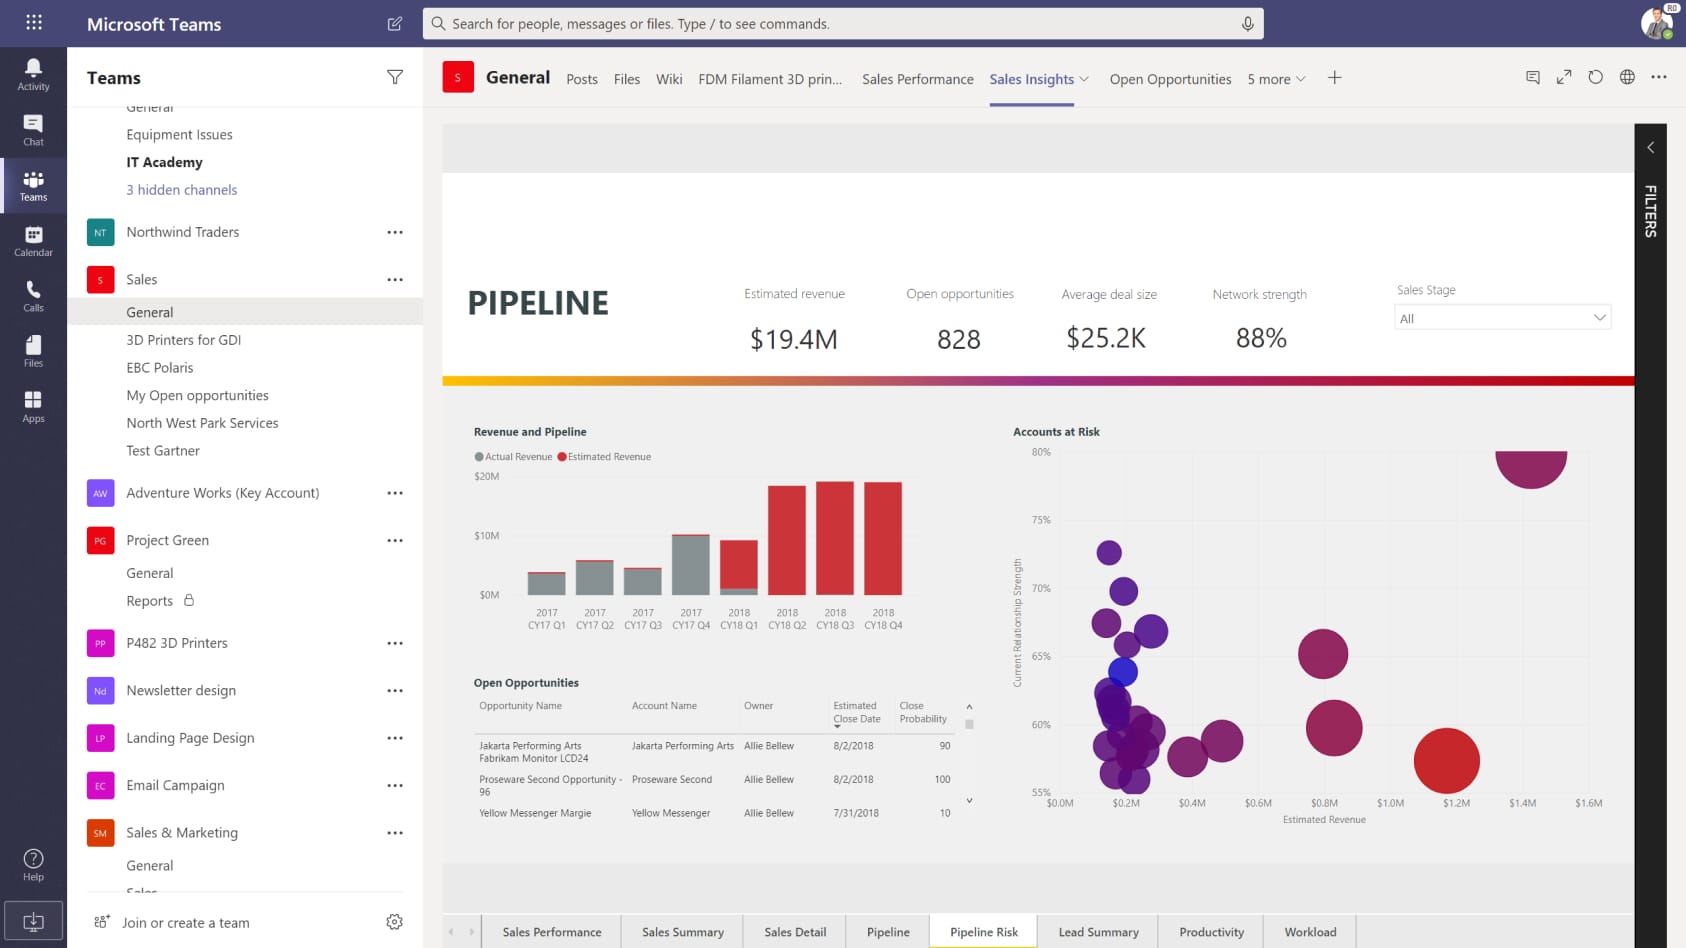 PowerBI dashboards
Pros of Power BI
- Support hundreds of data sources, from cloud service like Redshift to offline files like Excel
- Powerful data visualization capabilities. Besides the basic visualization types, PowerBI allows advanced users to choose from a market place of custom visuals or create their own using well-known Javascript libraries
- Frequent updates and innovations. Follow PowerBI's blog and you will see the team is really active in pushing new features and changes.
- PowerBI has mature data modeling capabilities.
Cons of Power BI. And what needs to improve?
- PowerBI has a steep learning curve. Data analysts must learn DAX (Data Analysis Expression) language to fully leverage PowerBI's power, which is complicated and rigid sometimes.
- The approach is not collaborative and agile because Data Modeling can only be done on a Windows Desktop (Windows-centric, doesn't support Linux/Mac) then publish to the cloud.
For more PowerBI alternatives, check out this article.
2. Holistics
A direct competitor of Power BI is Holistics, a powerful self service business intelligence tool. Besides providing a powerful visualization layer that is easy to use for non-technical users, it also comes with a modeling layer that lets data analysts model and transforms data in MSSQL and many other SQL data warehouses.
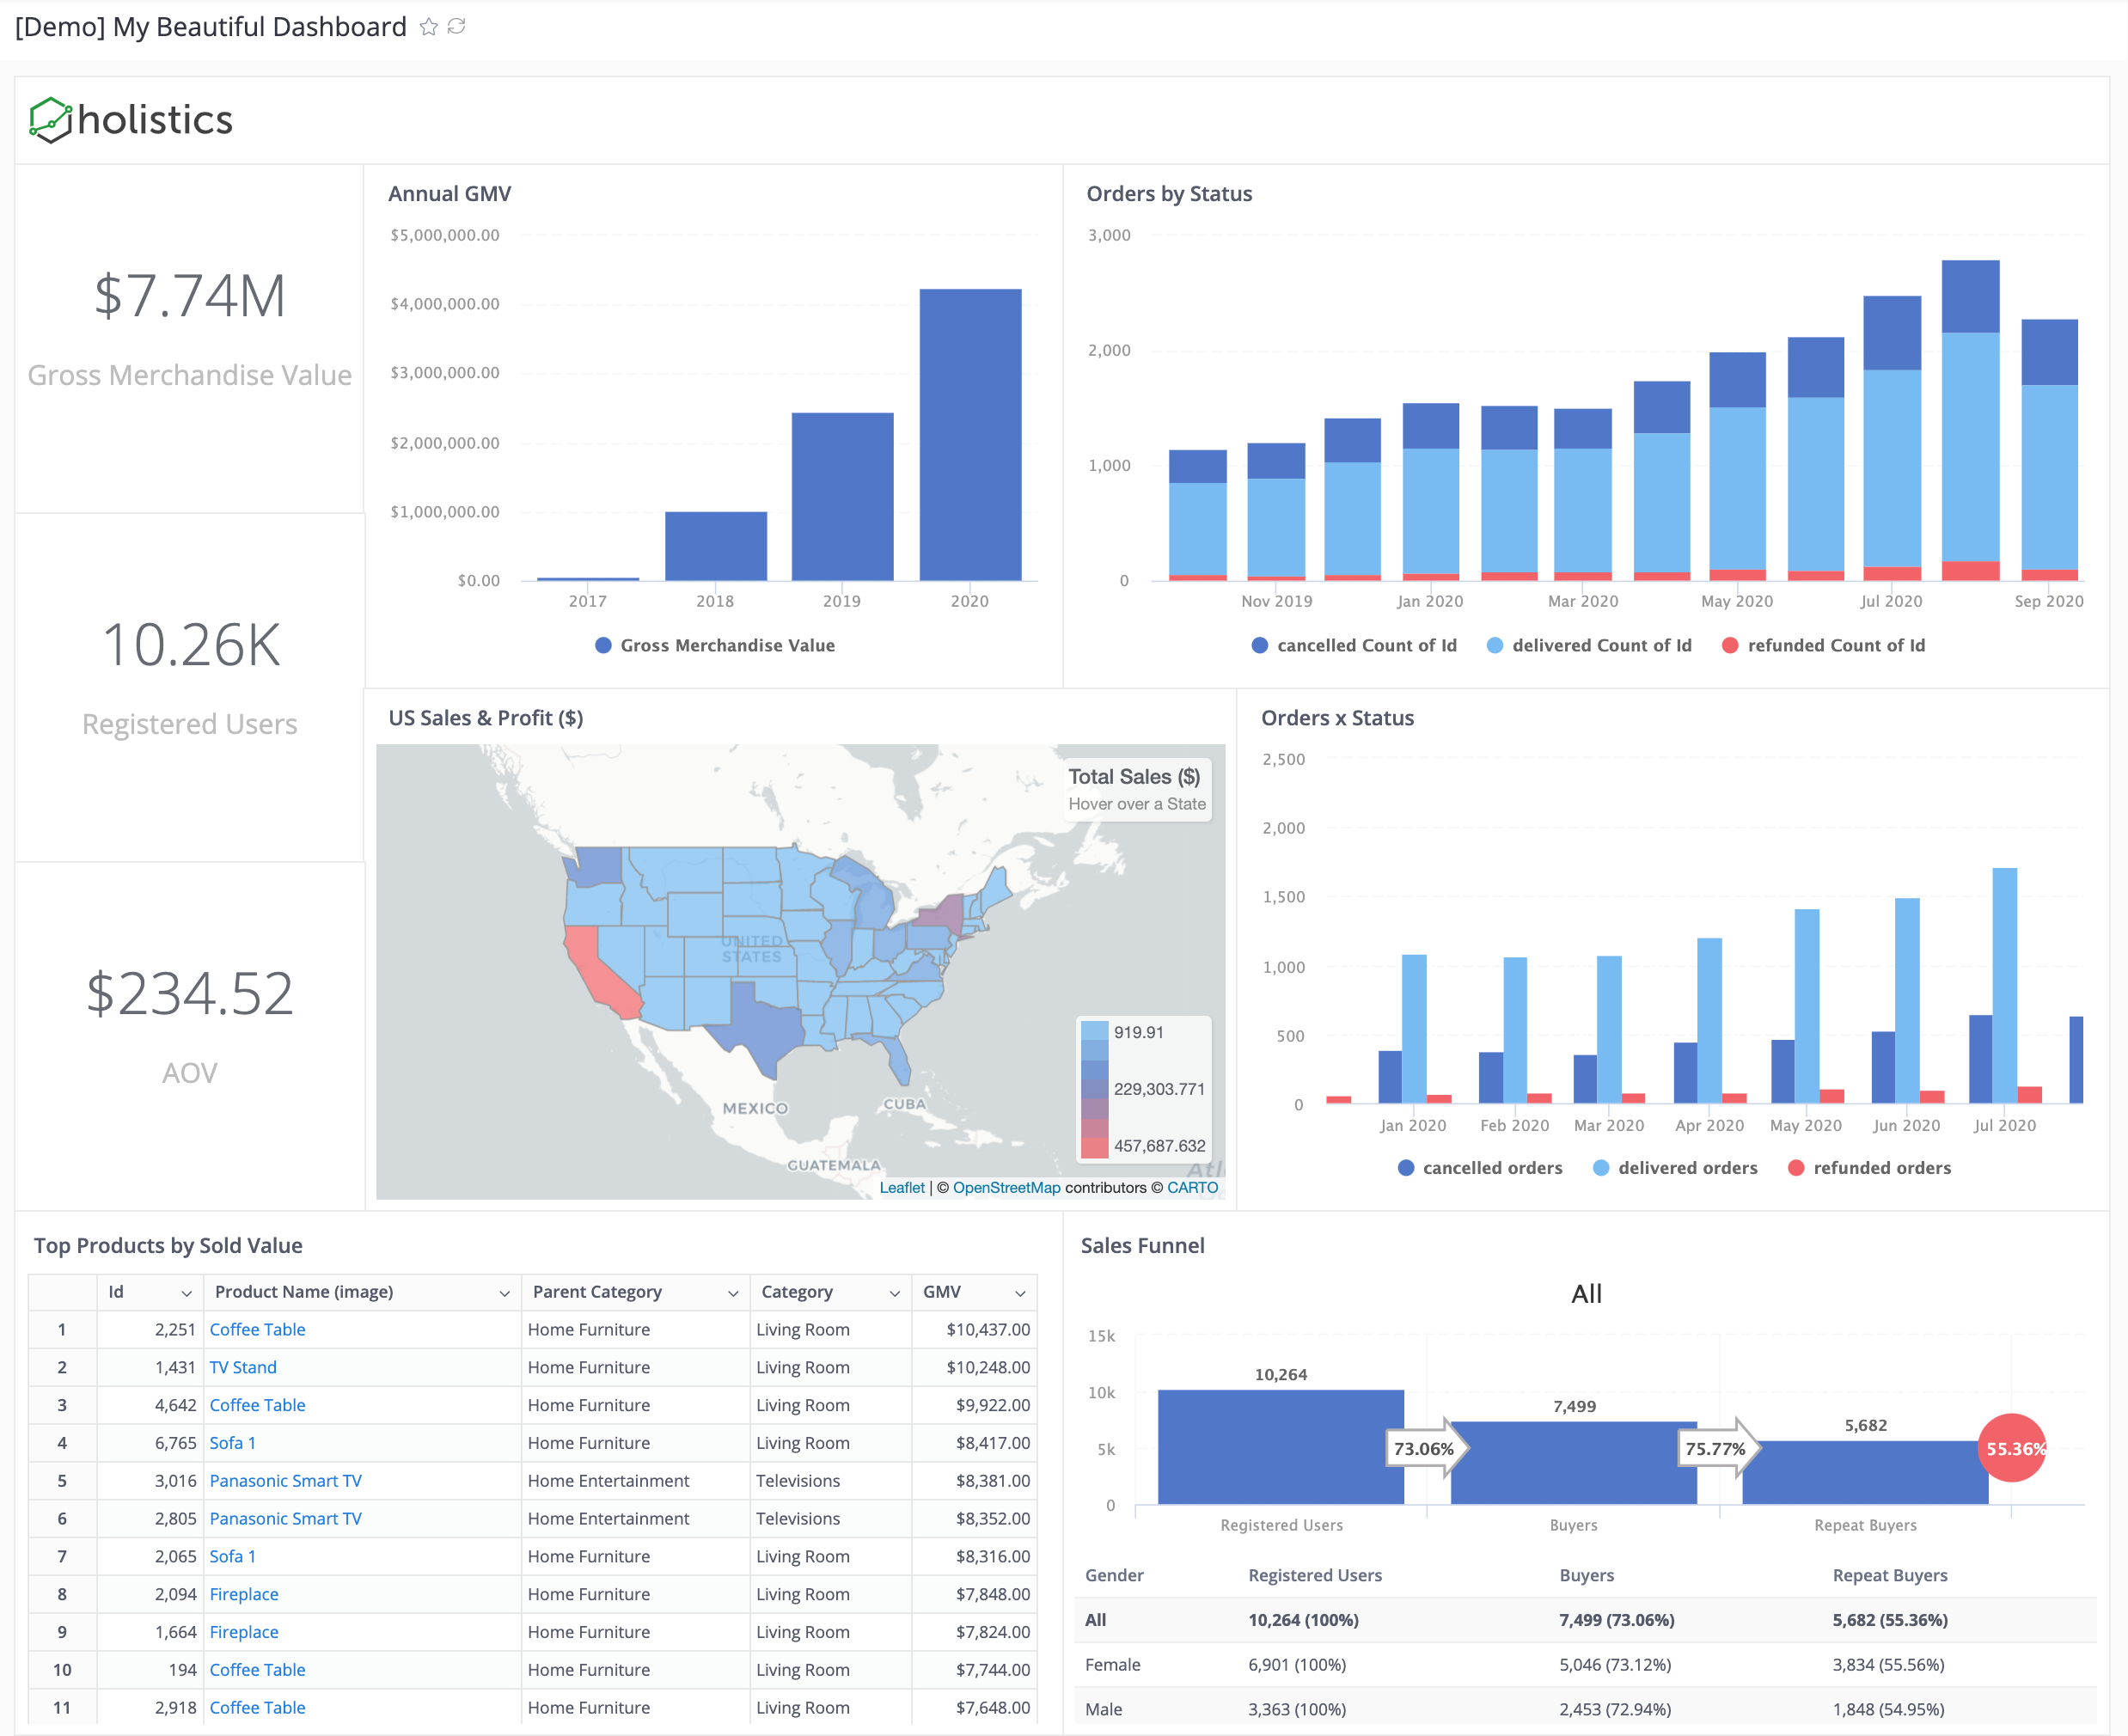
Holistics’ starting price of $100/month is impressively affordable when compared to all the other SQL reporting tools on the market, especially when its features are equally powerful and plentiful. Even if your company scales up with more analysts joining the data team or business users, you will not need to worry about cost per additional headcount.
Pros of Holistics
- Allow you to query the BigQuery database using customizable SQL queries and get fast results with its cache layer
- Materialized views of query results are stored back to BigQuery, for immediate access and fast visualizations and reports.
- Automated scheduling of reports and dashboards with the latest data in BigQuery, sent directly to your email inbox. This feature is fairly basic but not yet implemented in many other tools.
- Drag-and-drop interface for business users to explore data and generate reports to answer ad-hoc questions.
- Have a custom-built DSL layer (called AML) to perform mapping between database tables and business logic, thus it's more flexible and customizable.
- Git Version Control to track every change, perform branching, code reviews to ensure accurate analytics workflow
Cons of Holistics. What needs to improve?
- Compared to the big names like PowerBI or Looker, Holistics is a fairly new tool to the market. A lot of cool advanced features for self-service and analytics engineering are being developed at the moment.
- Dashboards are not as interactive as Power BI. Currently, Holistics only supports drill-down, drill-through to another dashboard and cross-filtering.
3. Domo
Domo is a cloud-based data analytics and BI platform aimed at senior executives and line-of-business users who need intuitive business-facing dashboards. Domo is often deployed in the line of business with little or no support from IT.
Taking a look at Domo's landing page and we'll be easily impressed with their great-brand clients like Cisco, ESPN or Ebay. With beautiful dashboards, a wide range of supported data sources, Domo is easily the go-to tools for a lot of companies.
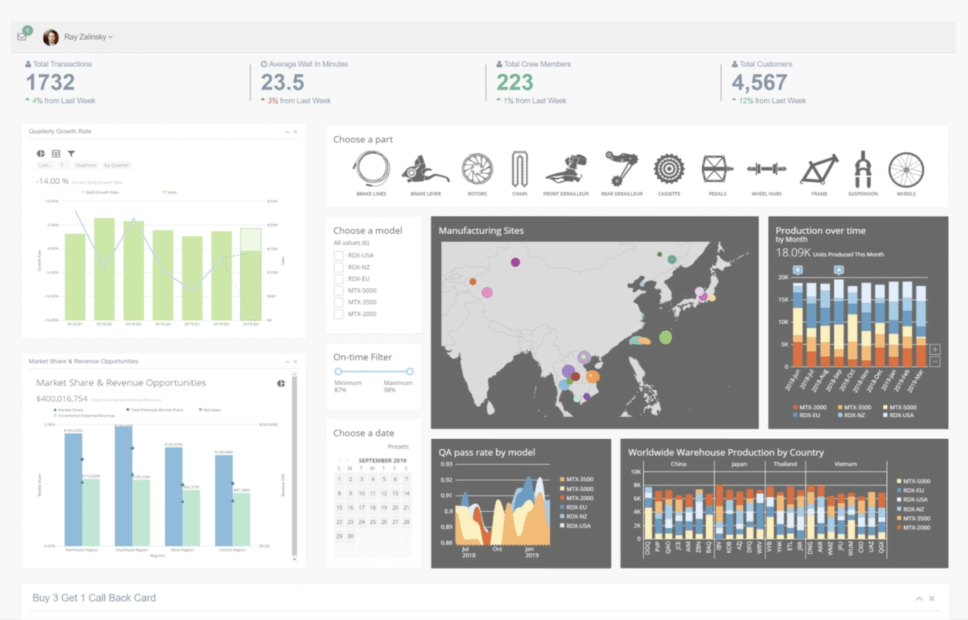 Source: Domo.com
Pros of Domo
- Visualization layer is clean and is very business presentable.
- Domo is great on desktop, tablet and mobile. This gives data presented in Domo extra accessibility and discoverability.
- Domo has hundreds of connectors including databases, data warehouses, cloud platforms. Also, it supports uploading a wide ranges of file extension like .odt, .xls, .csv, .xml, .json
- Dashboard loading time is really fast because Domo caches data in their propriety storage
- Have extensive permission control system that suits large enterprises
Cons of Domo. What needs to improve?
- Support issues: The sole operational factor where Domo customers evaluated it as being below average was support. Reference customers continue to cite response time and time to resolution as two of the limitations to its broader deployment.
- The back end of getting the data into the tool can be a bit complex. It's not as user friendly for non-technical users.
- While the visualization tools are excellent, extracting information from the tool has been a little bit of a challenge.
For more detailed BI tool list and analysis, check out:
4. Looker
Another Google Cloud Platform product, Looker is a powerful BI tool that provides an innovative approach for real-time data exploration and analytics.
If you are looking for a tool to centralize your business data, look no further because Looker, with its semantic modeling layer, can help you apply business logic to your data and create a single source of truth for every team to use.
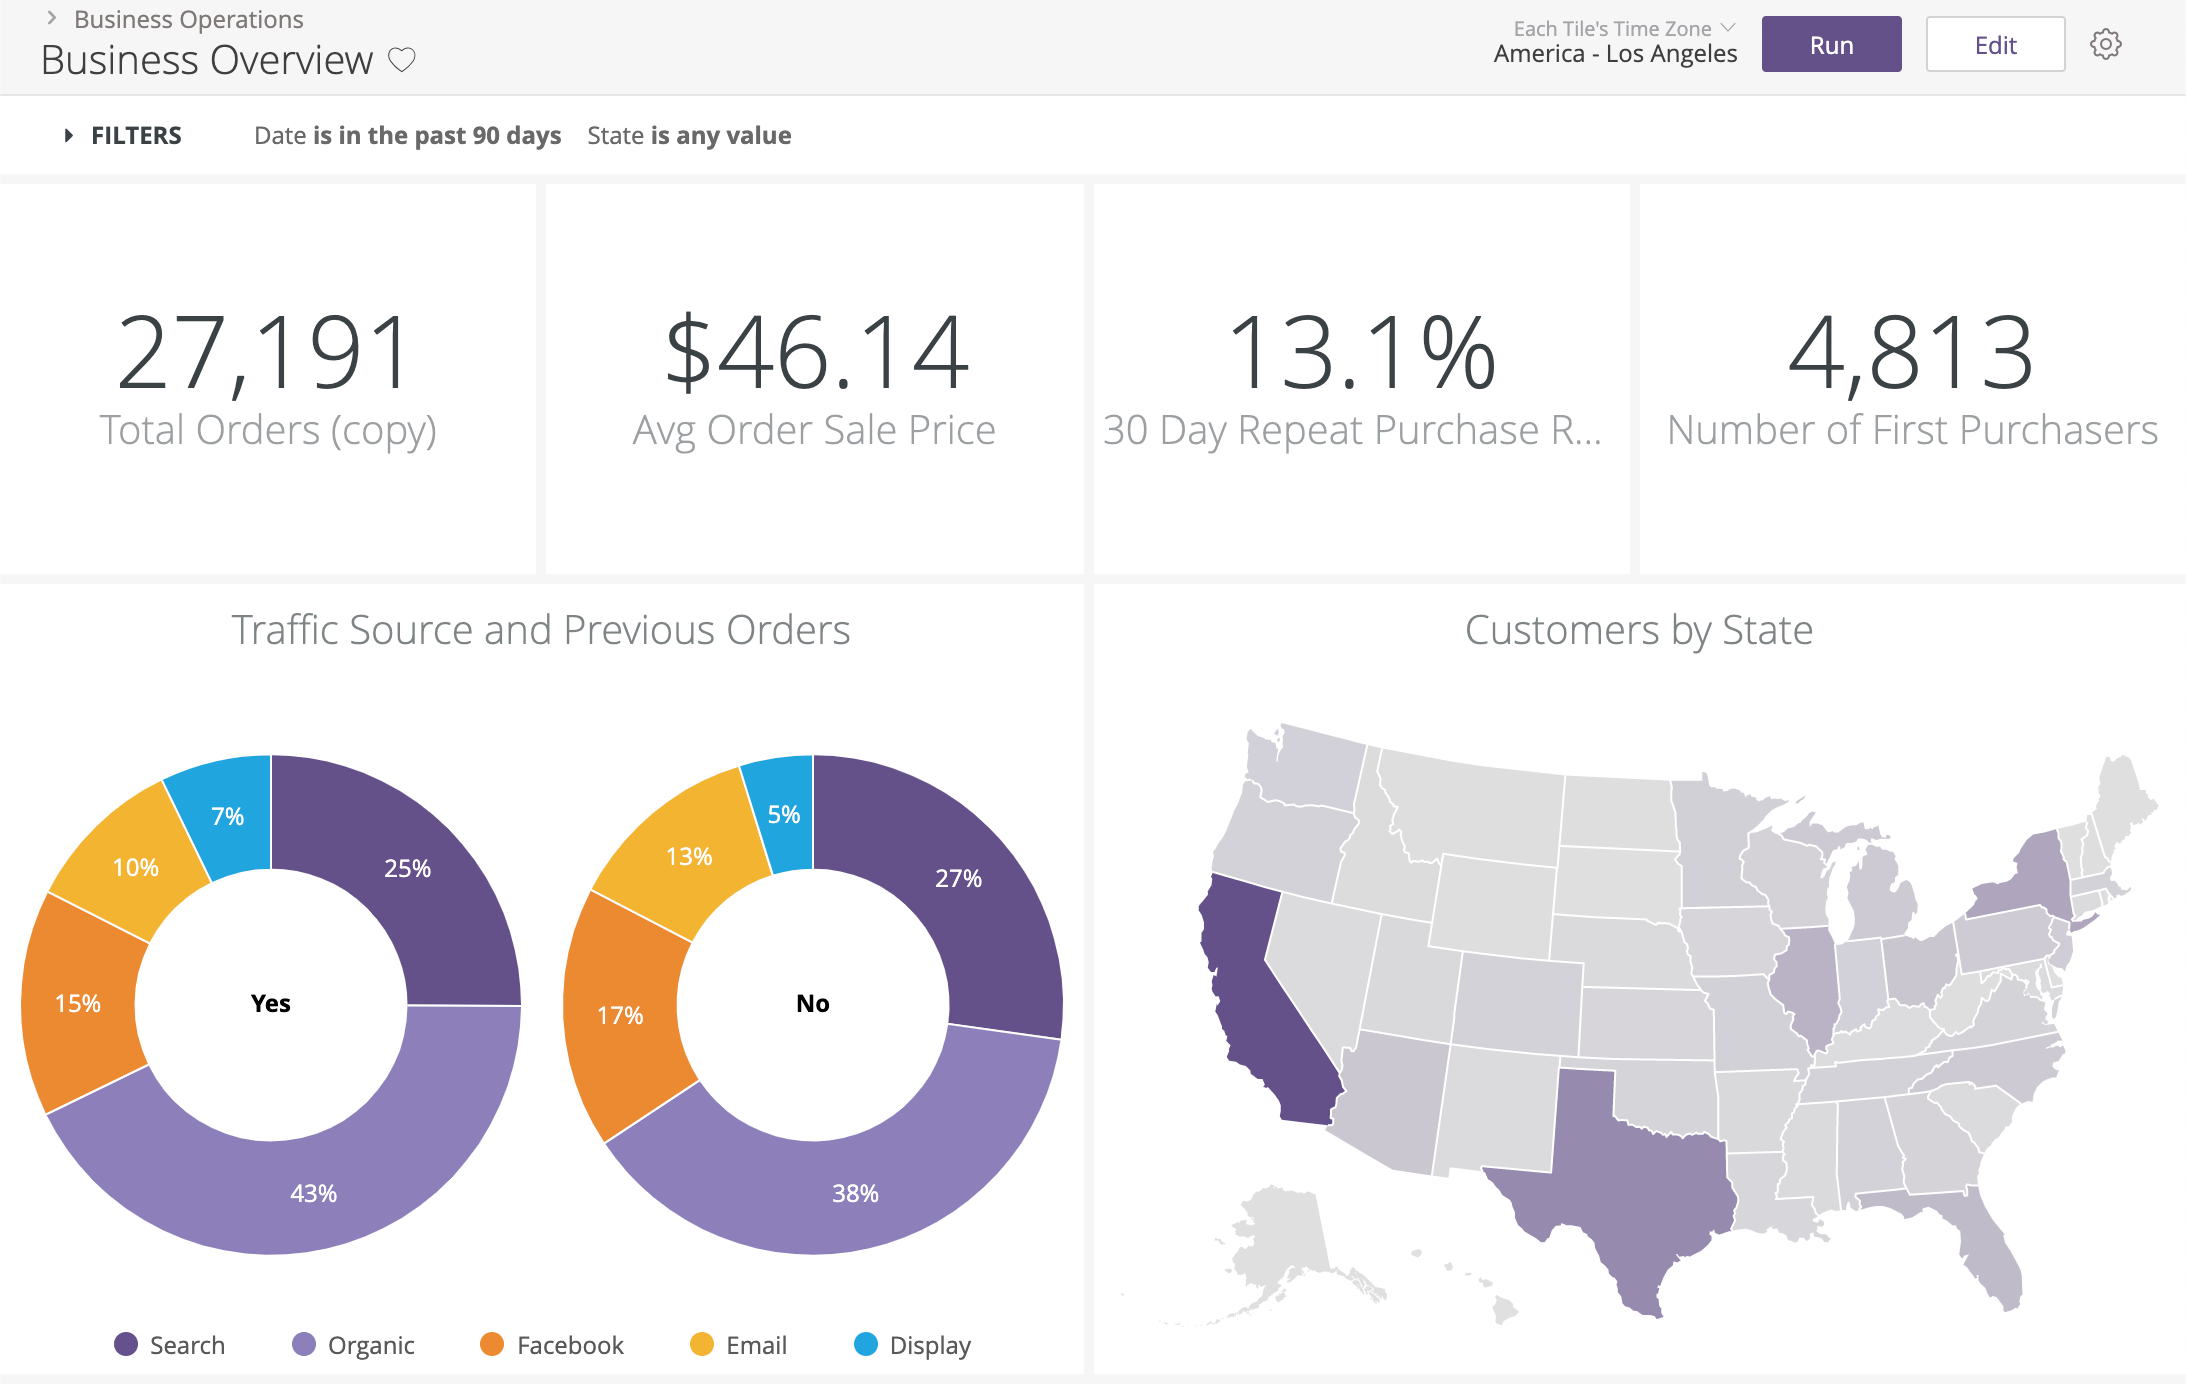 Image Source: https://docs.looker.com/dashboards/creating-lookml-dashboards
Pros of Looker
- Looker runs entirely in-browser, so there’s no need for desktop install and it's better for collaboration and data delivery between internal and external users
- Looker operates entirely on the data in your database. That means that you’re operating directly on your full dataset and getting all the horsepower of your database, whether that be an MPP like Vertica, Redshift, Bigquery; a SQL-on-Hadoop setup like Impala or Spark; or a standard RDBMS like MySQL or Postgres
- Automated reporting - Looker allows you to schedule emails for daily/weekly/monthly reports or send alerts if there are anomalies in data.
- Looker has GitHub integration, so you can see every change made to the modeling layer and combine the work of multiple developers seamlessly
Cons of Looker. What needs to improve?
- Looker has a steep learning curve when it comes to adopting a new language (LookML) & the model-view approach for the end-users. You definitely need to have an internal team that is dedicated to just setting it up and getting the rest of the people on board.
- Small errors are hard to troubleshoot and result in not using the dashboard much. No SQL CLI makes it disappointing for power users.
- Relative to other BI tools, the advanced charting functionality is somewhat limited
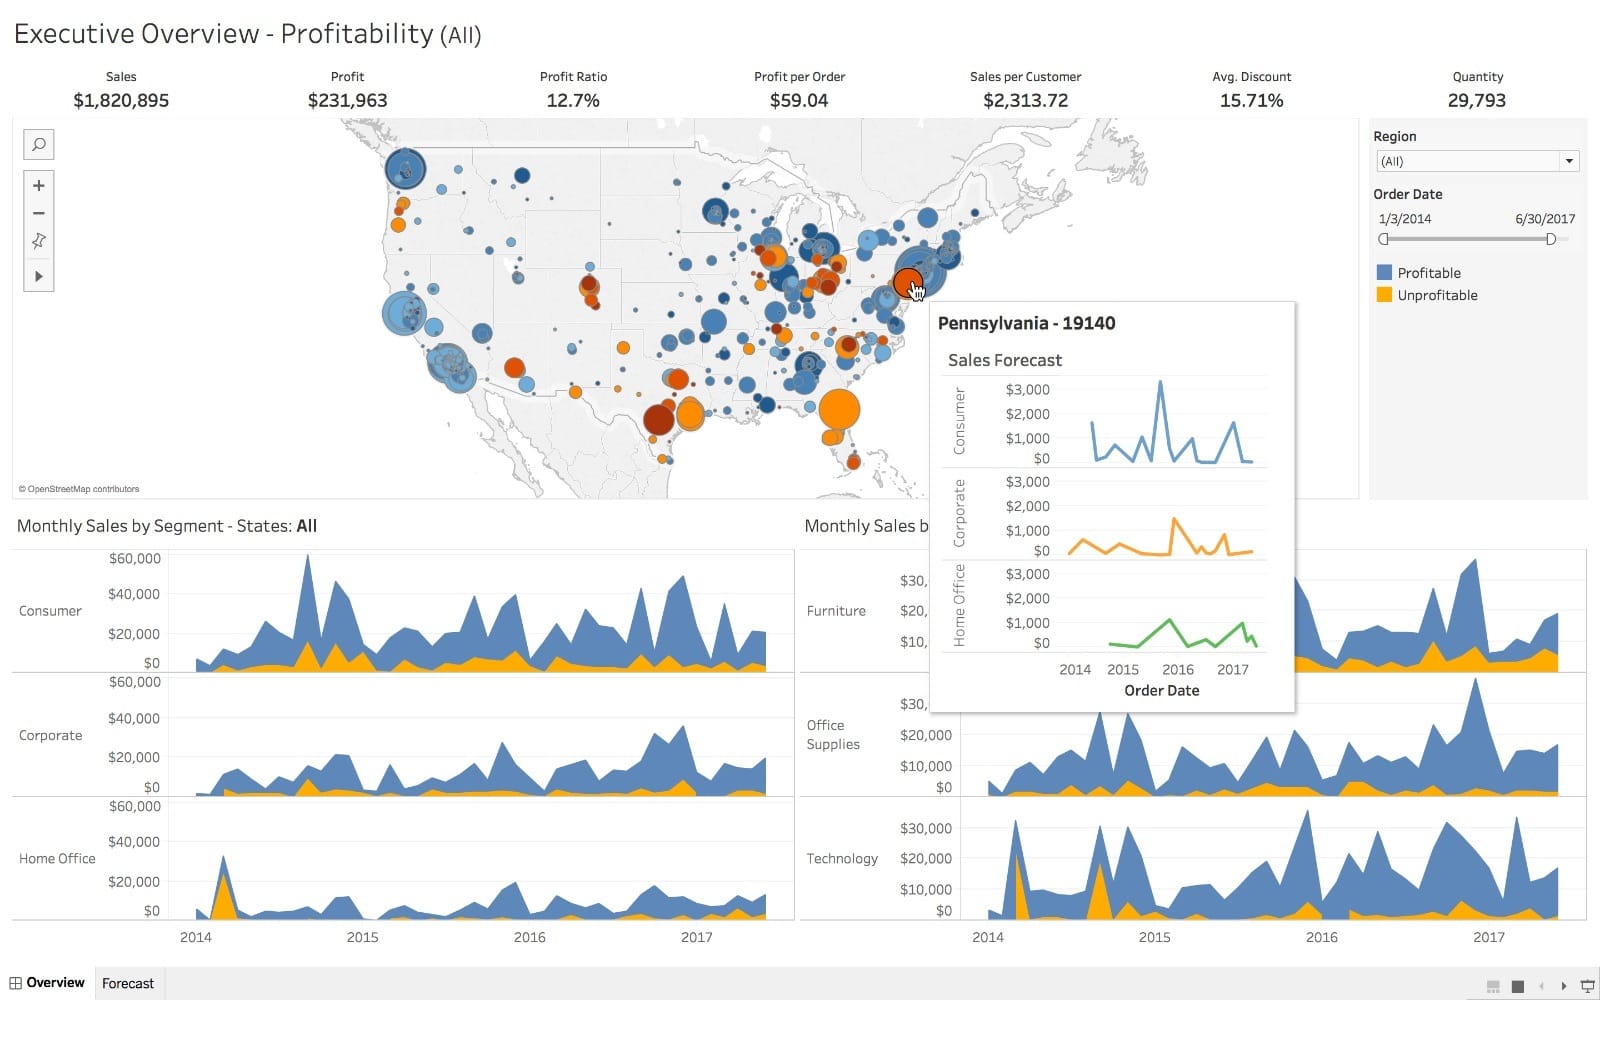
5. Tableau
When it comes to data visualization Tableau is the champion of my heart. Although the setup process might be quite overwhelming with newbies, once you get used to it, you'll find that there's a long way for other tools in the market to compete with Tableau regarding this aspect.
This is simply because Tableau has dominated the market with its highly interactive dashboards, together with its huge library of visuals and supported metadata (check out their built-in map data!)
Pros of Tableau
- Live and in-memory data – Easily switch between extracted data and live connections, set up automatic extract refreshes and be notified when a data connection fails – all through the Tableau platform.
- Secure collaboration – Use Tableau Server and Tableau Online to securely share and collaborate on key insights.
- Friendly drag-and-drop interface – With drag-and-drop abilities, easily integrate data and create visuals to pinpoint patterns with a few clicks.
Cons of Tableau. What needs to improve?
- There are a lot of features on one single interface as Tableau wants to maximize the user experience. But because there is so many things in the user interface, a lot of features go unnoticed and unused. Also since there are so many features and functionalities, it sometimes is difficult to locate a particular functionality
- Lack of BI capabilities. Tableau lacks functionality required for a full-fledged business intelligence tool, such as large-scale reporting, the building of data tables, and static layouts.
- Tableau Desktop lacks the basic functionality of cleaning and prepping the data to be imported in Tableau Desktop. This is one of the major features which it lacks, you need additional support from Tableau to get these things added.
--
All the above products have their own benefits and drawbacks. Choosing an appropriate one for your company will be depended on a lot of aspects including the size of the company, your data maturity, your budget, and importantly, the use cases you want to solve.
It is not a one-day job so my recommendation is that you should involve all the related parties (data builders and data consumers) of your company to clearly list out all the requirements, narrow down to top 4-5 tools and try out all the tools.
If you need a little more pointer to choose the right tool, you might want to check out Chapter 4 in The Analytics Setup Guidebook which will discuss in detail how you can navigate the Business Intelligence tool space.
Note: Thumbnail photo by Mohammad Rezaie on Unsplash