Top Free & Affordable PostgreSQL BI & Reporting Tools
PostgreSQL and open-source tools
If you are using PostgreSQL as your database, the chance is you have a preference for open-source tools as well.
And as the best companies and developers give away almost everything they do, we start to be overwhelmed by the options presented.
I spoke to several friends who happened to be tasked with finding a BI tool that can connect to PostgreSQL, and mind you, they really did struggle to choose one despite their seniority in the industry.
So I wrote this blog post with a hope to give you a pointer to finding and choosing the best tool for your data stack without much time invested.
The main criteria for the following tools would be either free or affordable for small-to-mid-sized companies. But don't be discouraged. Such tools still can answer both business and analytics questions. Some even deliver advanced features to meet complicated needs from your data team.
Top free & affordable PostgreSQL BI & reporting tools
- Metabase (free)
- Redash (free)
- Google Data Studio (free)
- Holistics (freemium)
- Chartio (freemium)
1. Metabase
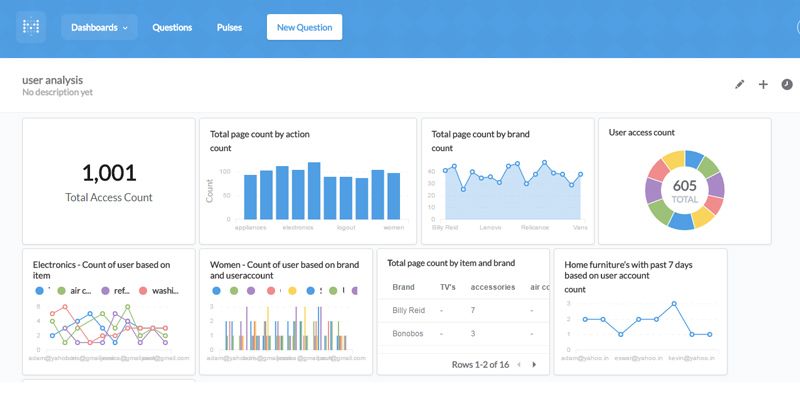
Metabase is an open-source, light-weight tool designed for non-technical users to provide big data insights and visualizations. It's loved by many non-technical users for its minimalism and user-friendly UI. I remember a time when I used Metabase and I didn't have to read their document once.
Pros
- Light weight and easy-to-set-up.
- Simplified and easy-to-use interface, which is suitable for the less technical-savvy
- Quite a large number of interactive visualization types
- Allow users to import their own map data and visualize hyper-local Geospatial data (this is what I really like!)
Cons
- Have to set-up on your own server and need to maintain the infrastructure
- Limited multiple integrations
- Limited variety of charts and settings
- Weak permission control
- Not suitable for comprehensive and ad-hoc analytics
- Rudimentary data modeling layer, nowhere near Looker's or Holistics' data modeling.
2. Redash
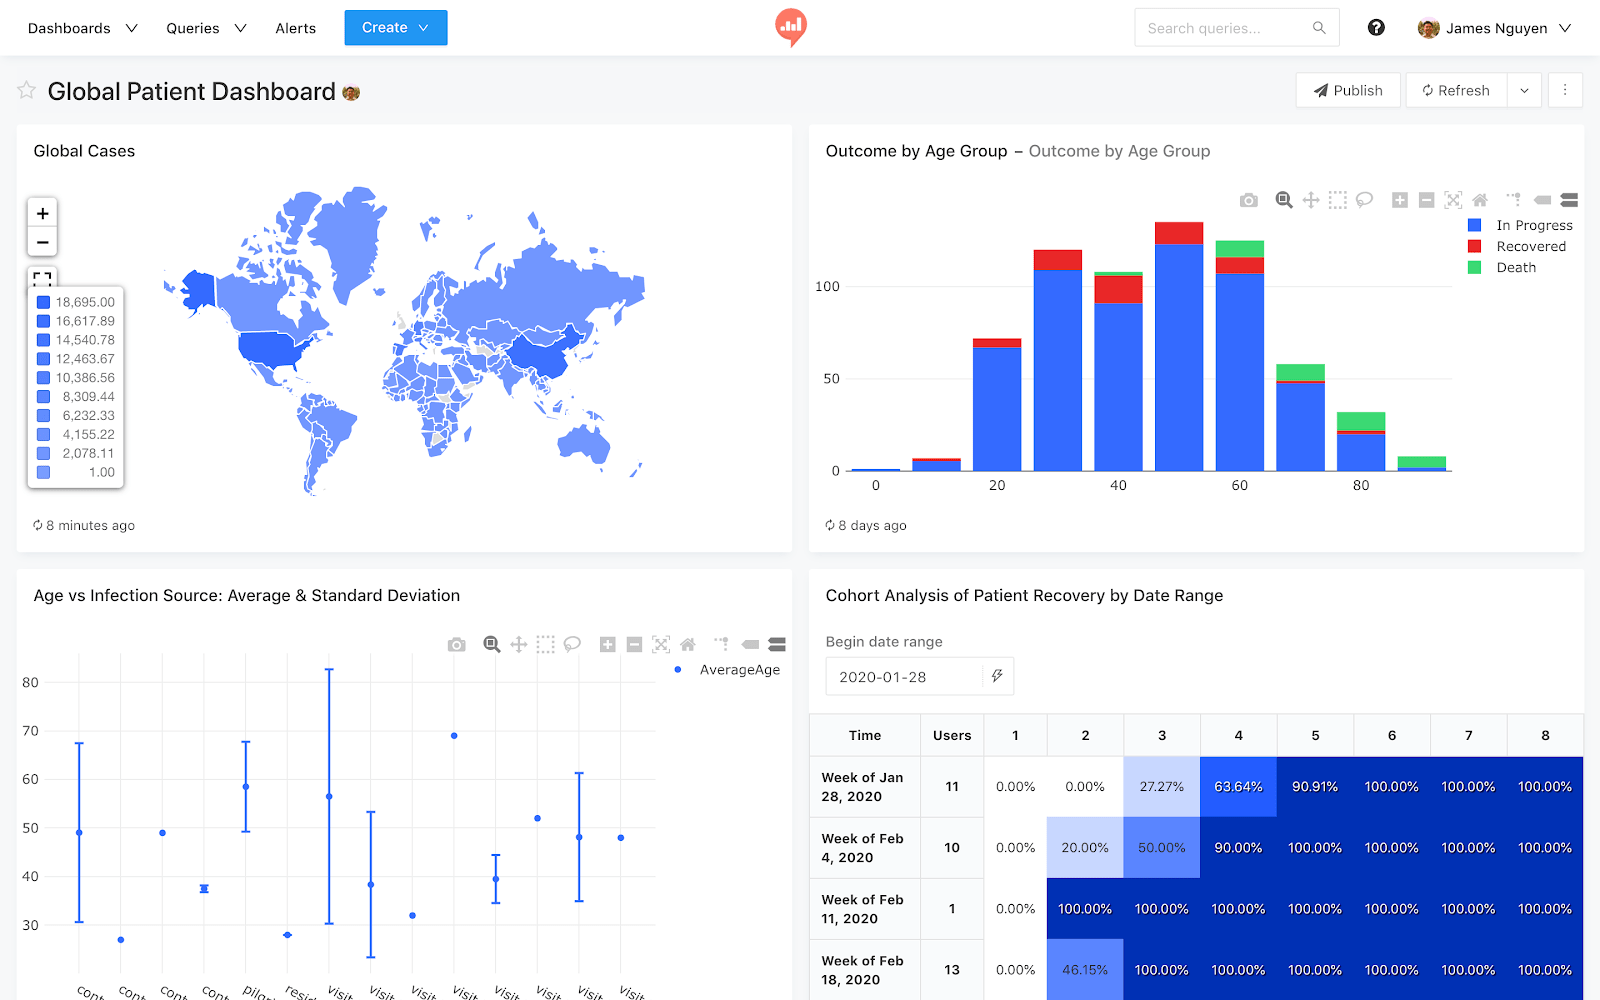
Redash is an open-source SaaS application to query your data sources, visualize data, build dashboards, and share them with your team easily. It comes with a simple but powerful interface along with integrations to Slack, Zapier, and more.
Pros
- Easy enough to set up and self-host
- Search and filter on top of queries is automated, making the setup of high-value reports simple and quick
- Cost effective (Object-based pricing and query-based pricing). Also have open-source.
- If you're a developer, you'll notice that the Redash code is well structured and very approachable.
Cons
- The dashboard and visualization features are not as advanced when compared to other tools, so if you want to create very complicated charts, you should consider again.
- Usability/flexibility like Metabase has for end-users (ad-hoc reporting without any SQL skills)
For more detailed BI tool list and analysis, check out:
3. Google Data Studio
Hmm, I should have mentioned Google Data Studio earlier. This is the first BI tool I used in my career and so my memories with it are the most lasting.
The tool seems to targets a set of semi-technical users (not me at that time), who work with numbers and know Excel very well. They might even know a bit of scripting language (Python, JS), but not technical enough to work on data infrastructure or building full reports from scratch, or building complex analysis that requires some SQL acrobatics.
Pros
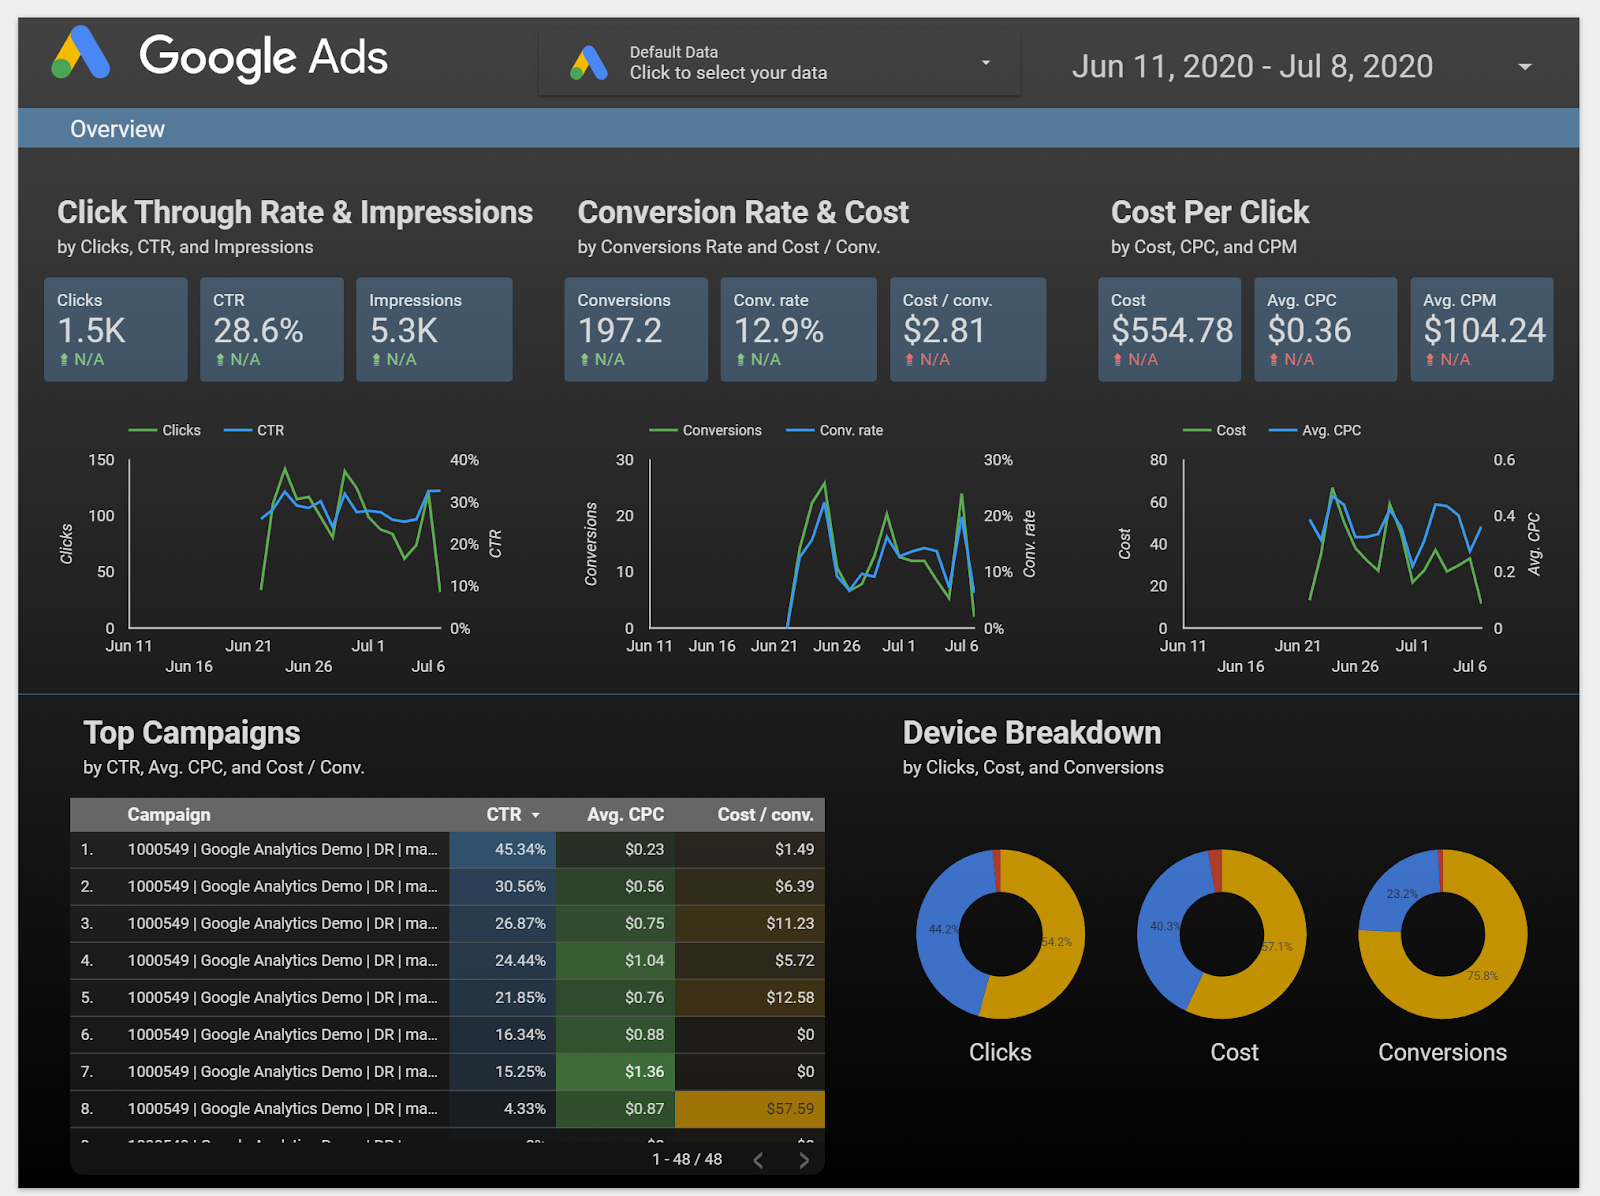
- Great report presentation layer. The image above is self-explanatory. GDS provides a highly interactive drag & drop interface, where you can freely resize and align charts.
- Easily integrate other Google products like Google Analytics, Google Sheets, and AdWords so you can have even more information
- The UI is friendly and intuitive. If provided everything, I could start building a dashboard right away without having to read any docs (oh their pre-loaded Report Templates are awesome!)
Cons
- Limited self-service data exploration capabilities. If you give the dashboard above to a user, it's highly likely that he doesn't know where to find relevant data or drill down/ drill through.
- Selecting different metrics and dimensions requires some Excel knowledge in order to combine data correctly to create graphs and tables.
- If your data source is not Google-owned and needs to be integrated with Google Data Studio, it takes extra SQL code or ETL effort.
4. Holistics
Holistics is one of those few tools that I mentioned could meet your data team's demand when it gets more complicated. Besides providing a powerful visualization layer that is easy to use for non-technical users, it also comes with a modeling layer that lets data analysts model and transforms data in PostgreSQL and many other SQL data warehouses
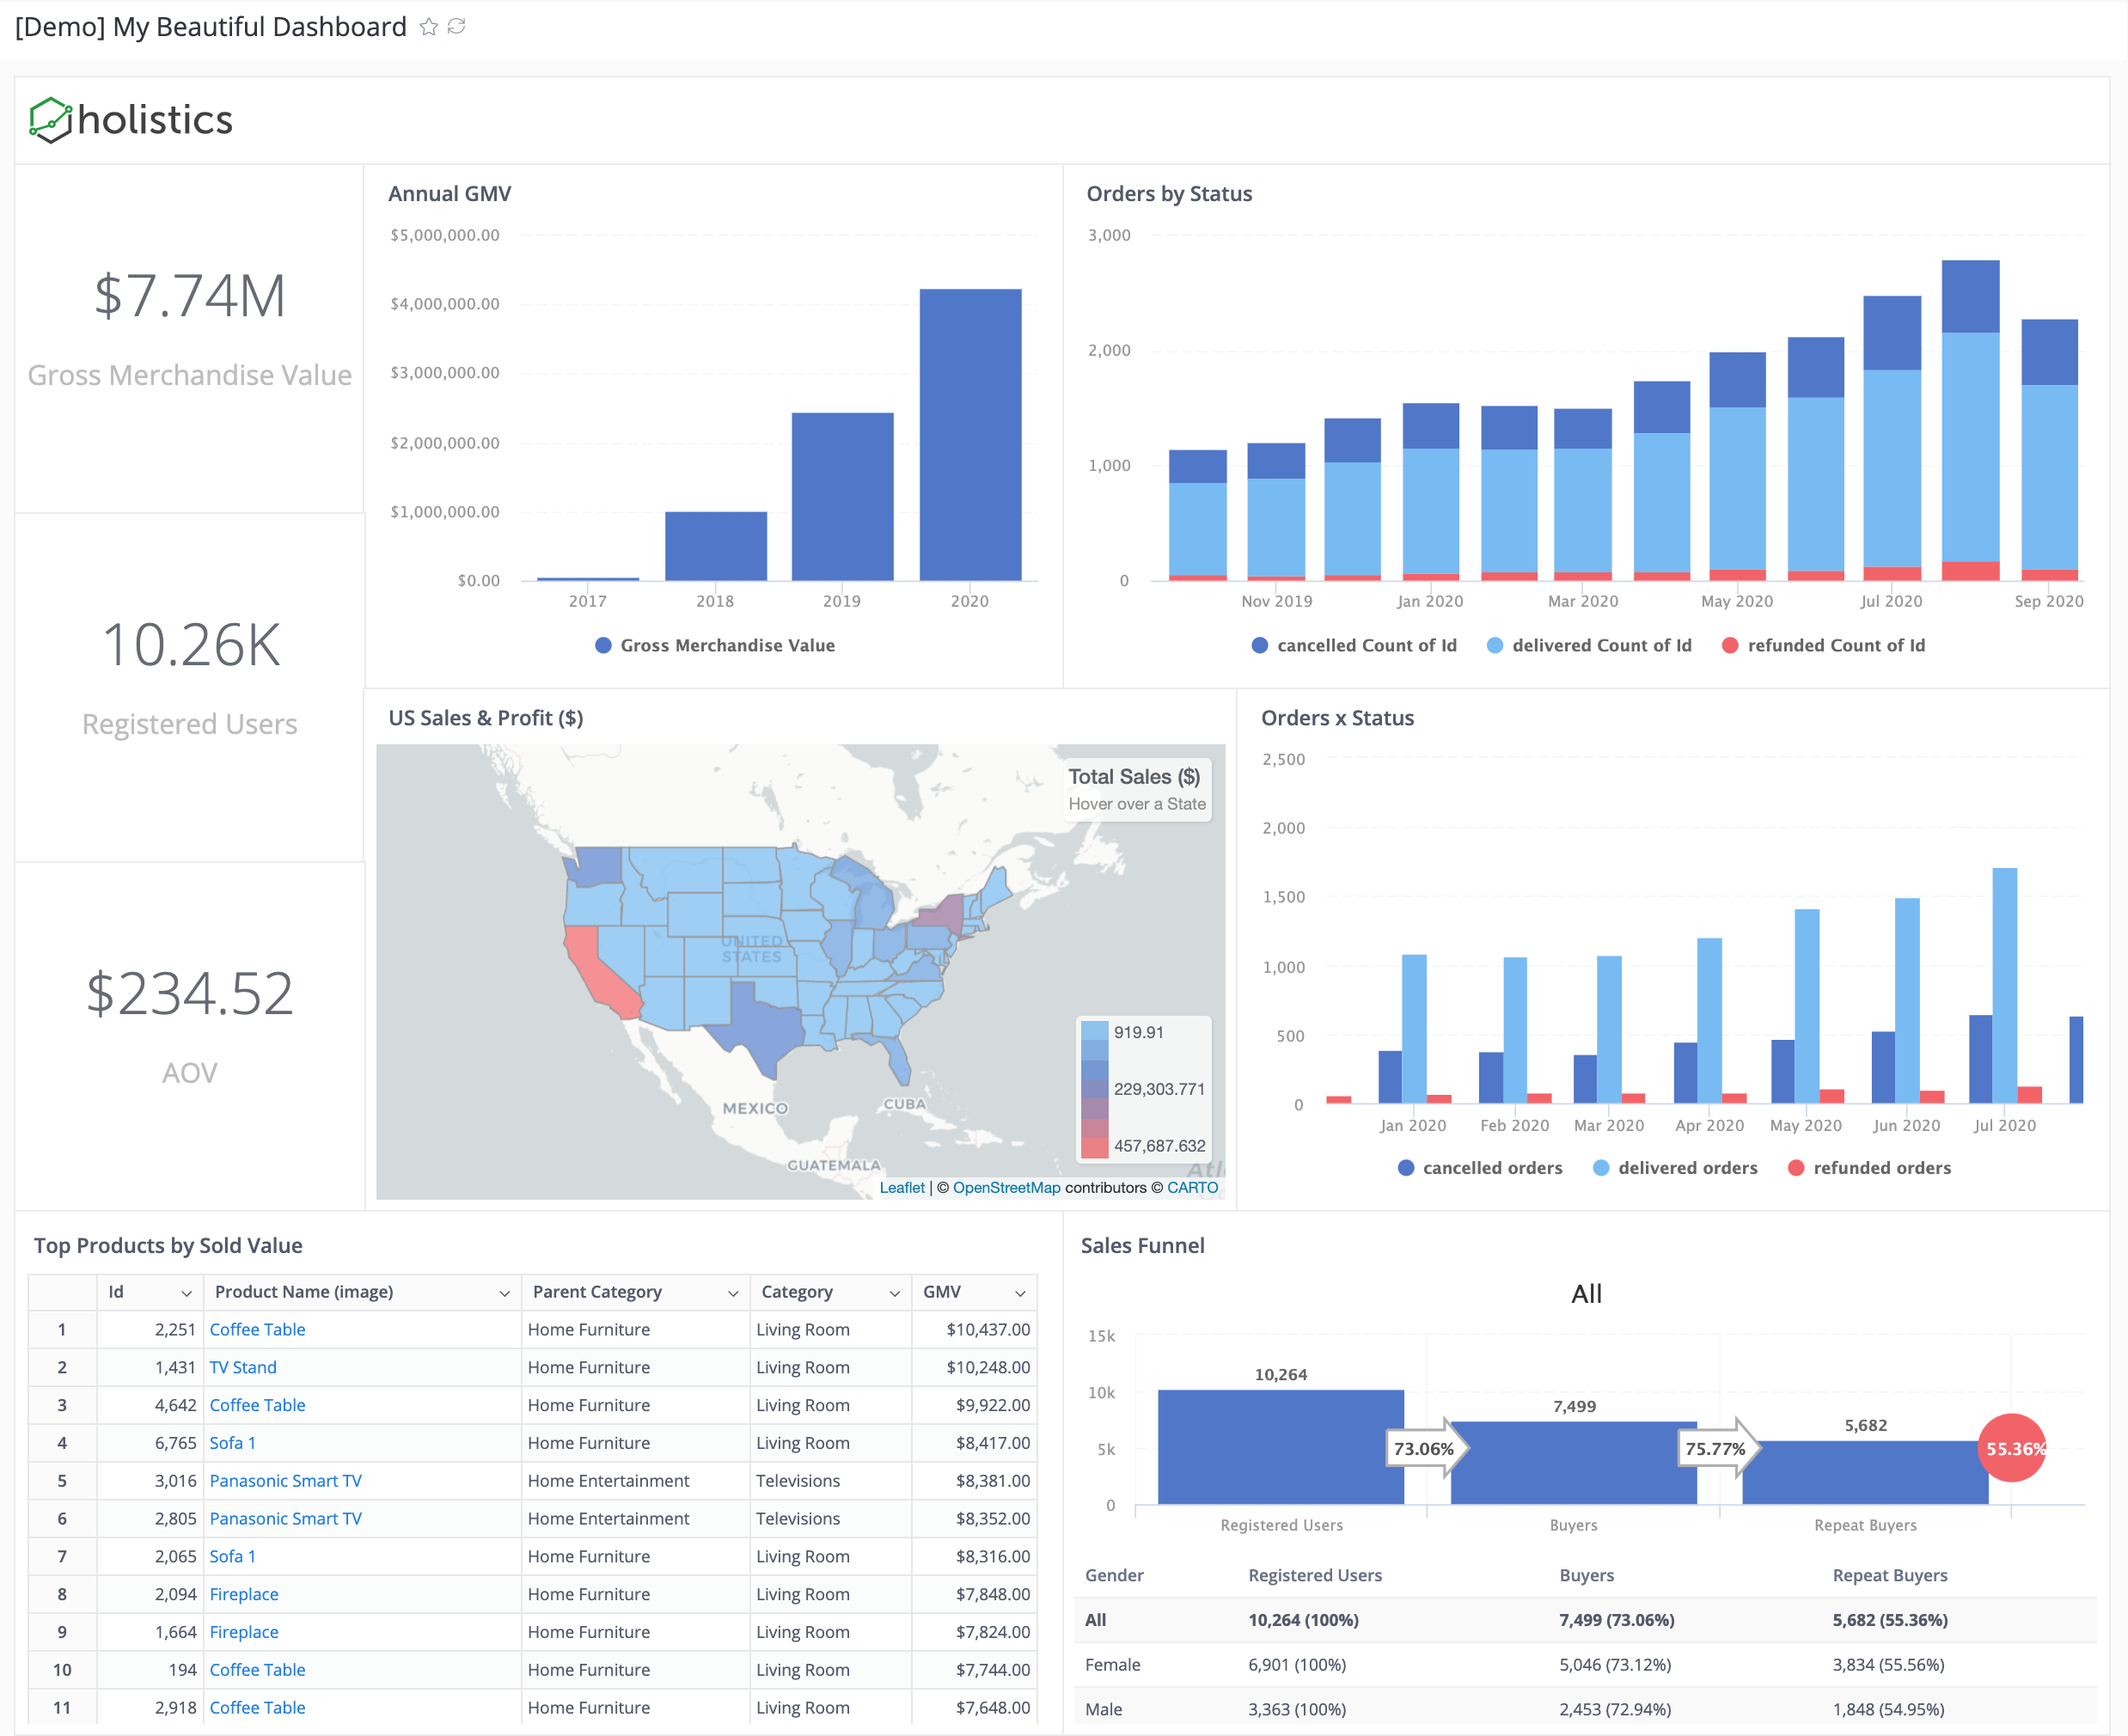
Holistics offers a free version like other products, and it only charges when your team's need scales up (need to run more queries, use more advanced analytical features).
When compared to other freemium products in the same BI landscape like PowerBI, Tableau, or Looker, Holistics' pricing is the most attractive and predictable. You may want to refer to their pricing here.
Pros
- Allow you to query the PostgreSQL database using customizable SQL queries and get fast results with its cache layer
- Materialized views of query results are stored back to PostgreSQL, for immediate access and fast visualizations and reports.
- Automated scheduling of reports and dashboards with the latest data in PostgreSQL, sent directly to your email inbox. This feature is fairly basic but not yet implemented in many other tools.
- Self-service data exploration: Drag-and-drop interface for business users to explore data and generate reports to answer ad-hoc questions.
- Analytics As-Code: Have a custom-built DSL layer (called AML) to perform mapping between database tables and business logic, thus it's more flexible and customizable.
- Git Version Control to track every change, perform branching, code reviews to ensure accurate analytics workflow
Cons
- Compared to the big names like PowerBI or Looker, Holistics.io is a fairly new tool to the market. A lot of advanced features are still on their roadmap.
- Dashboards are not as interactive as GDS or Metabase. Currently, Holistics only supports drill-down by date and drill-through to another dashboard.
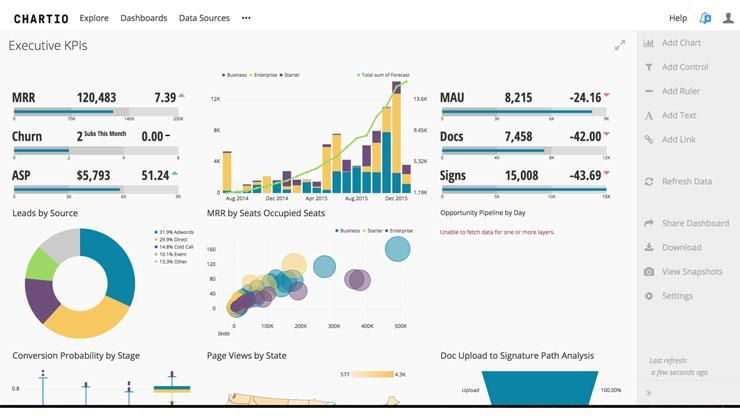
5. Chartio
Chartio was acquired by Atlassian and shut down in March 2022.
--
Chartio is a business intelligence tool that makes PostgreSQL data available for all employees (technical and non-technical alike) to query, explore, and report on.
Although it doesn't offer a free version like Holistics, its pricing is fairly close.
What I like about this tool, similar to Holistics, is that it caters to both technical and non-technical users alike. It uses Visual SQL as its visual language for querying data that allows non-technical users to build queries with no coding knowledge.
At the same time, it provides powerful query optimization on SQL, which analysts can utilize to speed up their workflow.
Chartio's pricing is fairly competitive compared to Holistics', which starts at $40 - $60 per user per month. However, if your data team is scaling fast, it might quickly creep up on your bill.
Pros
- Since it's based on SQL, you can also do some very advanced transformations.
- Chartio offers a data pipeline to extract, load and transform the data as needed.
- Great training materials.
- The tool is web-based, so it can work well with any browsers like Holistics.
- You can save your data into Chartio's datastores. Using these datastores on your dashboards makes them super fast to refresh without querying your own database. You can set when you would like to refresh your datastores.
Cons
- Visualization capabilities. There are not so many visualization options, and the charts customization is also a bit limited.
- Embedded analytics is not included in the normal price package. The price is very high if your company is small or medium-sized.
- The UI is not intuitive and simple enough for non-technical users to get used to quickly
Related reading:
Conclusion
No matter which tools you choose for your company, please remember that it is the end-users of the tools that will be the most impacted.
Whether it's you (a data analyst/engineer) or it's business users who want to explore the data on his own, any tool must be put into the real use-case with real business questions.
I hope that this blog post has been useful for you. If you want to receive more detailed comparison blog posts like this, please subscribe to our newsletter below!
What's happening in the BI world?
Join 30k+ people to get insights from BI practitioners around the globe. In your inbox. Every week. Learn more
No spam, ever. We respect your email privacy. Unsubscribe anytime.
