What is ClickHouse?
Despite being a relatively new player in the data warehouse market, ClickHouse has made its name as a tough competitor to Snowflake or PostgreSQL due to its advantageous speed and low cost.
In essence, ClickHouse is an open-source column-oriented DBMS that claims to be able to "handle tables with trillions of rows and thousands of columns". The ease to set up/ deploy, together with an active community and great documentation, has helped ClickHouse make its way to a lot of company's data stack in recent years.
However, since ClickHouse is quite new, so are its integrations. A lot of data analysts I have talked to have troubles finding a Business Intelligence tool that can natively connect with ClickHouse. Though you can use OBDC to connect ClickHouse to the most popular BI tools like Tableau or PowerBI as a workaround, that solution is unstable and complicated per se.
But all hope is not lost. There are tools out there that pioneered the movement. In this blog post, I will introduce to you the three BI & Reporting tools that can integrate with ClickHouse seamlessly without any additional setup effort.
What are the best BI tools for ClickHouse?
- Holistics
- Looker
- Redash
Holistics
Holistics is a AI-first BI tool that lets data analysts model and transforms data in ClickHouse and many other SQL data warehouses for self-service analytics. It is one of the first few BI vendors on the market that officially supports ClickHouse.
Holistics is not only preferable to data analysts. Non-technical users can run their own analysis in Holistics to generate insights without having to wait for the analysts. Holistics is best-known for its data modeling capability, which can help analysts create a single source of truth where you can apply business logic to your own data and make sure it is accurate, maintainable, and re-usable.
For more info about the Holistics and ClickHouse integration, check it out here.
Holistics Core Features
- Allow you to query the ClickHouse database using customizable SQL queries and get fast results with its cache layer
- Materialized views of query results are stored back to your own SQL database, for immediate access and fast visualizations and reports.
- Automated scheduling of reports and dashboard with the latest data in ClickHouse, sent directly to your email inbox or Slack.
- Drag-and-drop interface for business users to generate reports to answer ad-hoc questions.
- AI chatbot that allows users to ask questions in plain language and get reliable answers grounded in governed, curated datasets.
- Best-in-class semantic modeling layer that allows analysts to define and reuse metrics centrally, maintain a single source of truth for the entire organizations.
- Analytics-as-code workflows with Git Version Control, CI/CD and code reviews for better governance and collaboration.
- Competitive pay-as-you-go pricing model, which only scales as your company scales.
Looker
Also supporting ClickHouse is Looker, which is a powerful BI tool that provides an innovative approach for real-time data exploration and analytics.
Looker has powerful dashboard capabilities that can meet most companies' data demand. Like Holistics, it requires a modeling layer to store and apply all your business logic to the raw data.
This process requires an upfront definition using their own language LookML, which will take a considerable amount of time to master.
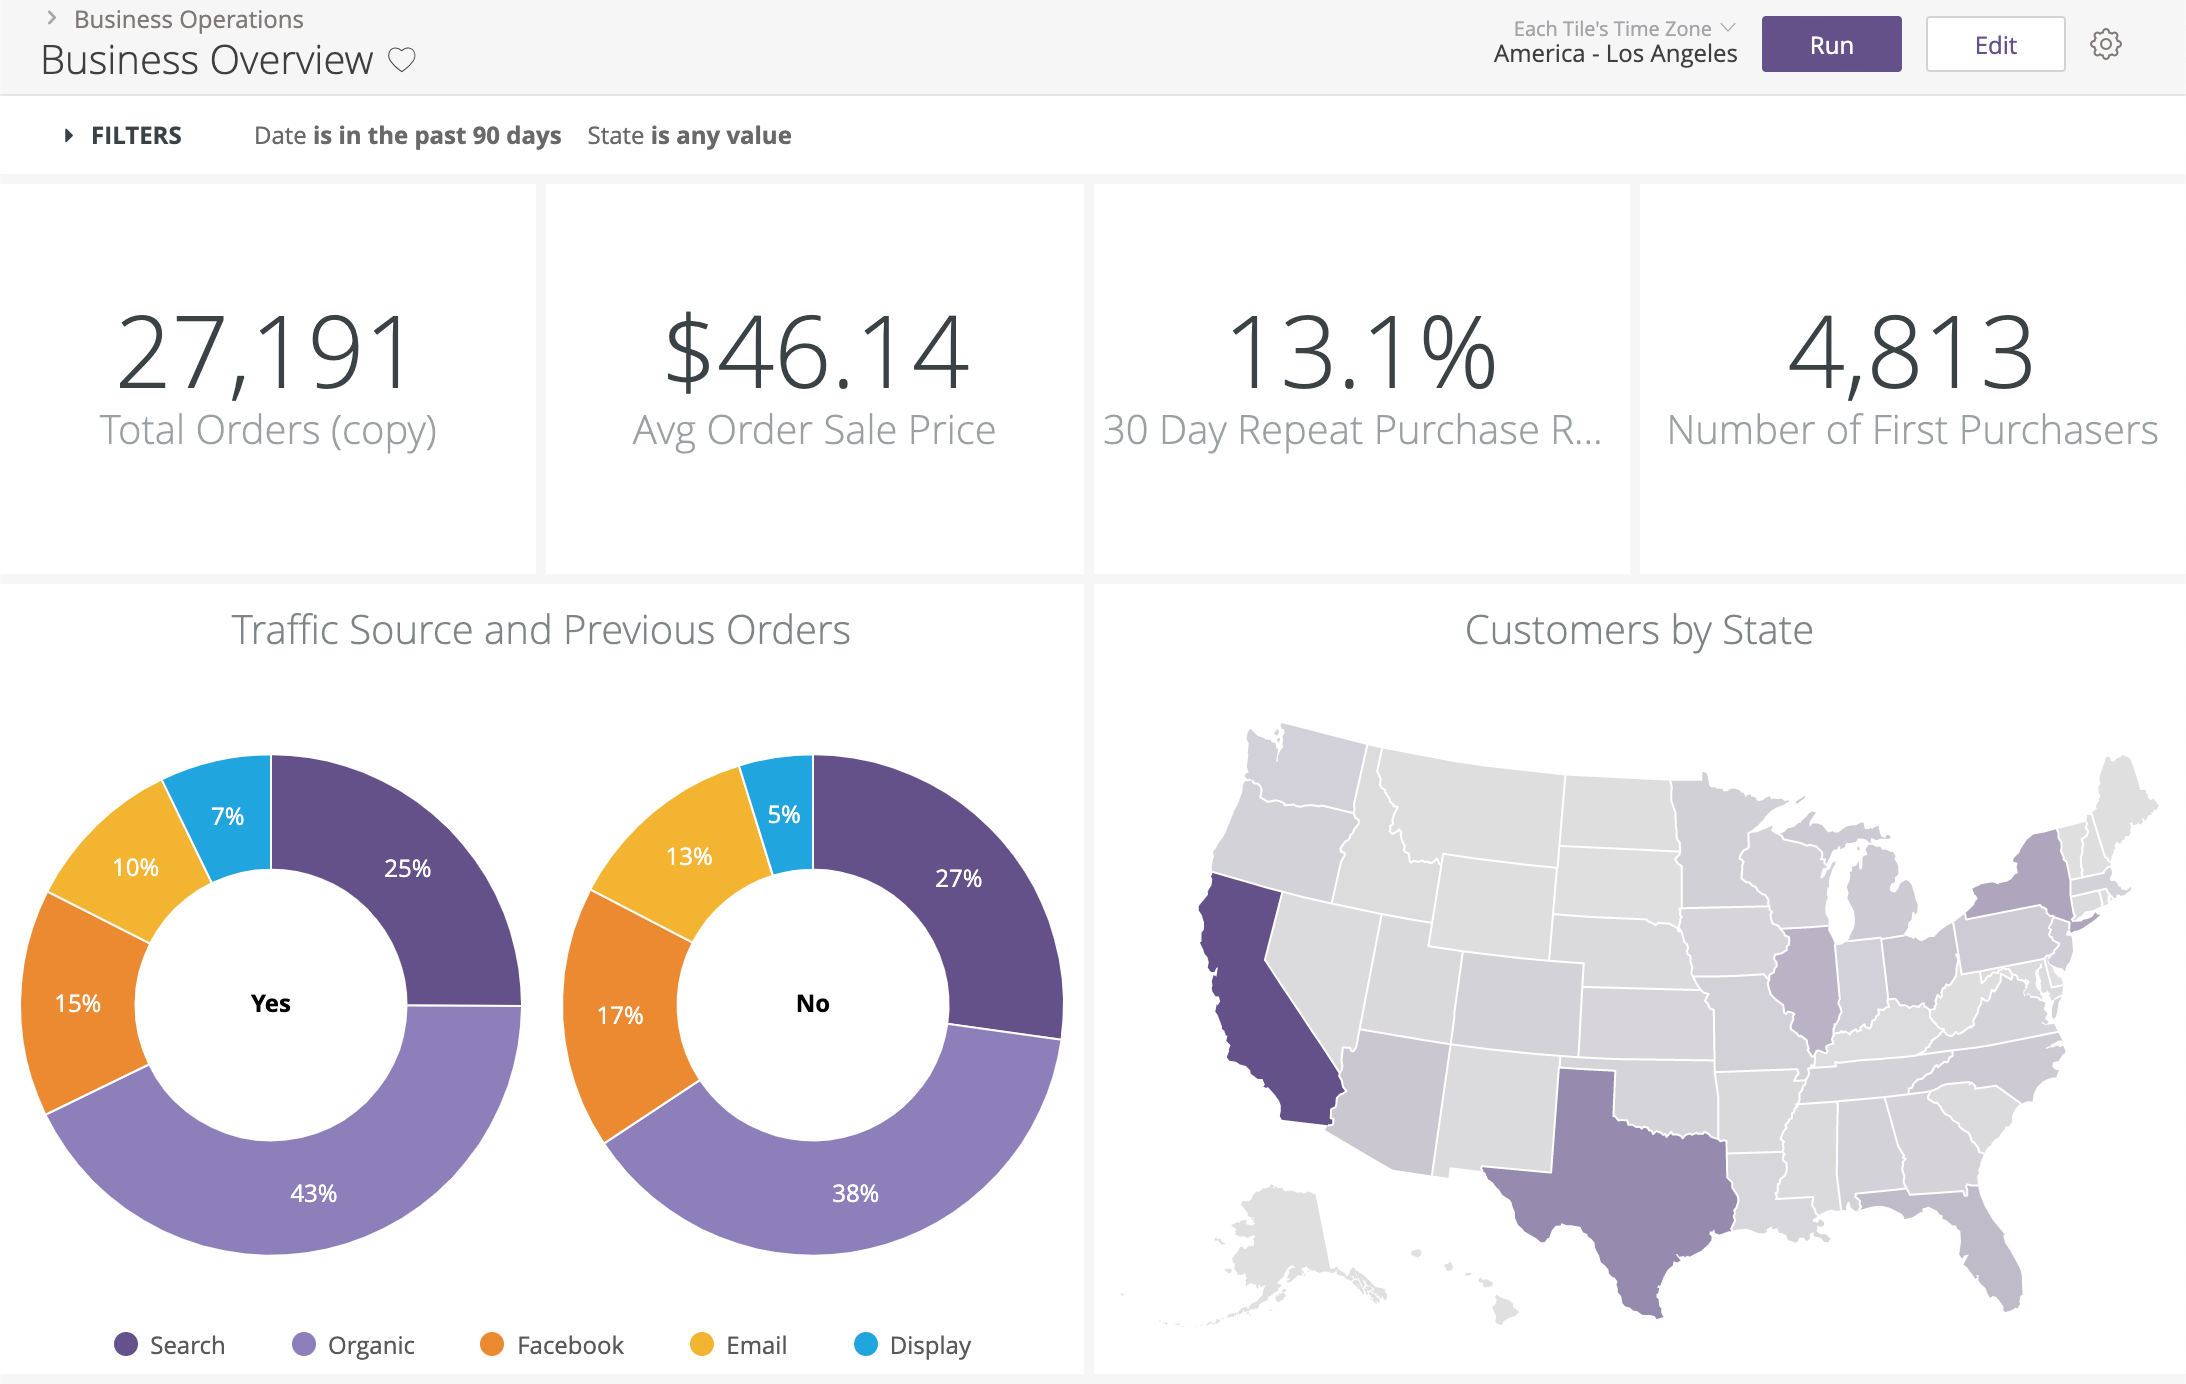 Image source: https://docs.looker.com/dashboards/creating-lookml-dashboards
To connect Looker to ClickHouse, read their documentation here.
Looker Pros
- Looker is a web-based product, so there’s no need for desktop install and it's better for collaboration and data delivery between internal and external users.
- Looker operates entirely on the data in your database. That means that you’re operating directly on your full dataset and getting all the horsepower of your database, whether that be an MPP like Vertica, Redshift, Bigquery; a SQL-on-Hadoop setup like Impala or Spark; or a standard DBMS like MySQL or Postgres.
- Automated reporting - Looker allows you to schedule emails for daily/weekly/monthly reports or send alerts if there are anomalies in data.
- Looker has GitHub integration, so you can see every change made to the modeling layer and combine the work of multiple developers seamlessly.
Looker Cons
- Looker has a steep learning curve when it comes to adopting a new language (LookML) & the model-view approach for the end-users. You definitely need to have an internal team that is dedicated to just setting it up and getting the rest of the people on board.
- Difficult to transition to another BI platform. Moving from Looker to another visualization tool will require additional work to migrate everything that has been defined by LookML.
- Although Looker provides a large library of custom charts, it can be technically difficult to customize the visualizations to your exact need.
- Looker might not be easily accessible for most small-medium-sized companies due to its pricing, which could range from $3000 - $5000 per month for 10 users with an annual subscription. Such a gargantuan upfront investment might take a deep cut of the company's budget.
Redash
Redash is a light-weight, cloud-based platform that provides small to midsize businesses with tools to query data sources, create visual dashboards, grant role-based access, and automate alerts/notifications.
Unlike Looker and Holistics, Redash is an open-source project and you can self-host it on your own server. You can learn more about why Arik - the founder - chose this approach.
To learn how Redash can integrate with ClickHouse, click here.
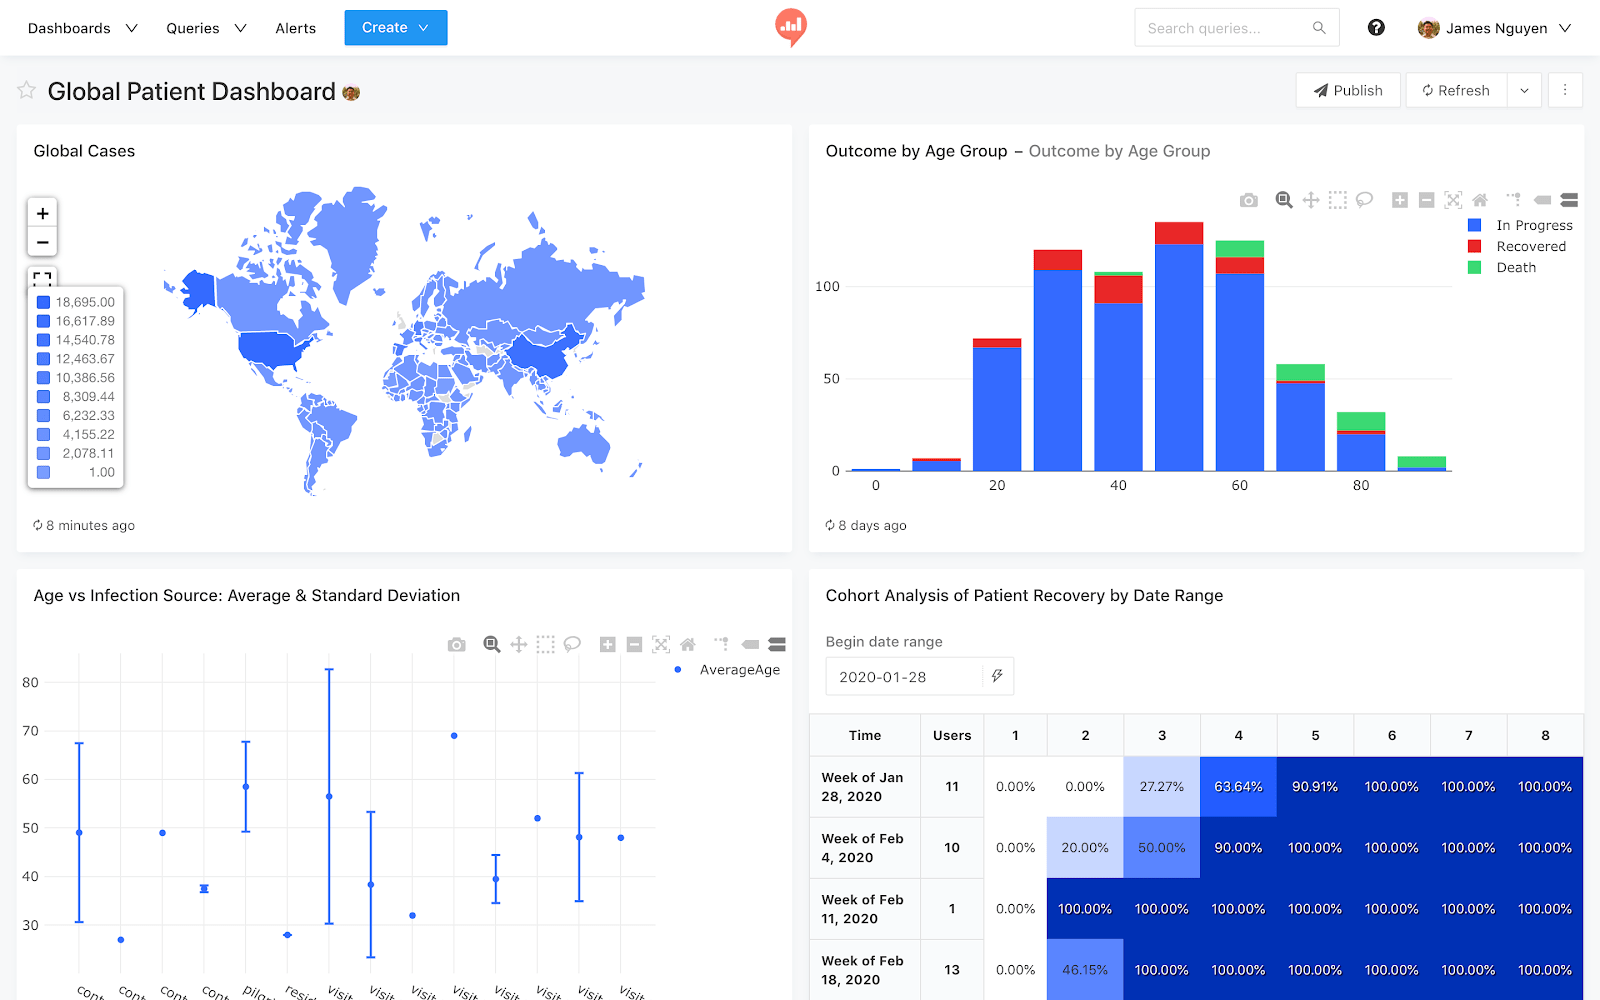 Image source: https://databricks.com/product/redash
Redash Pros
- Very light-weight and quick to setup
- Ability to add multiple data sources and join them into saved queries and dashboards for non-technical members to use on a day-to-day basis
- Attractive and flexible pricing for startups. You can use the cloud-based version starting at $49/month, or self-host it for free.
Redash Cons
- Redash is not good at self-service, business users would need to rely on analysts to build dashboards.
- This tool is better used for internal purpose, because the visualization features are not advanced and thus presentation for external parties might be limited.
- The company must invest in maintaining and updating the product frequently if they self-host the product.
Conclusion
If you are from a startup looking to adopt a light-weight, cost-effective BI solution for simple analytics need, then Redash is second to none.
However, if you need to create more complicated charts and execute heavy data modeling/transformation then Holistics is undoubtedly a better option.
You may consider moving to Looker if your company has a dedicated data team whose members are competent enough to learn LookML, and have a huge budget allocation for data analytics each year.
--

Data Engineer turned Product; writes SQL for a living.