Startup Data 101: Building Scalable Data Infrastructure With Holistics (Rezdy Guest Post)
Infrastructure is only as good as the business value it provides. The use of data in a startup, becomes increasingly important as its number of users grows.
This guest post originally appeared on Medium, on the Rezdy Engineering blog
Introduction
The use of data in a startup, becomes increasingly important as its number of users grows. In the early days of any B2B startup, you have to meet with every single customer yourself to get them on-board, so understanding what will get them using the platform becomes a case of simply asking them. However, as a business scales, this approach to making decisions no longer works.
You could refer to this process as growing pains and every company experiences them. As you grow, what worked yesterday may not work tomorrow.
At Rezdy one of our company values is:
“Let Data Drive Decisions”
This value in particular is one that supercharges all the other values, but it is also one that has experienced a large portion of the growing pains.
When I joined Rezdy in mid to late June 2018, the company was using multiple different reporting tools. This collection of tools was gathered to solve problems as they arose, and similar situations are not uncommon in organisations where no dedicated team is focused on best practice and ingestion of data.
Different teams within the business have different needs and will use the tool that best serves their purposes. This fragmented system, however, makes it particularly difficult to get a complete picture of your customers and your business.
We cannot follow a user through all of these tools, therefore we rely on aggregations which makes optimizing any dimensions along the users journey cumbersome or often impossible. Dimensions can be identified as any variable which groups or segments your users such as geography, the channel through which they arrived on the site, the sales rep they spoke to, the vertical they belong to etc.
In order to improve on this we rely on a set of core philosophies.
Core Philosophies
Tools not reports
We build tools not reports. This is in reference to the old adage
“Give a man a fish and you feed him for a day. Teach a man to fish and you feed him for his whole life.”
We aim to empower people to be able to find the answers to the questions they have, not to provided them the answers directly. People sometime refer to this as democratizing access to data.
This one can be a bit tricky to navigate as building tools is slower than building reports, but the long term payoff is more freedom to do value adding activities instead of pulling the same report for the 100th time.
Be the paved path
Everything we build is optional. Our objective is not to force anyone to give up what they are using to use our new system. We want business users to use our infrastructure and tools because it is the easiest way for them to get things done. We want to be the nice paved path, and if they want to venture off the path into the unknown they can.
Single source of truth
This philosophy might sound like it conflicts with “Be the paved path” but in fact they work together. In order to be the single source of truth all of our output needs to be dependable and accurate. This aligns with our philosophy of “Be the paved path” because we will inevitably form conflicting conclusions when people choose their own path, but we will have a better understanding of the data when we determine why this is the case. This will allow us to ensure that we’re building the path in the right direction.
Built for scale
It is rare to find part of a data stack that will work well no matter your scale. So as a next best thing we’ve focused on a modular stack. This means that we can substitute components that are no longer fit for our level of scale, with solutions that work better and cause minimum disruption. This means a strict avoidance of those all-in-one solutions, and making sure that our data remains in our control.
Do the simple thing first
There are plenty of exciting advancements right now around machine learning, big data, the blockchain etc and its easy to get distracted. Rezdy has an overwhelming variety of exciting potential projects, so we need to make sure we answer the simple questions first and iterate from there. An iterative process means that every step is a deliberate one, and will hopefully allow us to avoid building things that won’t be used.
Build for 1 persona at a time
This one applies more heavily at the start of this process but it effectively means that we will try not to be a Swiss army knife. Trying to build something that works for everyone right off the bat typically means you have something that works for no-one. By building a path for one end user at a time we believe that we will be able to better avoid a fragmented solution in the future.
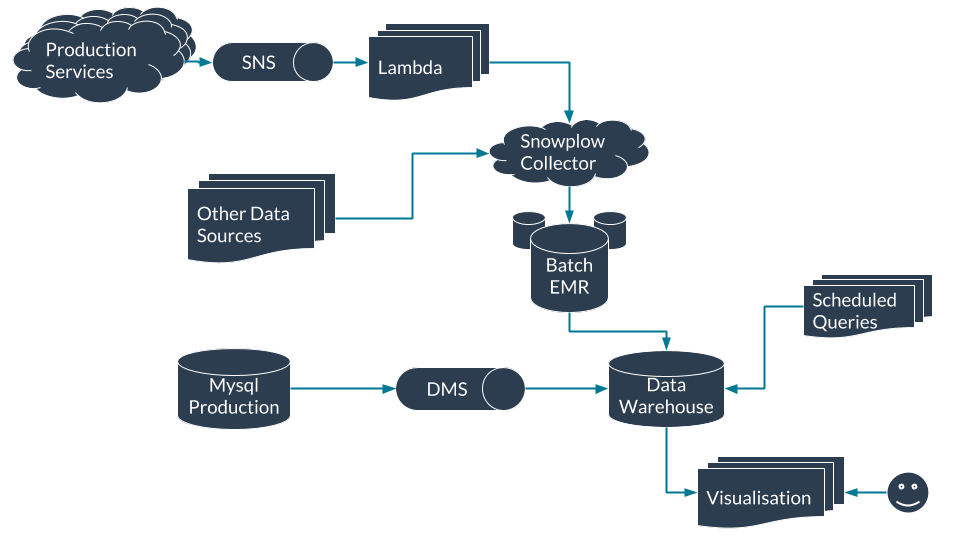
Infrastructure
Overview of key data technologies at Rezdy
Three technologies worth highlighting, that we use at Rezdy as important parts of our data stack are:
- Snowplow (events data collection)
- Amazon Redshift (data warehouse)
- Holistics Software (scheduled queries and data visualization)

Ingest
The core part of our data ingest is Snowplow, an open source data and analytics pipeline that stages our events in S3 before loading them into our data warehouse.
Snowplow allows us to ingest the raw events and store the data ourselves. As all of our data is stored in a database we control, we can use it as we please. This allows us to use the appropriate solution for any problem we are trying to solve.
We’ve partnered with Snowflake Analytics to maintain and build connectors for our other data sources. This partnership enables us to focus internally on best serving relevant data to the rest of the business while Snowflake focus on building and maintaining tools and integrations.
Data Warehouse
As this will be your single source of truth your choice of data warehouse is an important one. Amazon Redshift is where we warehouse all of our data. It may be tempting to use a familiar DBMS like MySQL or PostgreSQL, or to leverage your existing production database. This is a really bad idea and you may end up affecting the performance of production applications that rely on whatever database you’ve chosen.
To ensure that there is no impact on production data or performance, it is essential that a separate database is used for data warehousing. Even then MySQL or PostgreSQL are not ideal options. These are row based databases which effectively means that they are really good at finding a value in an indexed column and returning the whole row. This is the typical workload when the database is being used by an application. But an analytical workload typically involves mass aggregation of different columns to return some count or sum. Row based databases are sub optimal for this kind of workload.
This is where columnar databases like Redshift, BigQuery and SnowflakeDB come in. These are sometimes referred to as Analytical databases because their distributed and columnar structure is optimized for that analytical workload. As you collect more data this makes a huge difference to query response time.
As we scale we may replace this for Amazon’s Athena or Facebook's Presto. With Snowplow staging everything in S3 this transition should be relatively straightforward. However at the current rate we are collecting data, Redshift should be a suitable solution for many years.
Using Redshift was an obvious decision for us because Snowplow has supported it for some time, all of our production services exist on AWS already and like most services on AWS it is very easy to setup and scale as needed.
Scheduled Queries
This is where our Data Model lives. We use scheduled queries to take events from all of our various data sources and turn them into a useful table that can be used either directly by the rest of the company or visualized depending on the technical ability of the end user. Like any relational database, we focus these tables around entities such as a company or an order. Here we want to precompute as many common and costly fields. For example at Rezdy we store calculated fields like the total number of orders each company has made so that it can be easily consumed by the businesses without having to be re-calculated.
Queries are scheduled to drastically reduce the amount of computation that needs to happen when a visualization is loaded. Activities such as channel and financial attribution can be quite complex, but once they have been calculated don’t change, so it makes sense to calculate them once.
We use Data Transforms in Holistics.io to manage, organize and schedule our data model queries. It provides a simple and cost effective solution when compared to hosting something like Luigi or Airflow for SQL only ETL. There is a point where you need to decouple your storage and compute. When this happens, a more suitable solution such as triggering Spark jobs from Airflow, may be considered. However I would recommend pushing SQL based ETL on your data warehouse as far as you can. There are massive efficiency gains that can be realised by setting up the keys on your tables properly, and the structure of your query can make a huge difference on performance.
Visualisation
Visualisation is the primary way that the business consumes data. Because of this it was critical that data could easily be shared between members of the business. We use Reporting Functions within Holistics.io to make this possible. Sharing and flexibility were the most important factors when making this choice. We wanted everyone to have access and be able to find what they are looking for. This means that the platform had to be browser based as link sharing is the fastest way to get the data into the hands of the people that need it. Holistics offers link sharing to non logged in users for free which means that there is no monitoring licenses as the business grows and more individuals require access to the data visualisations.
There are two main aspects of flexibility which were important to us. Firstly, people need to be able to export the data-set that generated the visualisation. This is critical because no representation is perfect and so allowing people to take the data and manipulate it in excel is sometimes the most effective use case. The second aspect is filtering. Holistics uses filters that pass parameters into the query itself. This is preferable to filtering on the results alone as it reduces the amount of data being returned to the browser and it allows for more flexible manipulation of the query that isn't possible by filtering the results alone. There is a risk that results will be slower as the query needs to be re-run every time, but the performance can be improved by taking the time to properly optimise inefficient queries.
Future steps
Infrastructure is only as good as the business value it provides, and so the next big step for us here at Rezdy is establishing the internal processes and metrics required for next level growth. With a really clear picture of what we are trying to achieve we will be able to best utilize the infrastructure listed above. With clear objectives and a higher level of visibility on performance, teams at Rezdy will be empowered to continually optimise, and confidently make business and product decisions. This is not a quick, one-size-fits-all solution, the process of refinement and understanding takes time and, as with any cultural change, is filled with challenges to be overcome. However through iteration we can be sure that the steps we are taking are the right ones, that will allow us to better serve our customers, build a better product, and make better internal decisions.
_ Thanks to Chanel Tattler and Ricky McAlister. _

https://www.linkedin.com/in/louisrankin0/