Measuring a Company When a Company Is Mature
This is the final part of a series on business fundamentals for data professionals.
In How Metrics Change When Your Company Grows, we introduced the idea of the three stages of company growth:
- Product
- Scale
- Operations
We’ve covered product and scale stages in previous posts, so it’s time now to turn our attention to the operations stage, the last stage of company maturity.
The business fundamentals at this stage are different again from the previous two stages.
At the operations stage, you’ve grown successfully and may be considered a mature company. If you’re venture-backed, it is likely that you’re preparing for an IPO at this stage. If you’re not venture-backed, it’s almost certain that the company will now be managed for cash, not growth.
In either case, the pressures on the managers are somewhat similar. Companies that are preparing for a public offering will begin to dress up the numbers in order to make everything look pretty, the same way that you might groom yourself before an important dinner.
Because growth slows down in a mature company, business managers will have less incentive to invest in pure growth. Prudent managers may rein in costs and focus on efficiency instead. But this intent is balanced against the fact that the business will begin throwing off some serious cash.
Why does this happen? Well, recall what we said in the ‘scale stage’ — growing companies are rarely cash flow positive, since every spare dollar goes back into expanding the business. This means that the operations stage is the first stage where you can actually enjoy your profits.
In simple terms, the operations stage is different because you’d have ‘made it’. You are generating cash instead of setting everything on fire; your investors will be able to take a close look at your financials (which are all black, and not bleeding red!) to see if the business is a sound one. The managers of your company begin to shift focus to efficiencies; not rocket fuel for expansion. You begin to become a boring old company.
Fixed Costs, Variable Costs
This essay has two goals: the first is to communicate the basic business principles of the operations stage, and the latter is to connect it to your experiences as a data professional in such a company.
When the business people at an operations stage company look at the business, what do they see? They see revenues, profits, and costs. So this is where we shall begin.
We’ll start from the basics:
- Revenue is how much money your company makes.
- Profits are revenues minus costs.
- Therefore to increase profits you can increase revenues or decrease costs.
- But if you're in a mature market or business, revenue begins to plateau. So that means some of your attention now turns to measuring and managing costs.
Costs are interesting. It turns out that costs aren't just one thing. We can split costs into fixed costs and variable costs.
Fixed costs are costs that do not increase the more customers you have. For instance, if you’re a software company, you can probably grow the company to a million dollars without hiring more than a handful of people. The rent you pay on the office is a fixed cost: they do not go up the more customers you have.
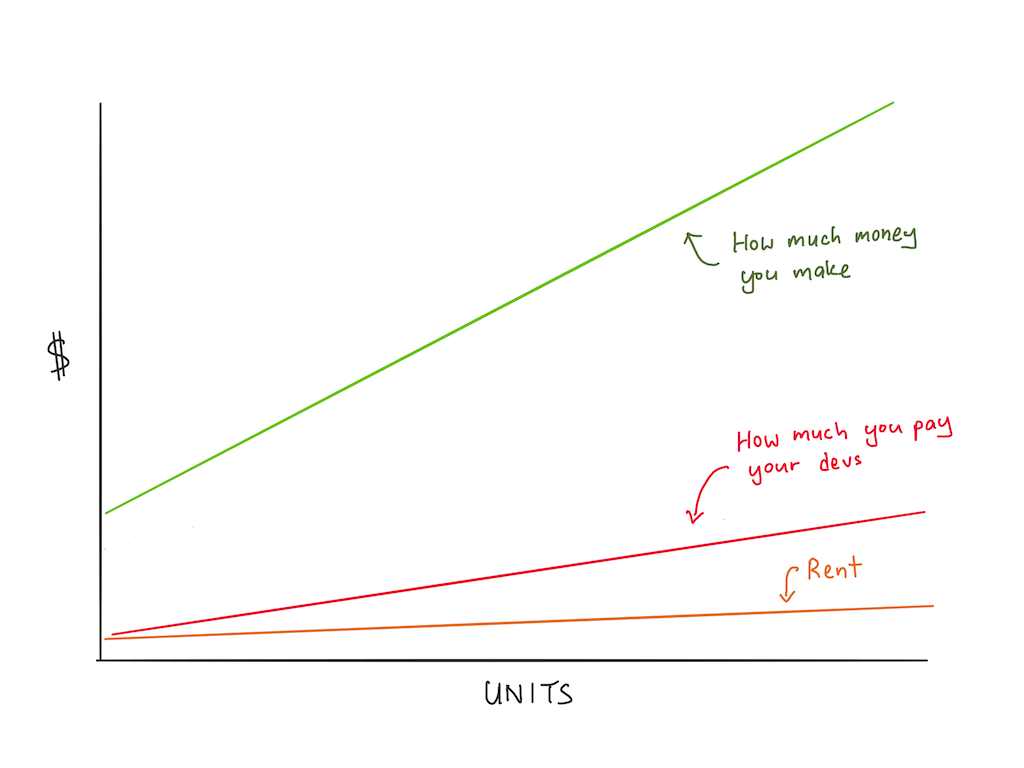
On the other hand, you have something called variable costs. These are costs that go up the more customers you have. Take a company like Apple, for instance. The more iPhones they sell, the more chips they have to buy from suppliers. This is known as ‘cost of goods sold’. It goes up the more customers they have.
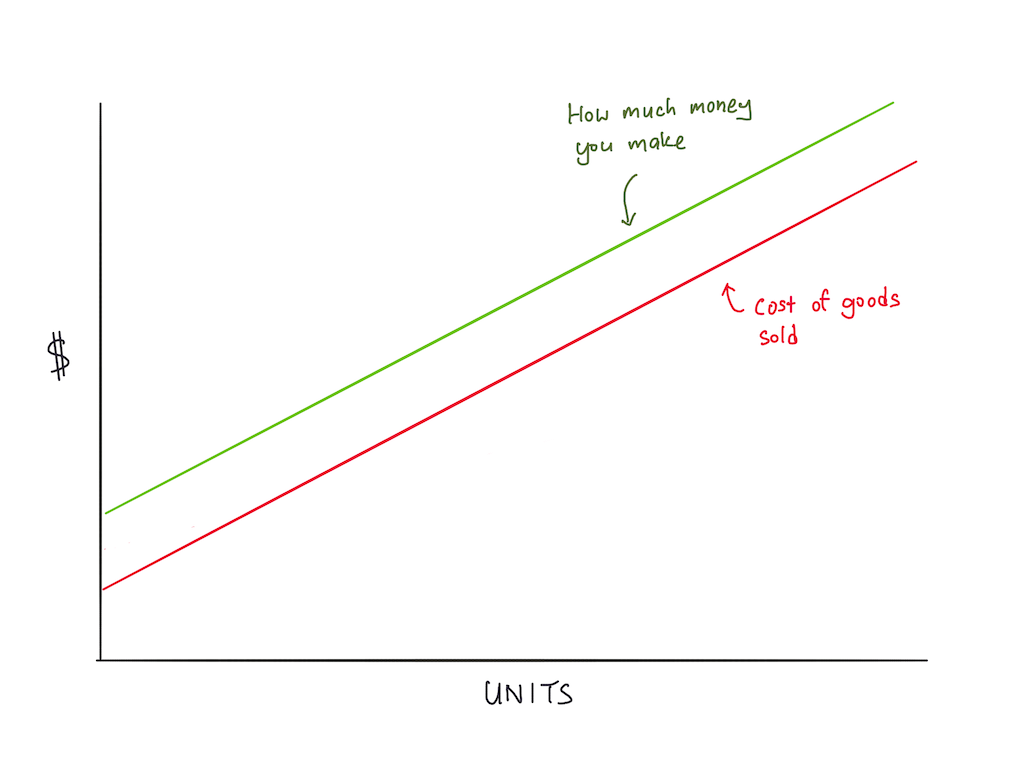
Of course the line between fixed costs and variable costs are very thin. It's a matter of judgment.
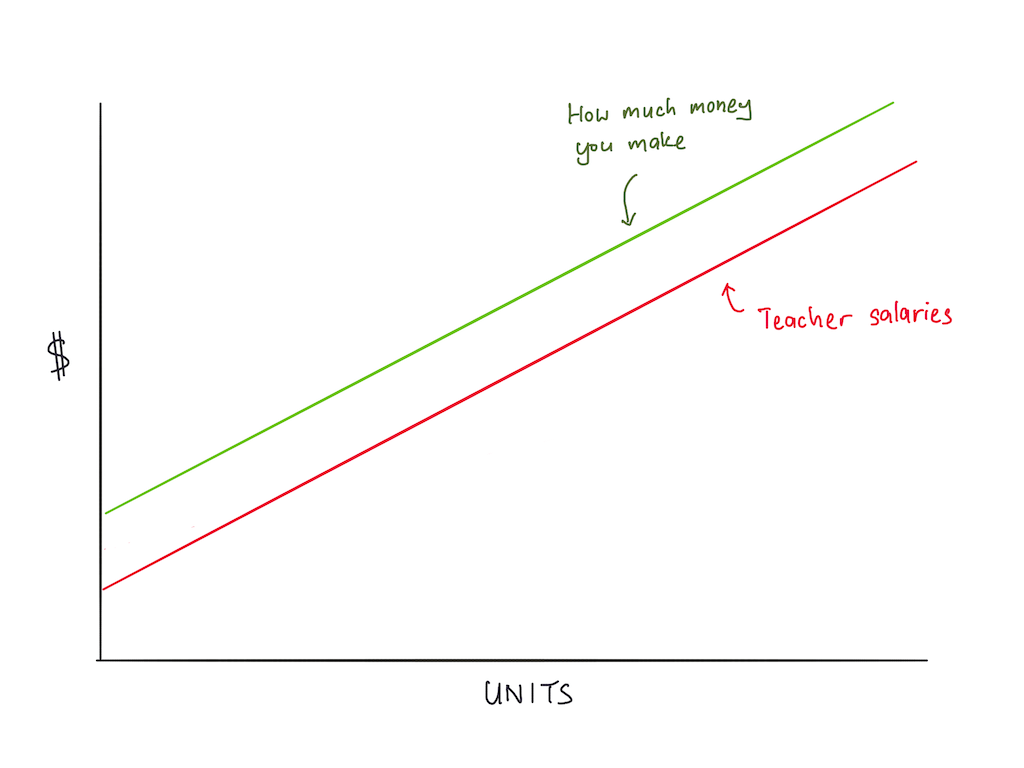
For instance, you might say that salaries are a fixed cost. But what if your business is fundamentally labor intensive? If you run a tuition center, for instance, and you promise one teacher for every 20 students, then you have to hire more teachers the larger you grow. Teacher salaries begin to look a lot like variable costs, don't they?
The reason we split costs into the two categories is because an unprofitable company may be unprofitable because it has high fixed costs (it built a factory), but then once it’s at scale, you find out that it’s actually darned profitable.
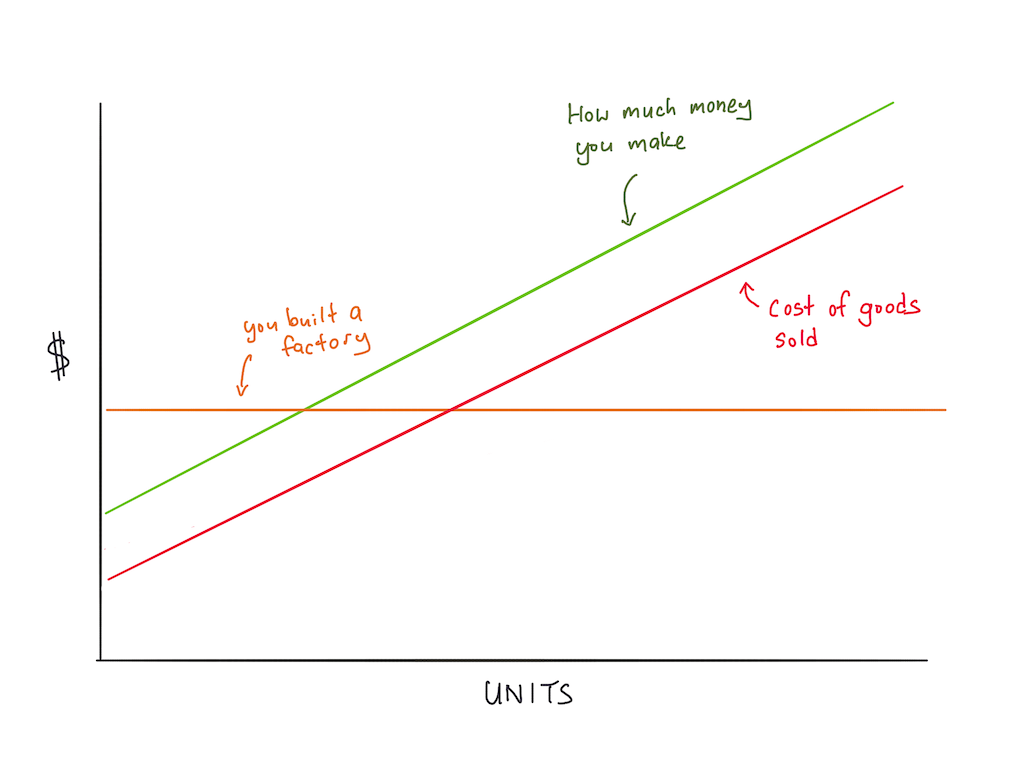
To tie this back to software: most software companies are incredible businesses, because their costs don’t go up linearly compared to their revenue. This is to say that they only have to pay for — let's say — one extra software engineer and 0.2 servers for every 100 new customers they get, or something crazy like that.
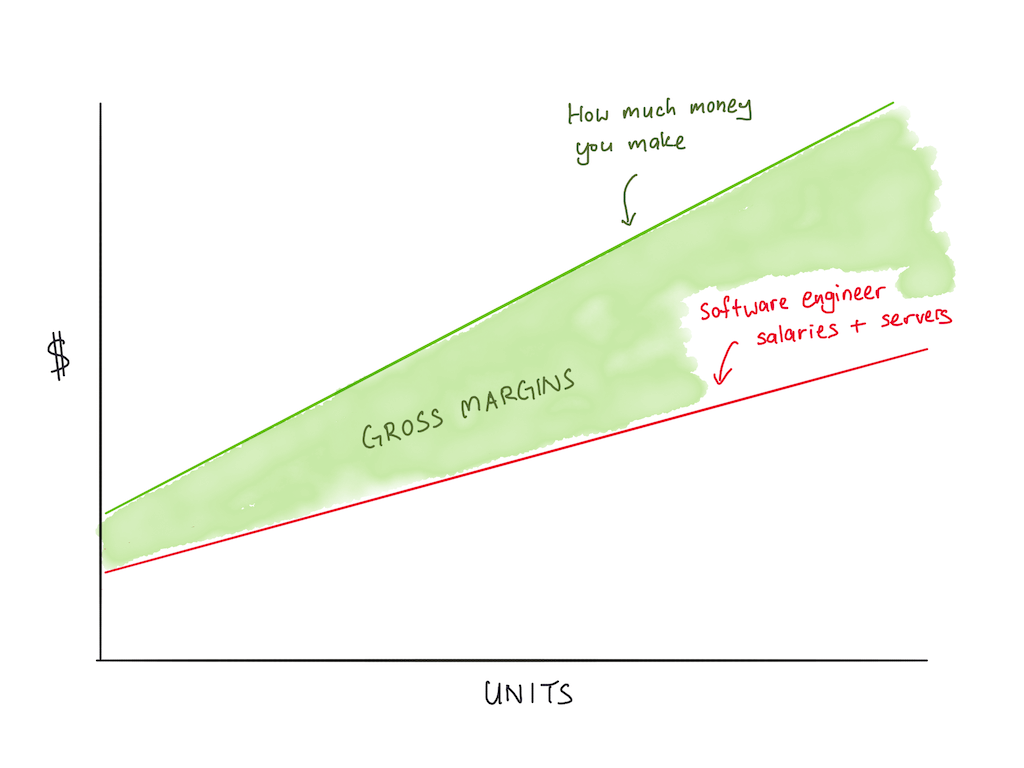
That graph above is the reason why software companies are so incredibly hot today, and why so many investors are willing to shove money down these companies’s throats.
To give you a better understanding of this relationship between fixed and variable costs, consider a notable exception: Spotify. Spotify has to pay royalties on all the music their customers play, so their costs go up the more customers they have.
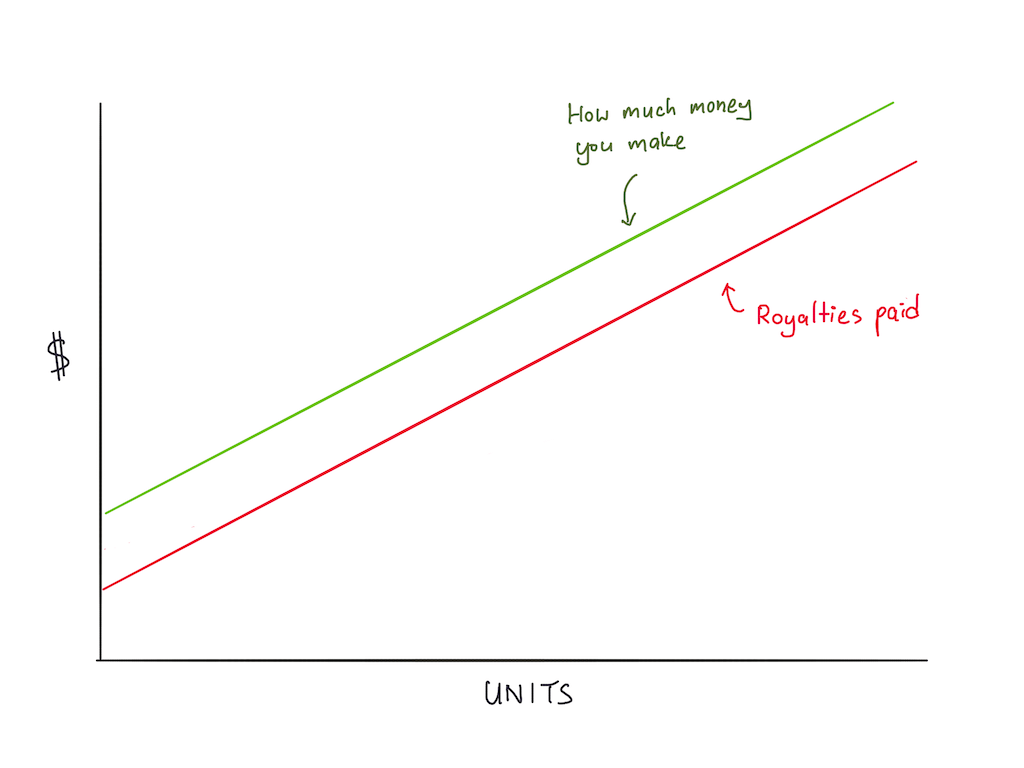
The takeaway here is that not all software companies are created alike. Heck, not all businesses are created alike. Understanding the relationship between revenue, profits, and costs gives you the foundation to understand what business people see when they look at a company in the operations stage.
Now that you have an intuitive grasp of this idea in your head, we shall take a closer look at what this means in a typical SaaS company.
Costs in a Typical SaaS Company
A simple rule of thumb to use when it comes to SaaS is that they enjoy 70-80% gross margins. (Gross margins is defined as a company’s revenue minus its cost of goods sold, a variable cost). If you have high gross margins relative to that benchmark, investors will rejoice. If you have low gross margins relative to that benchmark, investors will throw tear-soaked tissues at your face.
In SaaS, there are three major buckets of costs that make up COGS:
- Sales and marketing — which should be obvious, because S&M costs scale up the more customers you go after. In SaaS companies, this is typically a function of how fast you want to grow and your retention rate.
- R&D (or product) — this is what it costs for the care and feeding of your software product. In SaaS companies, this is typically 15% of costs, and includes things like servers, the cost of developing new features, or the cost of customisations for the customer.
- The variable portion of General & Administrative expenses (G&A) — G&A consists of all the little things you have to pay for, like office rent and electricity for your coffee machine and legal fees for all the lawyers you need to keep around. It is divided into fixed costs (rent) and variable costs (legal fees that are incurred with each sale, for instance, if you are unlucky enough to be in an industry that requires this). In SaaS companies, this is typically 10% of costs.
This is just a rule of thumb, of course. In practice, things get more complicated.
For example, there’s a tendency to count software licenses that your employees use under the fixed portion of G&A. This makes sense: if you’re paying for Figma and the designers in your company need Figma to continue improving the product, then Figma is a fixed cost and should be included under the fixed portion of G&A expenses.
But let’s say you depend on a proprietary piece of software to deliver your offering, and a new license must be purchased for each new customer you serve. (Let’s say, for instance, that you’re paying for a new Firebase account with every customer that you sell into).
In this case, the software licenses you buy seem a lot like cost of goods sold (COGS). So you must add that to your gross margin calculation, and your business looks less attractive to investors.
Understanding this business factoid may make some actions by your business people seem more understandable.
For instance, if a businessperson comes to you and asks for some data on the cloud services you are paying for per customer served — you can bet that he or she is doing a gross margin calculation.
Similarly, when Netflix’s data team is asked to keep track of their data infrastructure costs, you can be sure that the motivation behind it is to reduce the R&D component of Netflix’s variable costs.
The core motivation is the same: sophisticated businesspeople at the operations stage are trying to reduce the business’s variable costs, which increases gross margins, which increases the profitability of the overall business.
What This Means For You as a Data Person
There are two ways the information in this essay might be useful to you.
The first is that — if you are asked for usage metrics or cost metrics related to any of the three buckets above, you know that some businessperson, somewhere in the company, is concerned about gross margins. They are thinking about the relationship between revenue, profits, and costs, and are reaching out to you to get some concrete numbers for their analysis.
The second way this might affect you is that you may be seen as a cost. In many non-software companies, the business intelligence department is seen as a cost center. In software companies, we are luckier: the data team is more likely to be lumped as part of R&D costs.
The important idea to understand is that at the scale stage, the suits upstairs are likely to have an eye trained on the company’s costs at all times. Understanding this helps you because you now grok what’s going through their heads when they ask you for certain numbers; it helps you because you are better able to keep a finger on the pulse of the overall company, and know what the changing financials means for your job.