Measurement Before Product Market Fit
A startup's first job is to create a customer. We take a closer look at how that affects the metrics you measure at the product stage of a startup's lifecycle.
This is part of a series on business fundamentals for data professionals.
Last week we talked about the three stages of company growth, and the types of metrics that go with each of those stages.
This week, we’ll take a closer look at the metrics you’ll most commonly find in the first stage of business: the product stage.
The Customer First
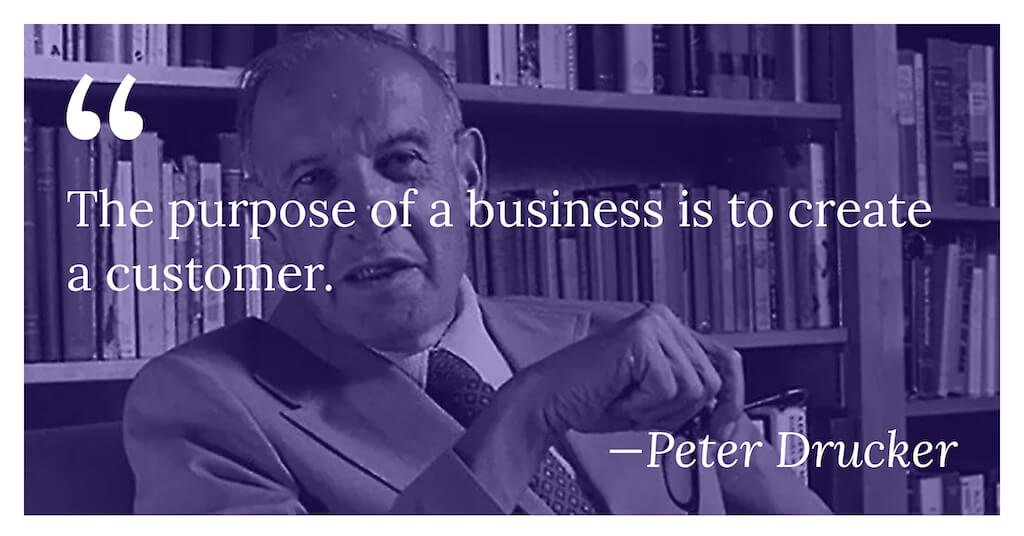
There’s an old Peter Drucker saying that goes “the purpose of a business is to create a customer.” This is true: without a customer paying you, you have no business. So in the product stage, your job is simply to provide a service or offer a product that a customer will pay for. This goal becomes your North Star.
Naturally, your measurements at this stage would be centered around whether you’ve created a customer. This question usually reduces down to ‘Are you delivering value to the customer? How can you tell?’
This question supersedes all else.
It also implies certain interesting things.
For starters, because all companies start out with a small customer base, it implies that you’ll have to mine for insight through qualitative means more than quantitative ones.
It means talking to customers more than watching metrics.
It means ‘judging’, not measuring.
And, finally, it means using data to augment observations, instead of using data as the source of your observations.
Early stage startup investing tends to reflect this bias towards qualitative judgments. Take early-stage investor Charlie Songhurst, for instance. Songhurst is a particularly prolific investor, and is known for evaluating startups on the broadest possible qualitative measures:
- Does the startup make people happier?
- If it does, how much happier compared to the next best alternative?
- And finally, what % of that extra happiness may be extracted as revenue?

Sonhurst’s focus on ‘soft’ measures of value reflects the reality of early-stage companies. (He’s invested in nearly 500 of them).
If you are a startup operator, this focus shows up in all sorts of subtle ways in your work. Let’s take a look at a few examples, before circling back to summarise the purpose of measurements at this stage of the company life.
Activation
The first product-related measurement that most people think about is that of ‘activation’: that is, how many people visit your site, and of those, how many of them ‘activate’ — i.e. become active users of your product.
When we talk about activation today, most of us would reach for a funnel visualization. This visualization is simple to understand: you have a certain number of people at the top of the funnel, you have multiple steps before you count a customer as an active user, and then you display the drop off as percentages at each stage.
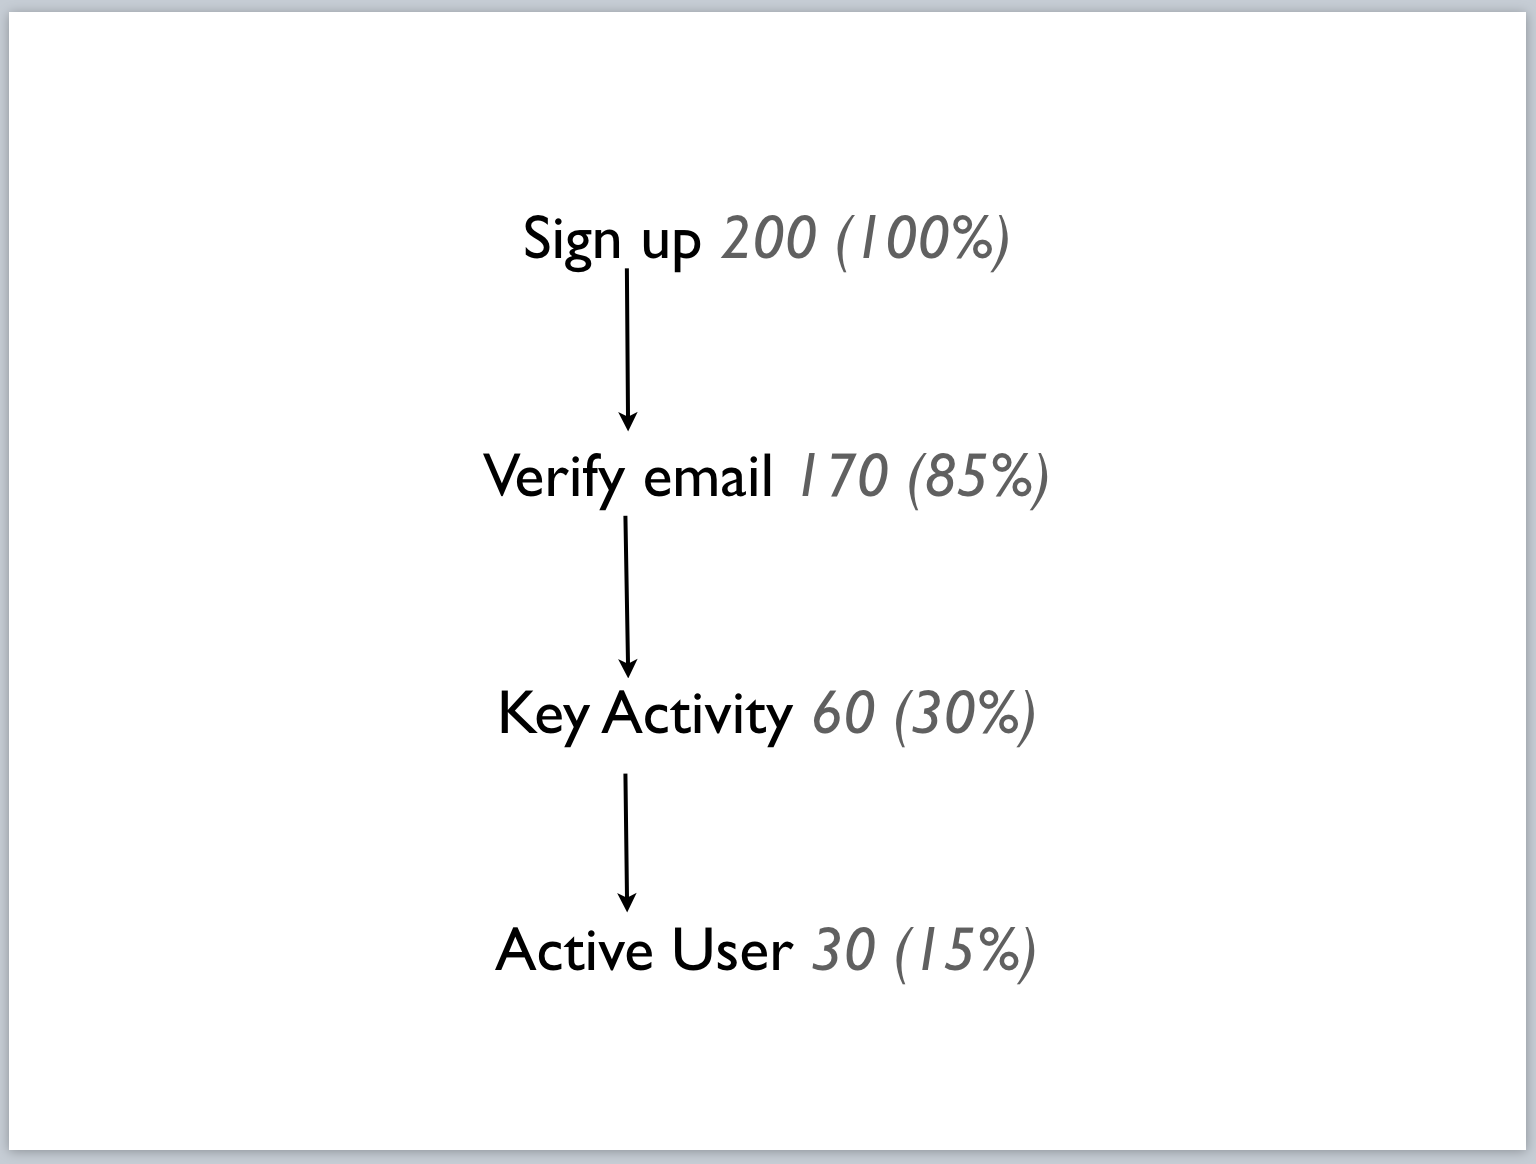
But this is the quantitative portion of the metric. In most startups, the drop-offs will be pretty severe at the early stages of your company, because your product will probably be too immature for your users. What you’ll want to get at is why users are dropping off at various stages of your funnel, and then fix those problems instead.
To do this, you’ll need to run qualitative interviews. The best way I know to accomplish this is to generate multiple hypotheses for the drop-offs at each stage:
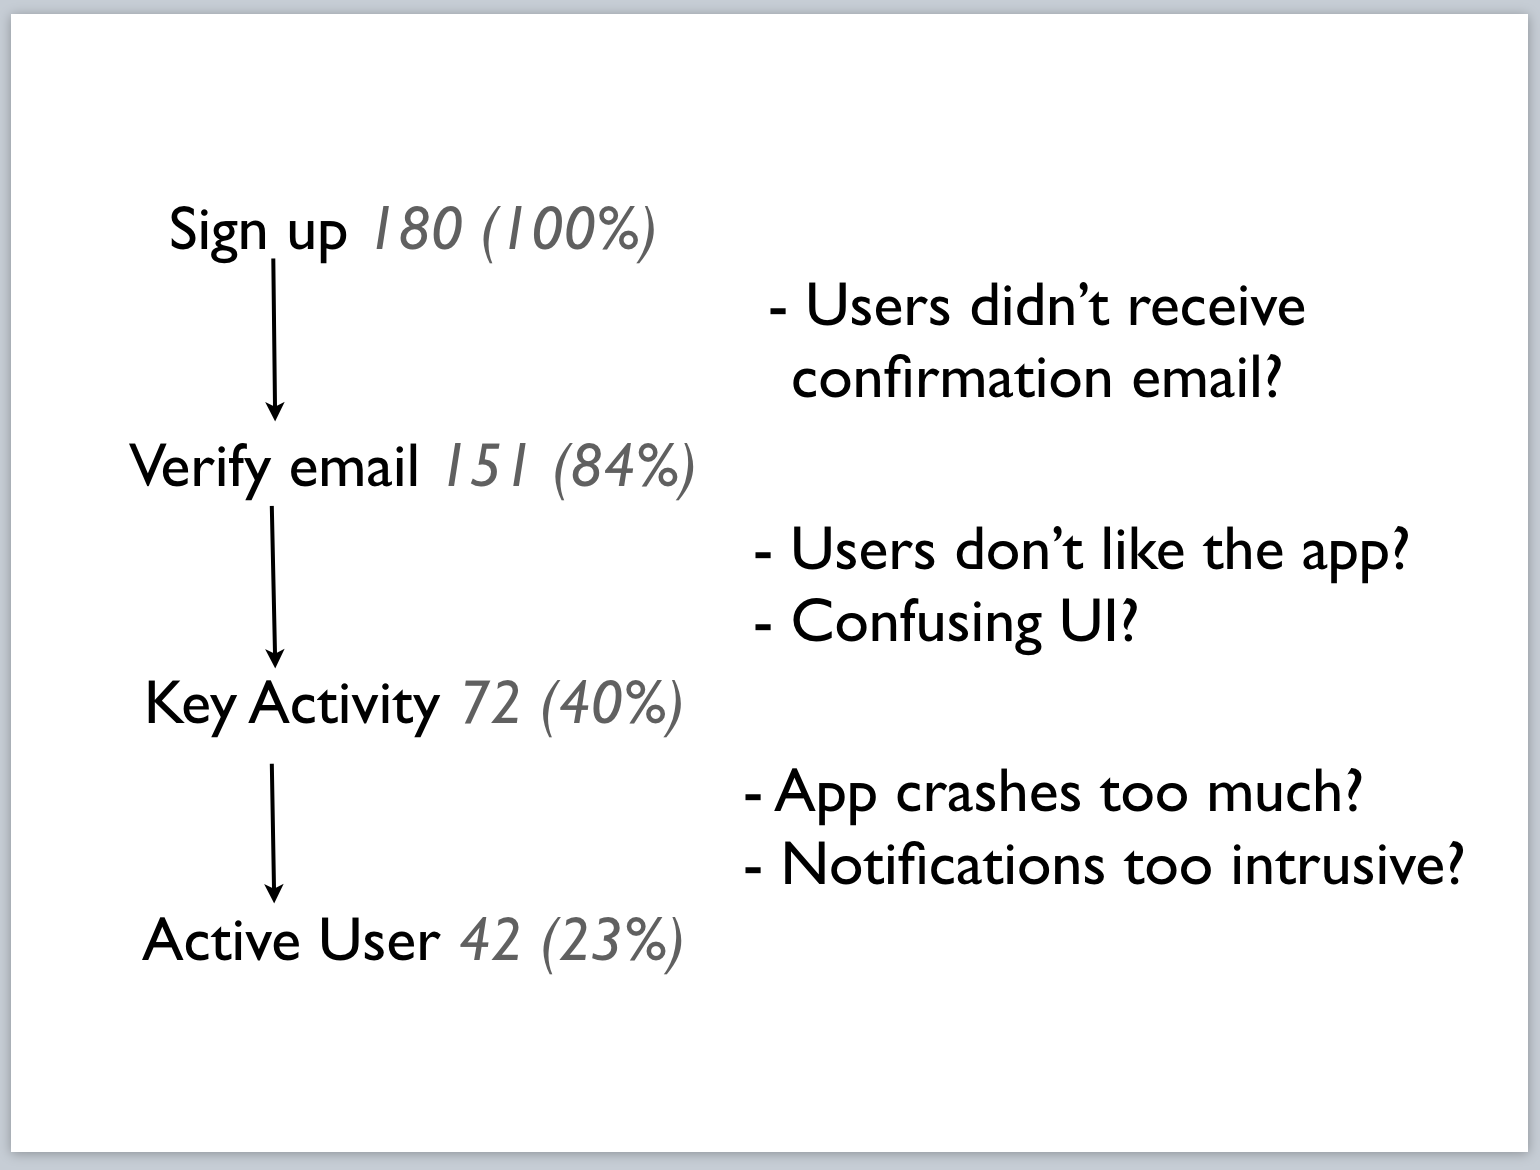
Then, verify these hypotheses by reaching out to a handful of users who have dropped off, and ask carefully calibrated questions about why they’ve stopped using the product.
Retention
Retention is how you know your users continue to derive value from your product.
This is normally visualized using a retention table.
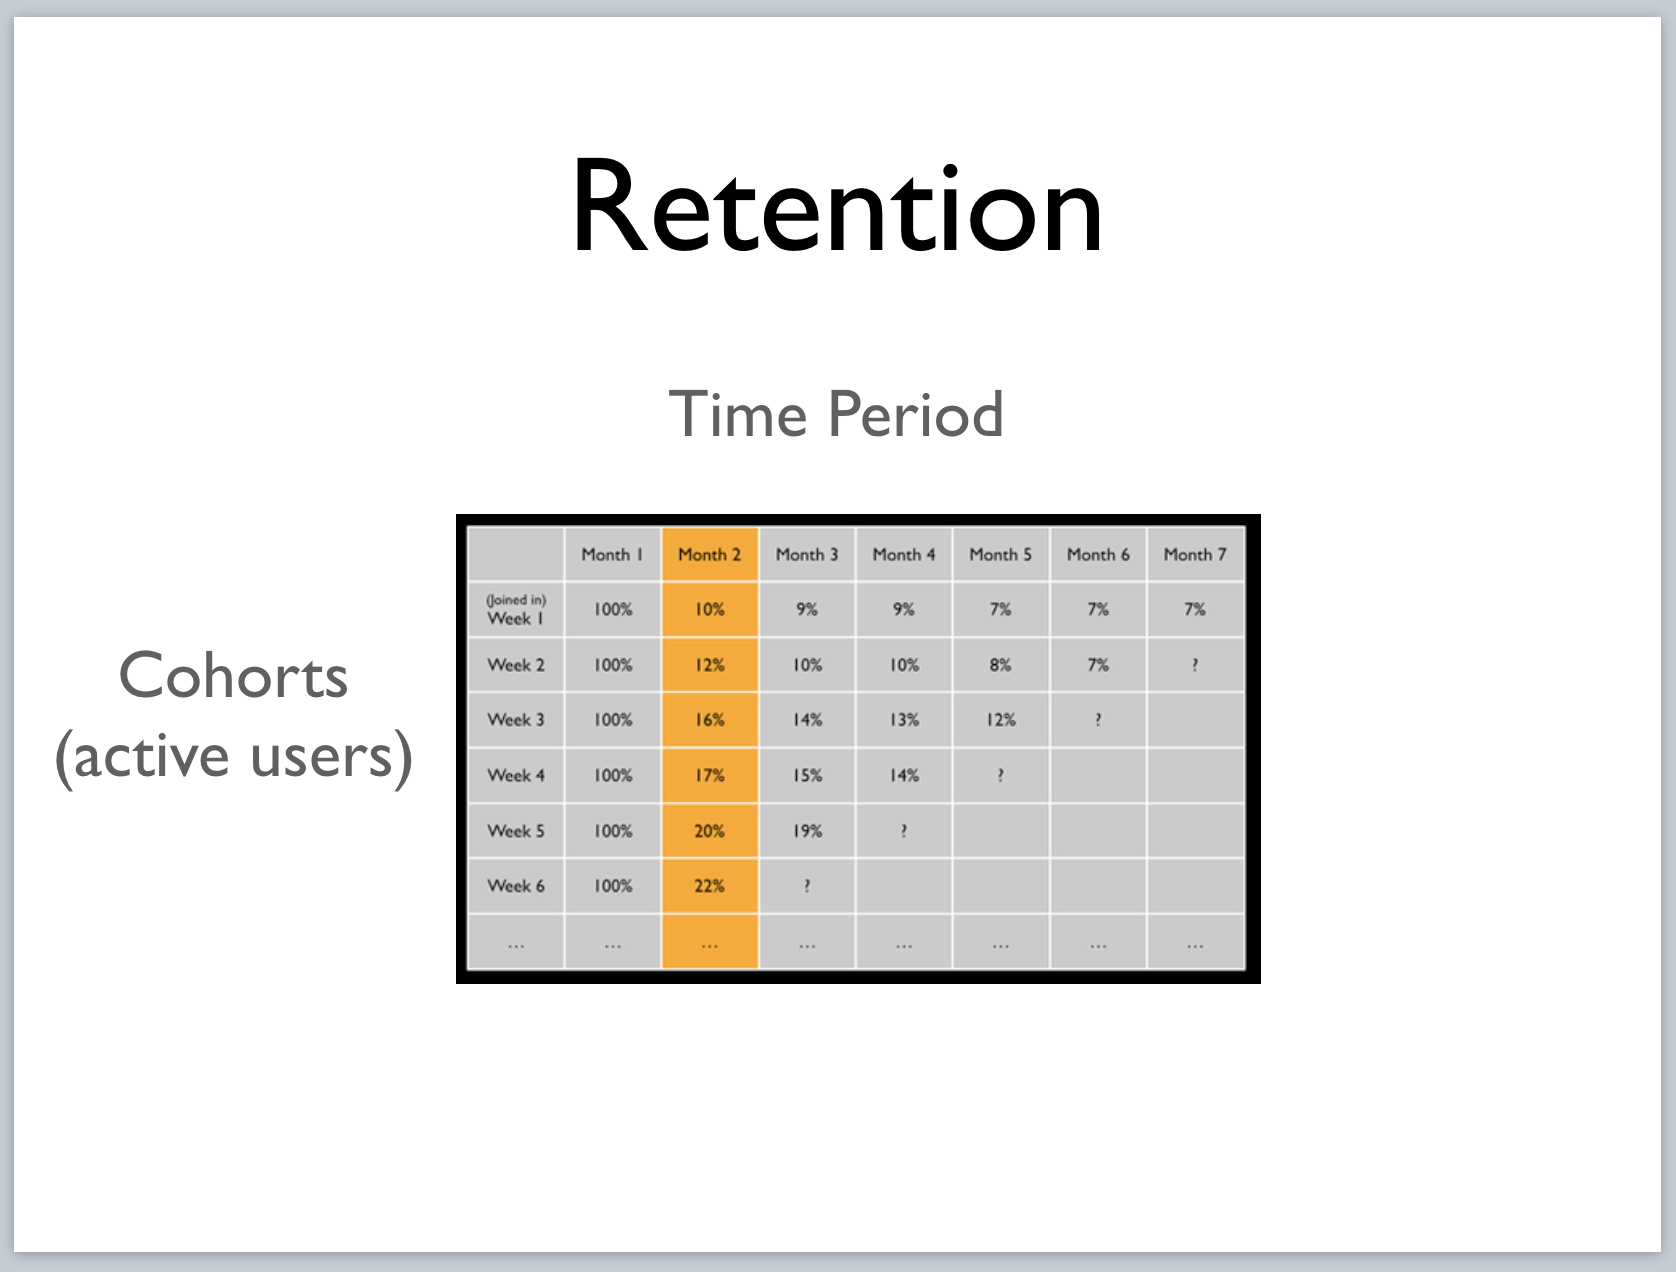
In the above example, the rows represent each week that users had joined, and the columns represent the % of users who are still actively using the product for each month after the initial signup week. This is more commonly known as a ‘cohort retention table’, because it splits users into cohorts of a week long.
A retention table is — again — basic stakes when it comes to product measurement. Where it becomes wonderfully useful is when you begin to use it to contact users who have churned out from your product, in order to figure out why they’ve stopped using you.
Like activation, you should refrain from using leading questions when talking to these churned users. But unlike activation, you can’t usually fix the problems that cause churn — at least, not immediately. Churn tends to depend on the overall maturity of your product; it is a leading indicator of product-market fit.
Customer Satisfaction
Are there other approaches to measuring how well you’ve created a customer? Yes, there are.
Business professor David Maister points out that for professional services firms, it is important to measure customer satisfaction separately from quality of service. In his classic book, Managing the Professional Services Firm, he uses the pithy phrase ‘quality work doesn’t mean quality service’, and writes:
Consider the following scenario: You have had your car repaired at a new local garage. A week or two later, your neighbor, curious about whether she should also use this new garage, asks, “Did they fix the car?” “I think so,” you reply. “It seems to be running smoothly, so I guess they did a good job.” Then your neighbor asks an interesting second question: “Did you get good service?” What does this second question mean? Surely, fixing the car is the service, isn’t it? Well, yes and no. Fixing the car is part of it, and an important part it is, but by itself it doesn’t constitute good service.
What is the neighbor asking? He’s asking if the garage treated you with the right mix of respect and friendliness, if they asked smart questions, and if they went out of their way to contact you if complications arose. In simple terms, the quality of the work done by the professional services firm is only part of a total package that determines if they have successfully created a new customer.
As a result, Maister recommends that services firms measure the quality of service they’ve provided after each engagement, and use this measurement as input for firm-wide improvements. In fact, he goes so far as to recommend mandatory mailed questionnaires, sent at the end of every client project.
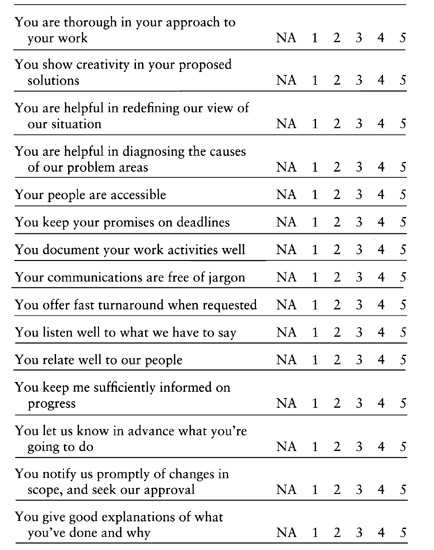
Notice how the practice of soliciting feedback enables you to capture what most people would say is a purely qualitative experience. After all, ‘quality of service’ is a perception, not an objective fact. The goal of acquiring feedback is to measure how well the firm is doing when it comes to creating a new repeat customer.
Wrapping Up
Many of you who are reading this aren’t in the professional services business; you are likely a data professional in a product context. But the reason I’m bringing Maister up in this post is to remind you that the purpose of every metric at the earliest stages of a company’s life is to measure how successfully you have created a customer.
The exact forms these measurements take will differ based on the industry you’re in. It will differ based on whether there is a service component of your business, or whether you’re selling products. It will differ based on your sales model, as well as your marketing strategy. But the end goal is always the same: you’re only in business if you have a customer.
The things you measure at this stage is how you find out.
This is part of a series of posts that explain business fundamentals to the data professional. For more updates, subscribe to our newsletter below:
What's happening in the BI world?
Join 30k+ people to get insights from BI practitioners around the globe. In your inbox. Every week. Learn more
No spam, ever. We respect your email privacy. Unsubscribe anytime.

