A Quick Way To Get On Top Of Your Company’s Data: Create a Spreadsheet-Based Data Dictionary!
A data dictionary is a document that assists you in navigating your team's mountain of data. We show you how to create a spreadsheet-based data dictionary with Excel and dbdiagram.io.

If you’ve been on a data team for any amount of time, you’ve probably felt overwhelmed by the sheer amount of data sources you have to keep track of. This is the sprawl of reports, tables, data sources and pipelines that lead you to ask questions like:
- Where do I find revenue numbers? As in: which database, and which tables in that database?
- I spent the weekend in Tahiti and came back to 15 new tables in our data warehouse! Who put them there, and what are they for?
- What’s the Google Analytics property ID for our new website again?
- There’s an error with the latest sales report in Tableau. Joe from Sales is on my ass about this! Which table is that report generated from?
And so on so forth.
Most data teams we know grit their teeth and try and keep it all in their heads.
Now, there are a couple of ways you can deal with this problem. Most data teams we know grit their teeth and try and keep it all in their heads. This isn’t an entirely crazy idea — over time, you will learn what tables live in which databases in your organisation. And if you don’t, it’s likely that you can ask around until you find someone, somewhere, who knows exactly where you might find the data for that new report Joe from sales wants tomorrow.
(And of course you could always take the nuclear option — you could just ask your data engineer for a new pipeline and a new table, just to get that report in Joe’s hands. Who cares about the table sprawl! Everyone’s doing it anyway!)
The good news is that this isn’t an unknown problem. Data catalog solutions exist — you could, in theory, get corporate to splurge on a data catalog layer you can integrate with your data warehouse. See Microsoft Azure’s Data Catalog, for instance, which purports to let you ‘spend less time looking for data, and more time getting value from it’. Or Waterline Data’s AI-driven data catalog solution.
But let’s say that you want to move fast and fix things. Let’s say that you don’t want to go through your company’s procurement process. What can you do?
The Excel Solution
A fantastic stopgap solution we’ve seen many data analysts and team leads rely on is to create a ‘data dictionary’ in a shared spreadsheet.
This spreadsheet simply contains every piece of information you’ll need when working with your BI infrastructure. It contains a list of every table of note in your data warehouse and data lake, annotations to explain what the dimensions are and what they’re good for, information on your third party tools and upstream data sources, and more. Once created, you may then refer to this Excel sheet whenever you’re working to service your business users.
If you’re onboarding a new hire, data analysts we speak to tell us that their Excel-based data dictionary becomes a life-saver.
If you’re onboarding a new hire, data analysts we speak to tell us that their Excel-based data dictionary becomes a life-saver. They simply give new analysts a copy of their spreadsheet, and tell them “everything you need to know to create new reports lives in there.” This sure beats having a senior analyst on hand to explain where the data lives.
The spreadsheet also becomes handy when working with business users. One data analyst we’ve talked to tells us that he opens his team’s data dictionary (in Google Sheets) whenever he’s sitting down for a requirements meeting. “It’s easy to check our existing dimensions to see what’s possible when they’re asking for a report.” he says.
As far as such techniques go, this Excel hack is a fantastically pragmatic solution. It is simple to execute, instantly usable in any data team, and delivers value from day one. The only problem with it is the difficulty of keeping the Excel spreadsheet updated as time passes — but that’s something that can be baked into your team’s processes.
Today, we’ll discuss how to put this into practice in your own business intelligence team.
How To Create a Spreadsheet-Based Data Catalog
To start, you’ll need three things:
- Spreadsheet software (we prefer Google Sheets).
- SQL dump files that are generated from your data warehouse or data lake.
- A web browser opened to dbdiagram.io.
You’ll also need access to all your data properties. Don’t fret if it takes a few days to get everything into your dictionary, though. The analysts we’ve spoken to say that it takes a bit of time to create this initial spreadsheet, though the investment is well worth it.
We’ve prepared an Excel template for your benefit, which you may download here:
A quick note: it’s clear that your data dictionary should be adapted to your particular company. The templates and guidelines we provide below will be general enough to get started, though you must create your dictionary from actual use cases and from first principles.
Alright, let’s get started!
Step 1: Visualise your databases
Creating a data dictionary is a lot easier if you can visualise the tables you’re dealing with. The alternative is to stare at SQL table definitions, which isn’t nearly as fun.
In this tutorial we’re using dbdiagram.io, which happens to be a free tool we created to help with our own internal database visualisation tasks. To use it, first generate an SQL dump that describes the structure of your database, and then upload that file into dbdiagram.io:
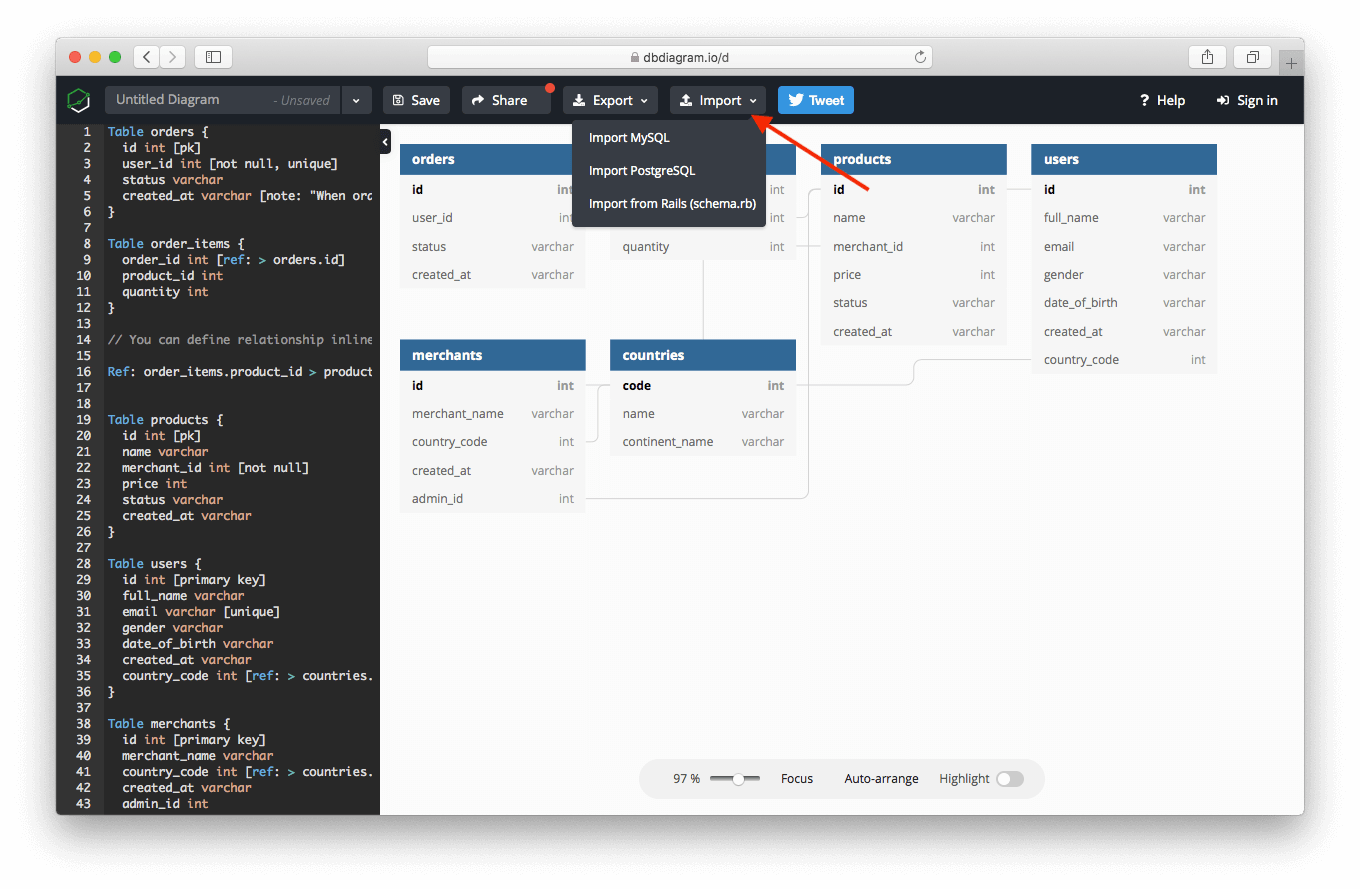
This would create a visualisation of your tables and the relationships between them.
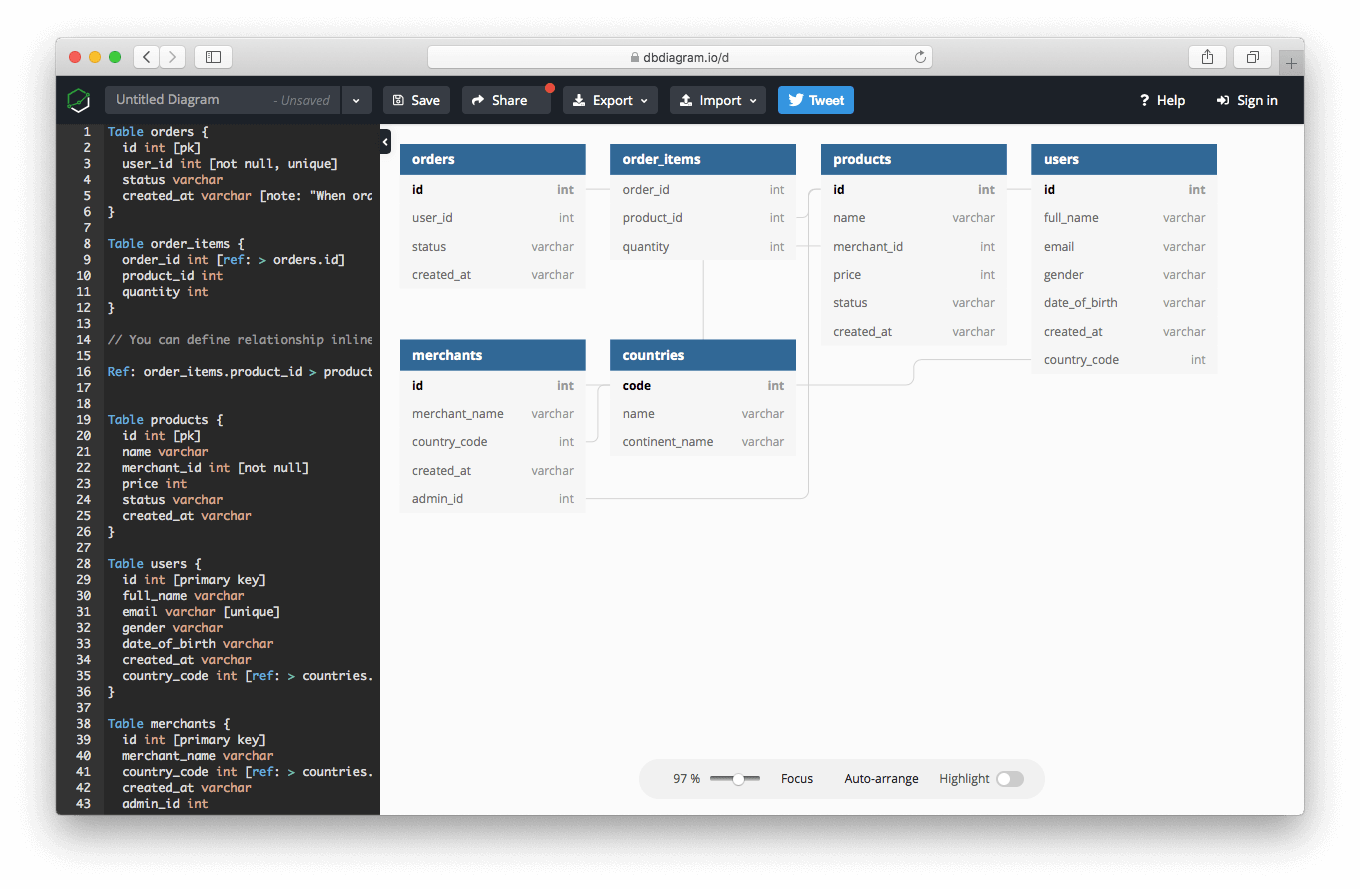
You’ll probably want to save this visualisation as a PDF for future reference. With this ERD diagram at hand, we can get to work.
Step 2: Fill In Details About Your Dimensions and Fact Tables
Your data team most likely works with a handful of dimension and fact tables stored in some data warehouse. This is our first stop, since the star schema is often at the heart of BI work.
Compile a list of your organisations’s data warehouses. Sit down with a cup of coffee and a suitable playlist, and then begin filling up the first two sheets in our Excel template, labelled WH_Dimensions and WH_Facts.
 We start with dimensions and facts in your data warehouse.
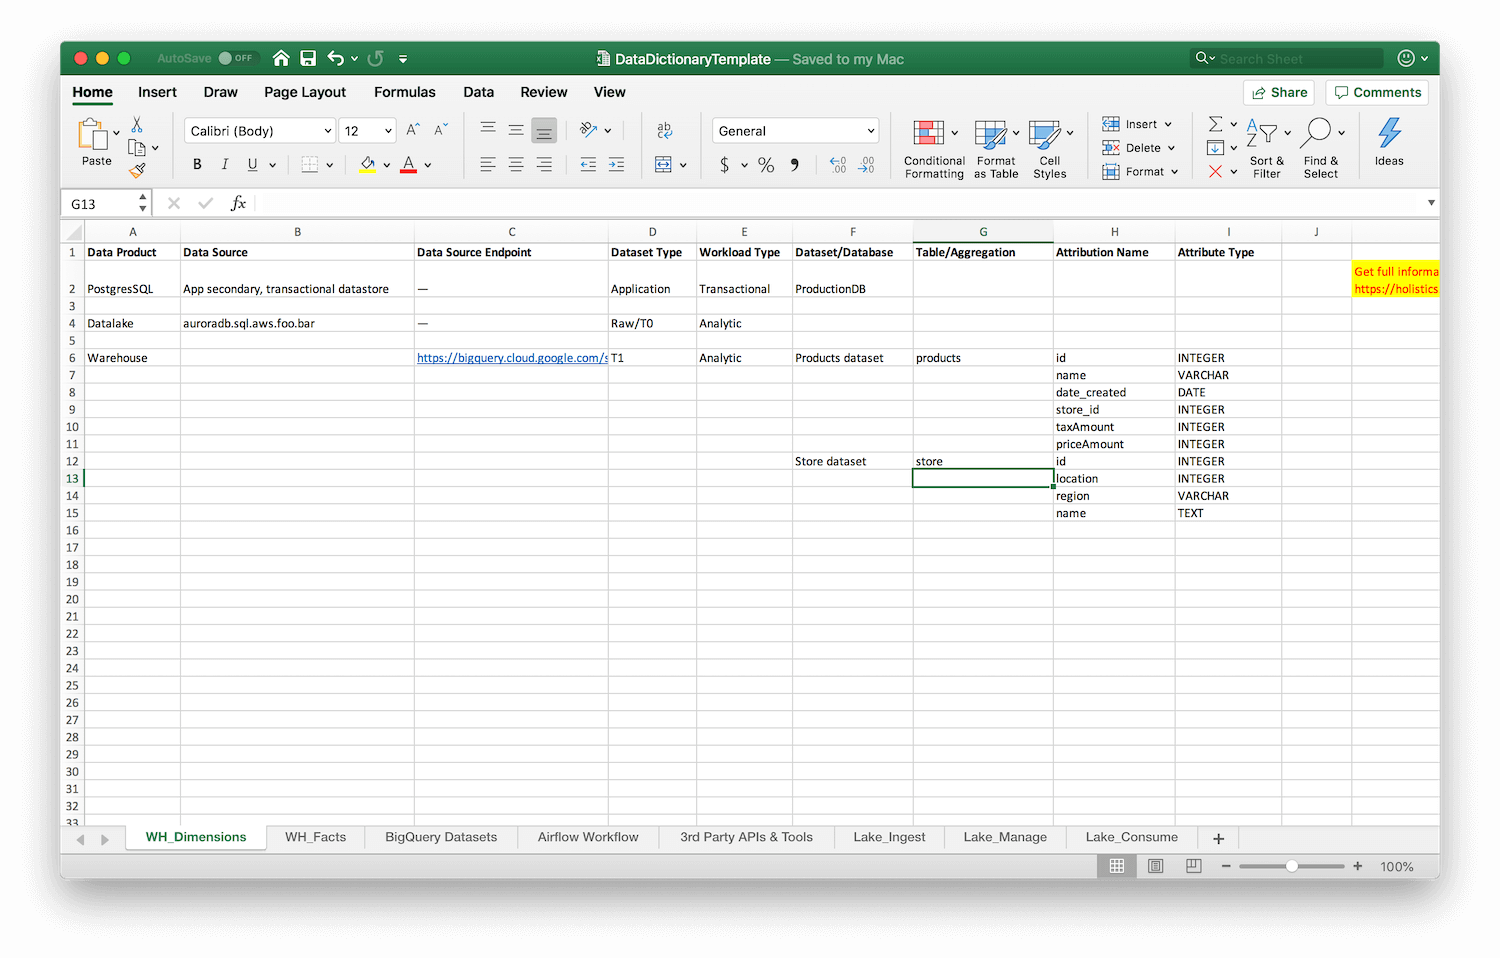
You’re going to be filling in the following information for each table:
- Data Product — What data product does this table belong to? Is it part of your data lake? Or your data warehouse?
- Data Source — The name of this particular data store, which helps you understand where it lives, for instance “auroradb.sql.aws.foo.bar”
- Data Source Endpoint — The actual URL of the data source in question, if it exists.
- Dataset Type — How many transformations has this data gone through? This should be ‘application’ for transactional data, ‘T0’ for raw analytic data, extracted directly from some source, ‘T1’ for data that has been aggregated or transformed once, ‘T2’ for data that has been derived from another transformation (or has been transformed twice), and so on.
- Workload Type — Is this a transactional or analytic dataset?
- Dataset/Database — What is this dataset about? For instance, “products dataset” if you’re describing a product dimensions table.
- Table/Aggregation — The actual name of the table in question, e.g.
products - Attribute Name — A list of attribute names, like
id,name,sellingPriceand so on. - Attribute Type — This is the data type of each attribute listed above. Having the attribute name isn’t enough if you’re in a meeting and you want to quickly see what data is available to you. Having the types gives you more contextual information; for instance if
locationis stored as a JSON blob, that’s something you want to know without pulling up the database in question.
I can see you looking at the spreadsheet already and shuddering at the work. Again: yes, I know, this is going to be tedious. But remember that this is a one time task. Keeping this sheet updated will be significantly easier going forward, especially if you mandate it as part of your data team’s process.
(Bonus points! Delegate the task of initially filling this data dictionary to a new member of your team … thus killing two birds with one stone: you have an actionable data dictionary, and you’d have successfully onboarded a new hire!)
Step 3: Fill In Details About Other Data Sources
It’s not enough to know about the dimension and fact tables in your data warehouse. Your next step is to document datasets your team might have stored in other ‘transient’ locations (for instance, in BigQuery), as well as the pipelines that you use to transport data between those locations.
For each of those data sources, generate ERD diagrams using dbdiagram.io, and use that as a reference when filling in additional sheets.
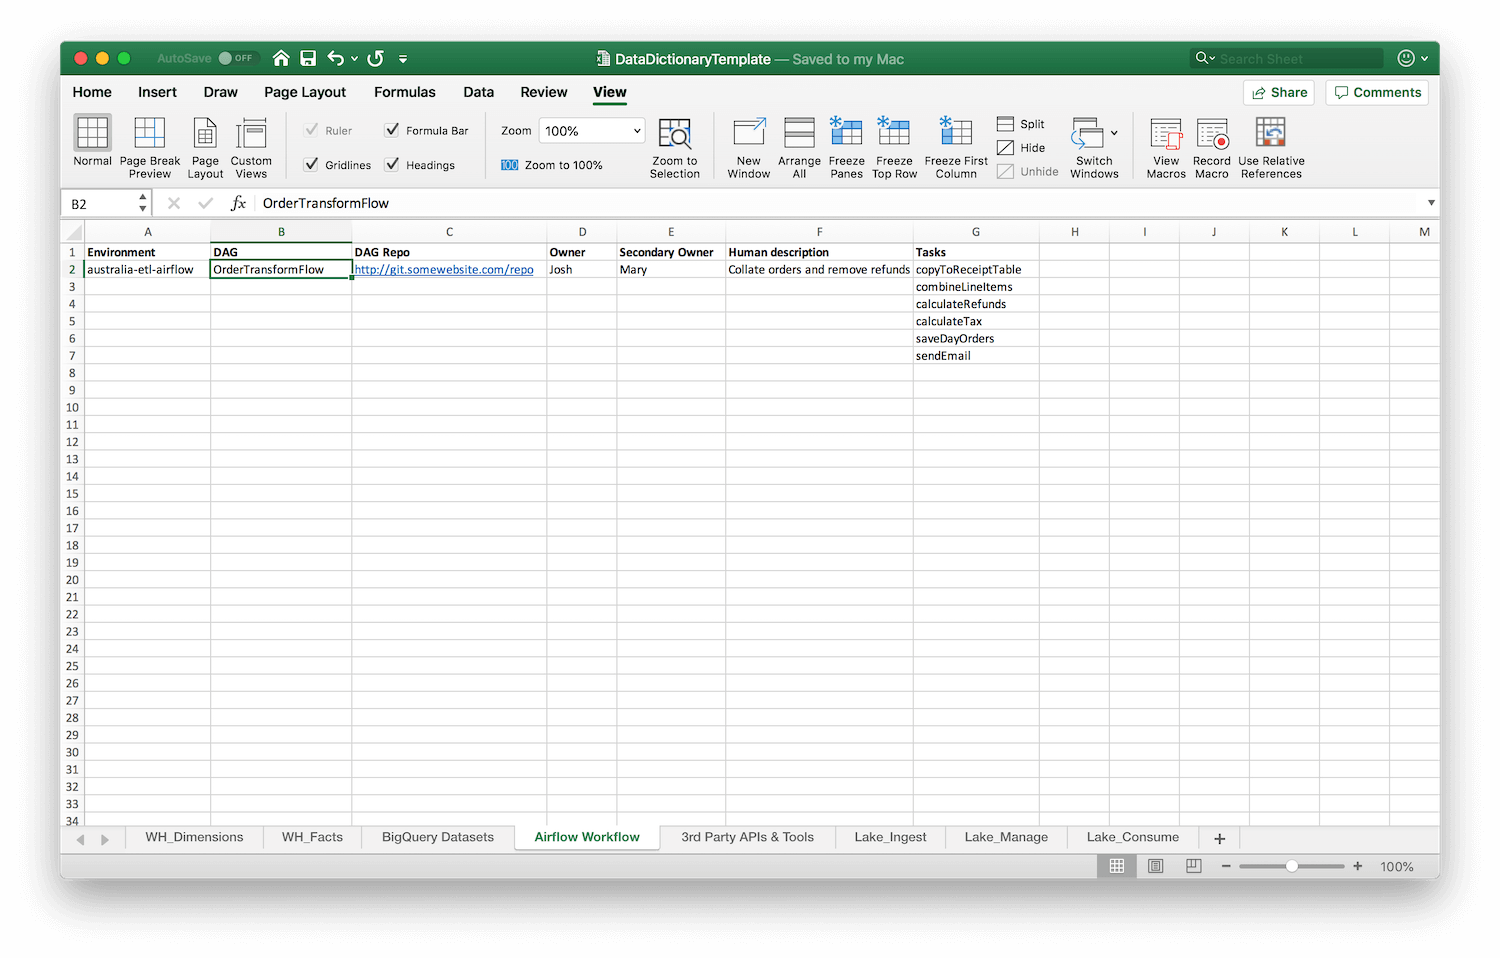
In our Excel template, we include an example sheet containing information on Apache Airflow workflows. This captures:
- The environment for a particular set of DAGs.
- The name of each DAG.
- The repo location where that DAG is stored.
- The primary and secondary owners of that particular workflow in your data team (so you know who to ask if it goes down).
- A human description about the workflow, for quick skimming.
- And a list of tasks that make up the DAG, so you can quickly eyeball the tasks and understand what goes where.
And this is what that looks like in practice:
 It should be trivial to adapt this to other pipelines — including custom ones in your company!
Step 4: 3rd Party APIs, Tools, and Your Data Lake
This final step requires you to capture information about 3rd party APIs that you depend on, as well as the owners and credential holders for those APIs. This can be particularly helpful if, say, your access to Google Analytics or your sales CRM is controlled by a person in another part of the organisation. Having that person listed alongside details about each integration makes it easier for your data team to reach out through internal channels if something goes wrong.
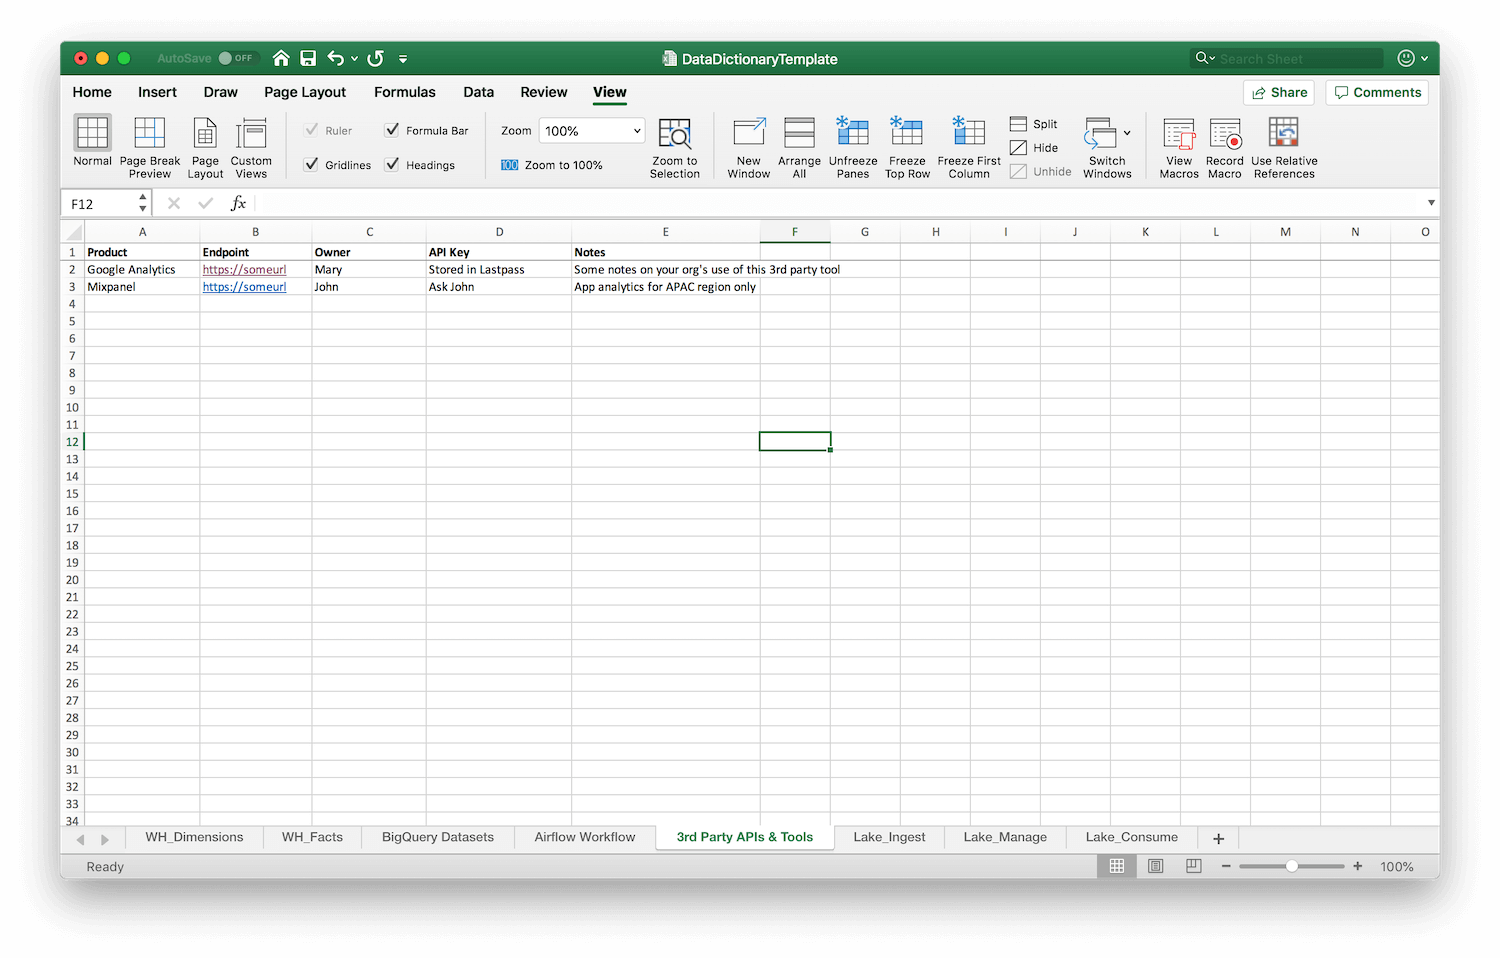 Document your 3rd-party APIs!
Finally, you should add information about tools and information about your data lake, however your company has chosen to set those up. I can’t give specific details in this section, as the way your company sets up its tools and its lake might be radically different.
It pays, however to keep the following questions in mind:
- The Efficiency Question — If you’re sitting with a business user and she asks for a new report, would you have enough context from your data dictionary to know that you can generate that report with existing data sources?
- The Onboarding Question — If a new data analyst comes in, is browsing the data dictionary enough to get them to at least 80% of the necessary knowledge to start being productive?
- The Knowledge Retention Question — In six months, if you need to find the answer to a business question, would you have everything you need inside your data dictionary to know where to look? Or would you have to dive into your databases to figure that out?
These questions are really the crux of this piece. While we have given you a template to create your own data dictionary, ultimately, the format of your dictionary should be adapted to your specific organisation and modified for the types of tasks that you have to do. These questions guide you to do just that.
They also serve one other purpose. Manually creating and maintaining a data dictionary is a costly endeavour. To justify this effort, you should use these questions to evaluate the return on your time investment.
When you manage a team of seven analysts, the benefits are multiplied across the work of seven people.
One way I like to think about this effort/benefit tradeoff is that if you can answer the above three questions at least 80% of the time, the effort would have been well-worth it. This benefit is multiplicative — when you manage a team of seven analysts, the benefits are multiplied across the work of seven people.
Creating a data dictionary, then, is an incredibly high-leverage activity. The number of hours you invest in creating and maintaining it should eventually reap dividends for your entire team over a long period of time.
Summary
Creating a data dictionary is a remarkably useful technique to boost data team efficiency, especially when you need results quickly and can’t afford to buy data catalog tools.
Creating this dictionary consists of four steps:
- Use dbdiagram.io to visualise your databases.
- With the ERD diagrams as a guide, start filling out your spreadsheet. Begin with the dimensions and facts table in your data warehouse.
- Move on to document external databases and pipelines.
- Finally, map out 3rd party APIs, unstructured data lakes, and tools.
I know some of you might scoff at this approach. “Excel?!” I hear you cry, “What a waste of time!”
The truth is that not everyone can afford to install and use a data catalog tool. At Holistics, we have a rather pragmatic mindset when it comes to achieving business intelligence objectives: we think you should do whatever it is that works!
Enterprise software often moves slowly. If creating a spreadsheet-based data dictionary helps your team work better, then — as far as we’re concerned — more power to you.
(If you'd like more opinions, tutorials, ideas, and analysis of modern business intelligence, do subscribe to our weekly newsletter below!)

Staff writer at Holistics. Enjoys Python, coffee, green tea, and cats. I'd love to talk to you about the future of business intelligence!