Holistics Crash Course: Applying Holistics for Business Users
With the intuitive design, Holistics is not only a powerful tool for Analysts but also a lean and easy-to-use data self-serve portal for less technical users. Accessing data becomes as easy as using a phone app. No training required!

The speed of getting answers from data is critical for businesses, especially for fast growing companies. Relying heavily on a few technically skilled staff to retrieve answers causes inefficiencies in business operations.
With its intuitive design, Holistics is not only a powerful tool for Analysts but also a lean and easy-to-use data self-serve portal for less technical users. Accessing data becomes as easy as using a phone app. No training required!
Key takeaways from the webinar:
- Extracting the data you need for your job, without asking the technical team [9:22]
- Data exploration to find answers with smart pivots, charts and conditional formatting [11:42]
- Self-serve data imports from Google Spreadsheets / Google Folders to your database. [15:50]
- Automated schedules for sharing and exporing reports. [18:09]
You can watch our full webinar video, or continue reading the recap here.
Extracting the data you need for your job, without troubling your technical team
Holistics Data Exploration enables users to explore the data that's shared to them.
As a business user, just make sure your company admin has granted you permissions to access the database you want inside Holistisc, and you can start exploring by selecting the “Analyze” tab on the top menu.
From there, click on the database that you want to explore to see all its tables. Pick the table you want to work with and click the "Analyze" button that appears next to it when hovering your mouse over the table. You will see a select query (a line of SQL code) that is generated and run, which will give you the option to extract the data once complete.
Data Exploration to find answers with smart pivots, charts and conditional formatting

In the Data Exploration view, you can easily visualize the data anyway you want. There are 14 type of charts for you to present your data, and each has custom options for you to style and format your data.
- Pivot your data with advanced options for aggregating like
Sum,Count,Percentageand more. - Color your charts, or rescale the axes.
- Format the data type of each column. For example,
date_timedata types can be formatted to show onlyMonthorDay. - Use conditional formatting, which can help you highlight the data that meets the criteria, or use color scaling.
- Build advanced data filters, to only show data that meet your requirements. For example, you can choose to only show the data generated last month.
Once you’re done with the setup, you can save it as a report to view later, or setup email schedules to periodically deliver the report to your team's mailbox.
Automated schedules for sharing and exporting reports

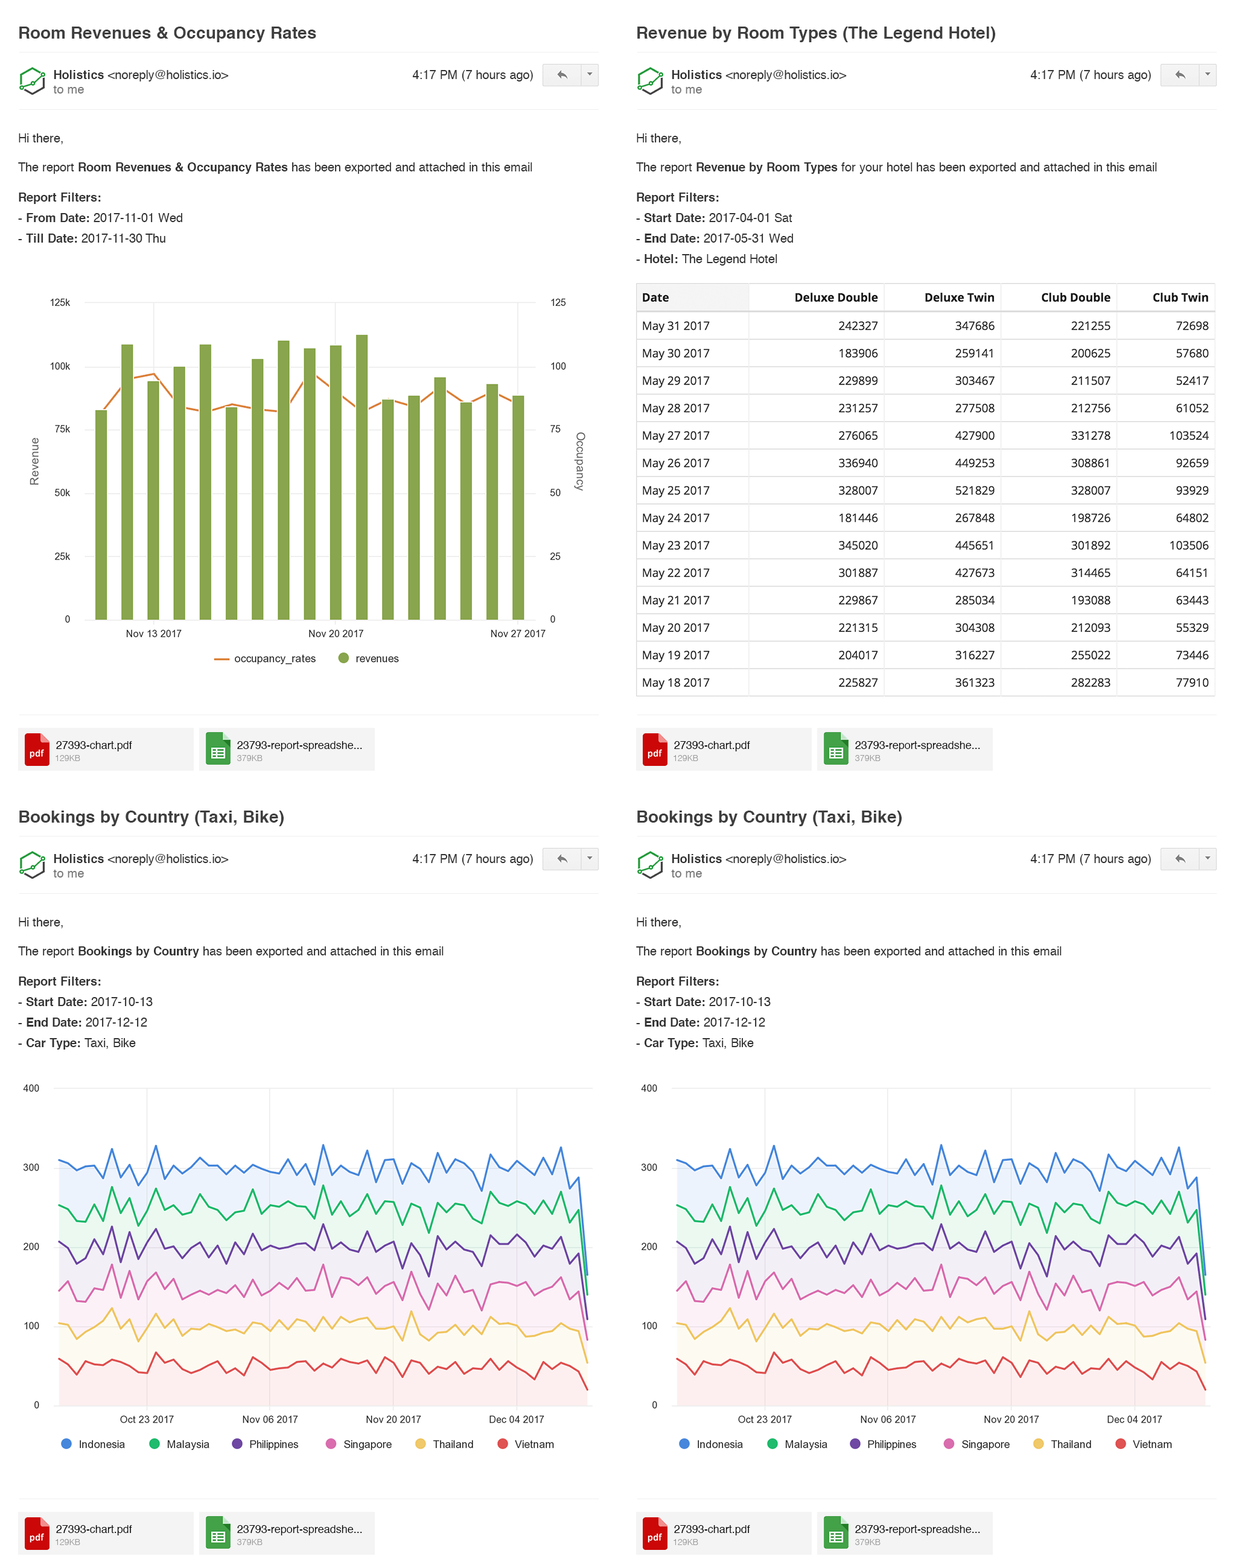
Holistics allow you to automatically and periodically schedule email reports (or dashboards) to be sent to to your team, customers and partners.
Once your explorations are saved as reports, you can click into Schedules icon > New Email Schedule to setup the schedule.
Self-serve data imports from Google Spreadsheets / Google Folders to your database
In some situations, you might need to move data from a spreadsheet into your database, or you might want to import CSV files into a single database table.
If that's the case, Holistics allows you to schedule a pick-up ofExcel or CSV files from a designated Google Folder, which can then be automatically imported into your company database to centralize all the data! All your Holistics reports and dashboards will be up-to-date with this data, without the extra step of manually inputting the files or having to go back and forth with your technical team.
What's happening in the BI world?
Join 30k+ people to get insights from BI practitioners around the globe. In your inbox. Every week. Learn more
No spam, ever. We respect your email privacy. Unsubscribe anytime.

