Top 5 Data Books To Read in 2020
Stuck at home during the pandemic? We give you Holistics's top five data books to read in 2020.
We have high standards for books here at Holistics. If you’d asked us what we recommend to read for a career in data — we’d usually respond with some of the classics. And the bar for classics should be very high. This is for a good reason: new books can be faddish. A book about Redshift is all well and good — until Redshift stops being the hottest data warehouse in town.
In other words, if you want to invest a significant amount of time to read a book — better read something that’s timeless.
This list has a very specific target audience: you are an analytics engineer or a data analyst.
This list has a very specific target audience: you are an analytics engineer or a data analyst. Your job is to get good at cleaning, presenting, and interpreting data. You need a passing familiarity with the data technologies that you work with — but you don’t need to understand the implementation details. (So, for instance, Martin Kleppmann’s Designing Data-Intensive Applications is a modern classic, but it’s more suitable for data engineers, since it gets into the weeds of how databases are actually implemented, alongside other similarly technical topics).
Instead, you want books related to thinking, dealing with, or visualizing data.
Let’s dive in.
1) How To Measure Anything by Douglas W. Hubbard
How to Measure Anything is a 2007 book by management consultant Douglas Hubbard. The primary thesis of the book is that ‘a measurement is a set of observations that reduce uncertainty, where the result is expressed as a quantity.’ Hubbard then shows that there are ways to quantitatively measure anything you want to measure in business.
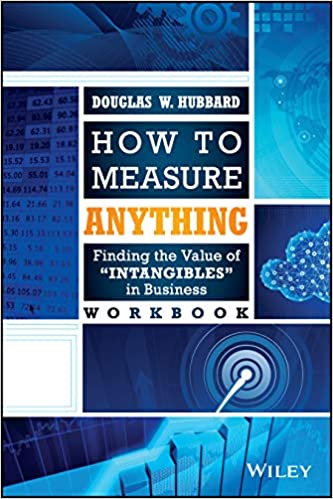
This comes with obvious caveats. We know that some things are not perfectly measurable — for instance, how your customer feels when they start using your product is pretty difficult to measure quantitatively. But where businesspeople might say “oh, that’s not measurable, let’s just give up”, Hubbard points out that measurements are about a reduction in uncertainty — not about perfect fidelity — and so there are actually a large set of quantitative tools that may be brought to bear on this problem.
For instance, say that you want to figure out ‘how people feel when they start using your product’. You decide to poll them on a collection of emotional measures, each on the scale of 1-10. If you have 500 customers, how many customers do you have to ask before you can conclude you have a representative sample? Hubbard shows you how to do a back-of-the-envelope calculation to guide your surveying efforts. It isn’t perfect, but that’s ok: Hubbard says that you’ve accomplished a reduction in uncertainty, and that is the point of measurement.
The rest of the book contains many such techniques like this. It will teach you a specific kind of thinking about measuring business, but more importantly, it will give you practical tools to implement that kind of thinking. No small wonder, then, that it is considered a classic.
2) The Visual Display of Quantitative Information by Edward Tufte
The Visual Display of Quantitative Information is considered a foundational text in the field of data visualization. This isn’t an understatement: before Tufte, data visualization wasn’t considered a thing. Tufte was the first to present an organizing set of principles around ‘the visual display of quantitative information’ (as he called it, quaintly — the term ‘data visualization’ hadn’t yet been invented!). Tufte’s principles are expressed as common-sense guidelines, and presented alongside the most exquisitely printed diagrams and graphs.
Among other things, Tufte argues for clarity, precision, and the efficient use of graphics: ‘above all else, show the data’. Many of his principles are well known today, but it’s worth remembering that Visual Display was the first place to articulate all of those principles together.
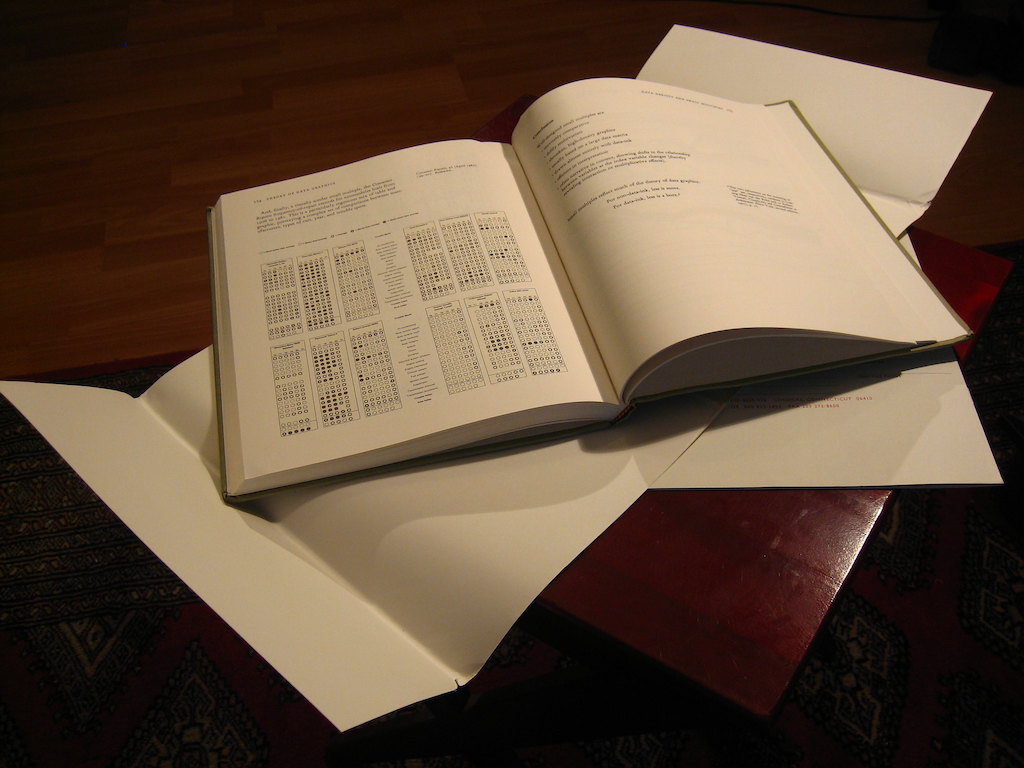 Taken from https://www.flickr.com/photos/qubodup/2825451554, licensed under CC BY 2.0
The book is also stunningly beautiful. Order a physical copy — Tufte had to take a second mortgage out on his house, in the 1980s, in order to self-publish the book. He wanted it to come out a certain way, and he knew no publisher would be willing to incur the expense to print his books the way he intended them to look. So he took a huge risk — and in the process, created a new field of visual communication, in the form of a book I consider to be a work of art.
3) The Data Warehouse Toolkit, by Ralph Kimball and Margy Ross
I’ve written about The Data Warehouse Toolkit in the past — and I argued then that it is not worth reading in its entirety. More precisely, I argued that the book is really two books in one — half of the book is a set of universal data modeling principles that are just as useful today as when Kimball invented them, in the early 90s; the other half is an implementation book, written for the relational database systems and OLAP cubes of Kimball’s day.
The first book is still worth reading; the second book is not. A reader’s guide may be found in our old post on the topic.
With that said, The Data Warehouse Toolkit still belongs on this list because it is a classic in the true sense of the word. Kimball introduced the core concepts of dimensional data modeling with DWT, and he then goes through all the possible use-cases of his techniques over the course of 464 pages.
If I have just one piece of advice: buy the third edition. This is the only edition with an index of ideas (it is presented in the second chapter); the index allows you to jump between concepts without reading the book front-to-back.
4) Statistics Done Wrong by Alex Reinhart
This one is less of a classic, but still very useful to the majority of data analysts. Statistics Done Wrong is a 2015 guide to all the ways you can get your analysis to suck. More precisely, Alex Reinhart goes through the most common mistakes and fallacies that people make in their analytical work, and does this in a breezy, conversational tone.
The book isn’t terribly long — it’s only 176 pages in the paperback edition — and the author spends most of it exploring statistical errors. You really have to approach the book with a solid grounding in stats; Reinhart spends no time educating you in the basics.
Statistics Done Wrong is best seen as a practitioner’s companion to Darrel Huff’s famous How To Lie With Statistics. The latter book focuses on politicians and journalists; this book focuses on the unintentional errors committed by well-meaning scientists, statisticians, and data analysts. It is a worthy inclusion because it is universally useful — the mistakes here will never go out of fashion.
5) Exploratory Data Analysis by John Tukey
I’m going to couch this recommendation with a qualifier: I’ve not finished mathematician John Tukey’s seminal text as of 2020. I have skimmed a badly scanned PDF copy of it, but my experience with the material is actually with another book — the NIST/SEMATECH e-Handbook of Statistical Methods, which summarises many of Tukey’s methods (with the intention for use by busy US government scientists).
That said, Tukey’s book on EDA unequivocally belongs to this list. It's 2020 and EDA is still considered one of the foundational texts of data analysis; among other things, it was the book that introduced and popularized the box-plot.
Like The Data Warehouse Toolkit, many of the techniques that Tukey presents here are outdated (he has many tips for drawing these diagrams by hand — something we no longer need to do with the invention of the computer!) But the ideas and principles that Tukey lays out are still relevant, especially if you want to make sense of a new dataset.
The book is a monster — clocking in at 712 pages. But if you’re stuck at home in 2020, and willing to spend a few dozen hours to imbibe a rigorous worldview, or to win bragging rights … settle right in.

Staff writer at Holistics. Enjoys Python, coffee, green tea, and cats. I'd love to talk to you about the future of business intelligence!