The Analyst Guide to Designing a Modern Data Warehouse
High level guide for data analysts and engineers starting their first data warehouse project.
So you are asked to build a data warehouse for your company. A data warehouse that is efficient, scalable and trusted. If your company is seriously embarking upon implementing data reporting as a key strategic asset for your business, building a data warehouse will eventually come up in the conversation.
But building a data warehouse is not easy nor trivial. Over 50 percent of data warehouse projects have limited acceptance, or will be outright failures.
How should you go about to start designing and building your data warehouse? What are the pitfalls and how should you optimize it? Most importantly, where should I start?
This post provides a high level guide on how to think about setting up your data warehouse to avoid some common pitfalls.
What is a data warehouse?
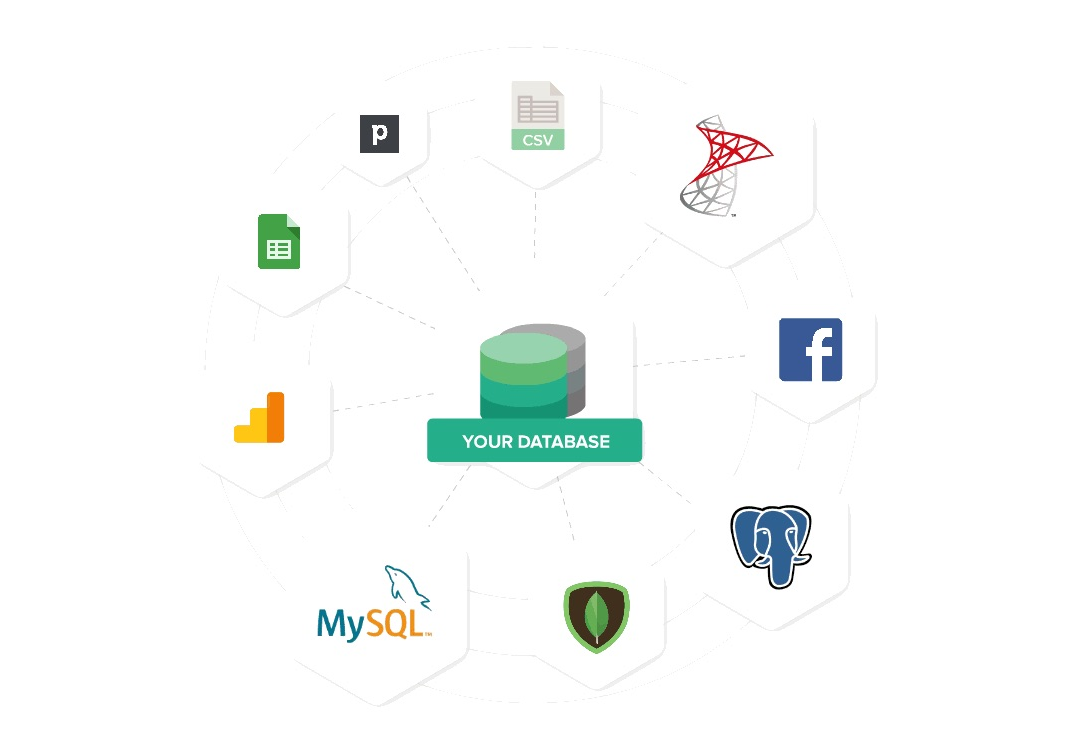
A modern business typically have data stored in different places (data sources). This can be data from:
- Application databases: For startups, this is likely their core product application. For other businesses, it can be their point of sale application,
- Web applications: This can be applications that is needed to either scale a business or maintain business operations. Examples could be email marketing software like Mailchimp, web analytics applications like Google Analytics or Mixpanel, or even accounting software like Xero and Quickbooks.
- Spreadsheets: This can be in the form of desktop spreadsheets (Excel, CSV) or online spreadsheets such as Google Sheets. These data may be updated manually by someone, or updated by a Zapier activity.
A data warehouse sync data from different sources into a single place for all data reporting needs.
It provides data that can be trusted to be reliable, and can handle the querying workload from all employees in the company.
Designing a data warehouse
Also read: When should you get a data warehouse?
Here’s how a typical data warehouse setup looks like:
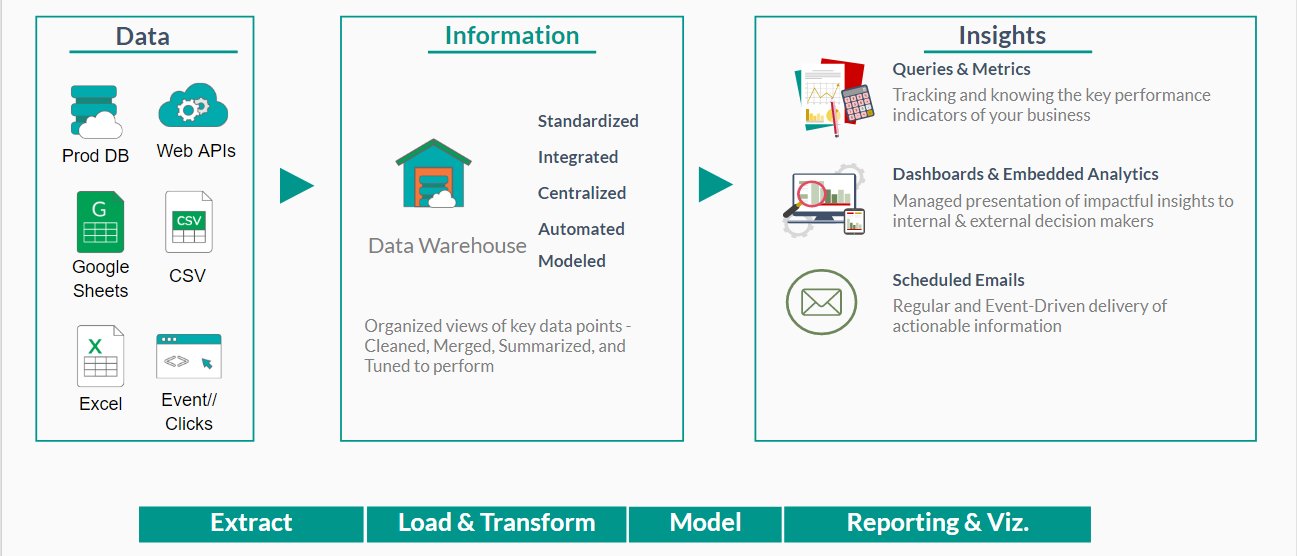
You design and build your data warehouse based on your reporting requirements. After you identified the data you need, you design the data to flow information into your data warehouse.
1. Create a schema for each data source
Create a database schema for each data source that you like to sync to your database. This
- Helps you quickly identify the data source that each table comes from, which helps as your number of data sources grow. Future data analysts and business team members that join your company can also quickly learn what each data source has.
- Lets you assign specific permissions (read/write) for each data source. For example, a data engineer may not want to allow a junior analyst to only read, but not write to a specific schema.
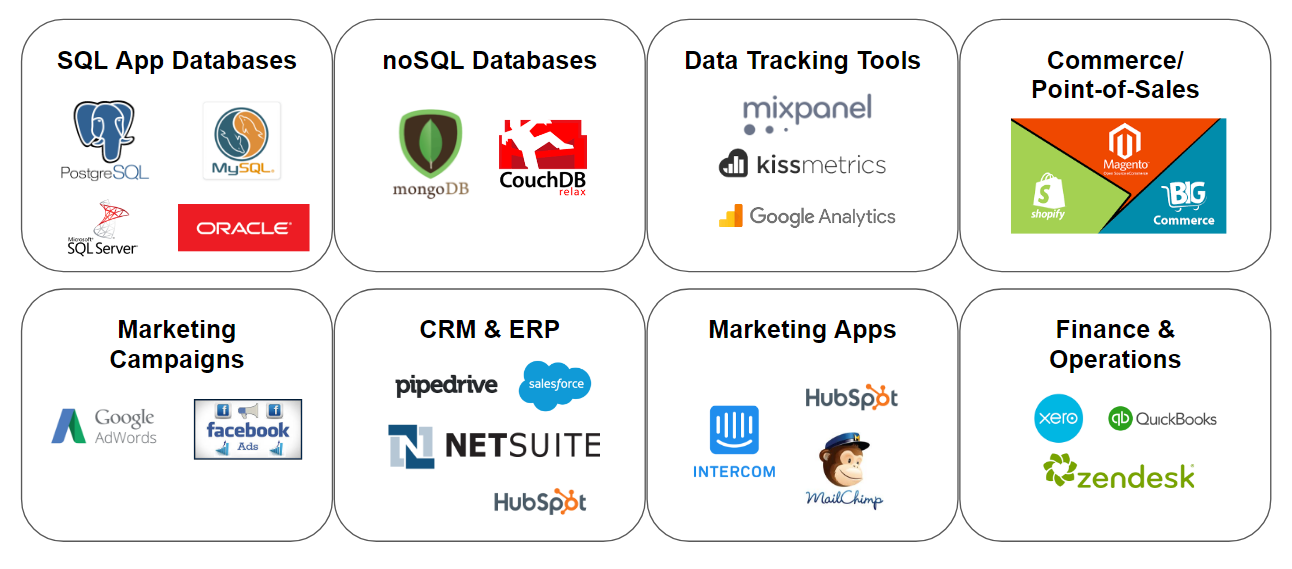
This is especially helpful when your number of data sources grow over time. Just look at the number of sources that your data could be in.
For example, you can set up a schema called mailchimp, xero, or fbads for the email marketing, finance and advertising data you like to import from these applications into your warehouse respectively.
When you import your contacts table from Mailchimp into your database, you
can query them as:
SELECT name, email FROM mailchimp.contacts
How to create a schema
Creating a schema is easy. You just need to type in a line to create a new schema. In fact it’s just 3 words in Postgres.
CREATE SCHEMA [datasource_name]
Example:
CREATE SCHEMA mailchimp
Note 1: New analysts may get confused between a database schema. There are 2 schema definitions. A schema may be used to describe either
- How the tables and fields in a database are related to each other, or
- A folder for database tables, just like how folders organize your files
Note 2: mySQL databases don’t support schema, so you may want to use a naming convention to name the tables you import, such as mailchimp_contacts etc. That’s one of the reason we encourage our customers to use PostgreSQL for their reporting database.
2. Moving source data into your data warehouse
The next step is to sync your source data into your data warehouse. Your engineers may know this as an ETL script.
Design your import script with the following considerations:
- Remove columns that are obviously unnecessary. It’s not that difficult for you to add them in later if you realize you need them.
- Rename column names to make them more descriptive or database friendly (such as using lower case, or camel case.
- Filter out obviously unnecessary records. This can be records your internal users test on your production system (sometimes your users may add data like [email protected] or setting their first name as tests)
- Map record values to make them more readable. This save your analysts effort renaming them during report with CASE-IFs later). For example, some records may store numerical keys (1,2,3, 99 etc) or abbreviated names that may not be known to the rest of the organization. In those cases, you may want to map these keys to their actual values during the import process.
- Apply database indexes to your destination table after the import is done. Note we've written about what database indexes are in an earlier post.
- Error Handling : Setup emails//Slack alert message to be sent to the relevant stakeholders (especially data analysts) with detailed error logs when the job fails. You may want to set-up automated retry attempts (or automated recovery processes) within a specific time period to reduce the number of false positives in this case.
3. Should you transform your source (raw) data?
One question we often get asked is how to apply data transforms before moving the data to the warehouse.

Our general advice is not to do it. At least not at the beginning. Especially if this is your first data warehouse project. There’s a few reasons for this.
a. It’s unlikely you have clear requirements on your data transform needs
Even if you are given “clear requirements”, it’s likely that this requirement will change over the course of the project, or gets outdated.
You will not want to spend time revising your ETL script based on what different stakeholders want at different points in time.
Moving your (untransformed) source data helps you separate the dependency of your ETL script away from the “business requirements”.
b. It’s likely you need the source data for other cases
Think about your source data as a base of interaction that can be derived into multiple derived tables, either by aggregating them along different dimensions or joining them with tables from other sources.
See example below on how to track the effectiveness of seller's conversion.
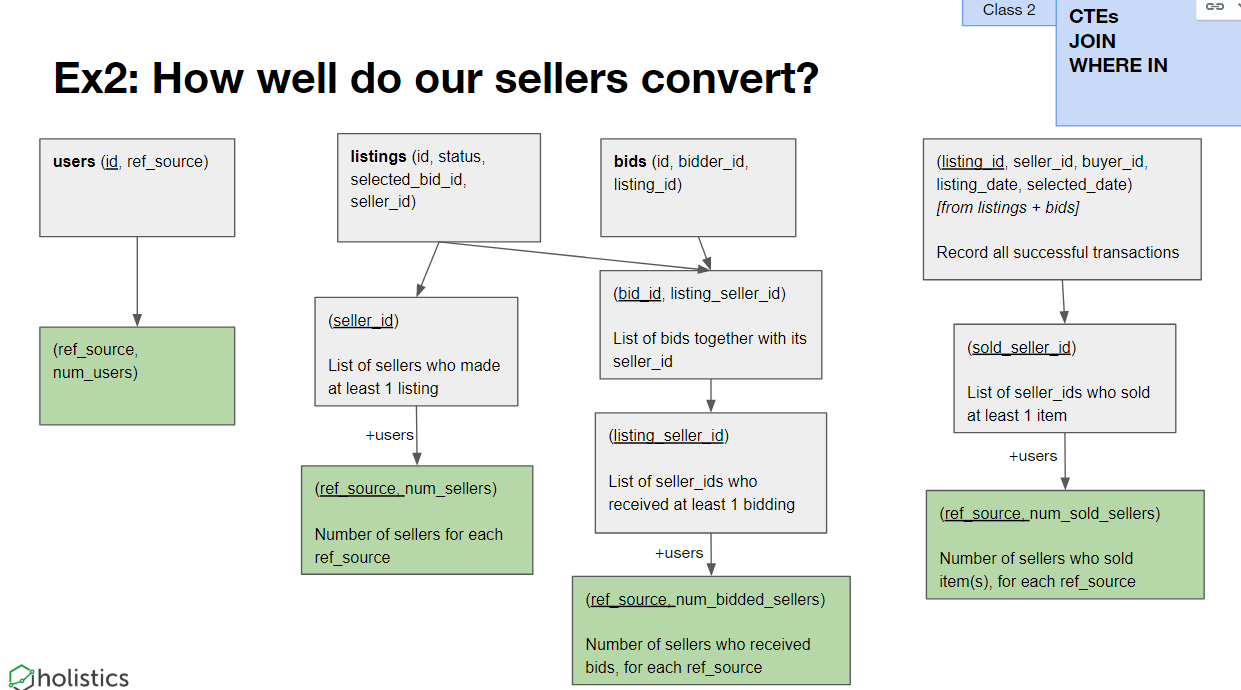
When transforming data, you lose details from the source data that may be needed for future reporting use-cases.
For example, when you summarize sales revenue by time period, you lose details of the specific transaction records that another user may need to correlate with other reports.
Moving your untransformed source data will give you flexibility to combine it with other data sources.
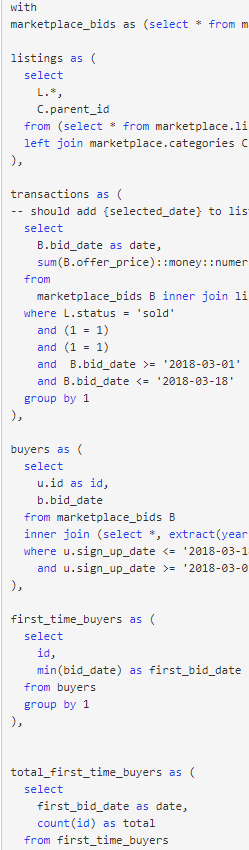
The need for source data gets more important when you start looking into building reusable data models to answer different questions. See an example below on a cohort report is built with a series of post-transformed data. This will be more difficult to do if you have not
c. Reduce load on your source systems
Running data transforms in the source system may take up considerable resources, especially if you have a database that service customers around the world.
You will not want to overload it with long-running data transformation jobs prior to moving them over.

There are a few cases that may make sense for you to transform data prior to moving them over, but those cases are typically for companies who have already setup a reliable data warehouse and looking to improve it further.
4. Transform data to solve a specific problem
Thinking about how to transform data can be complex. If left unchecked, you may end up spending lots of time optimizing data that does not deliver value to the business.
Planning, designing and implementing data transforms without a clear outcome is a solution looking for a problem.

One good rule of thumb is to begin with the end in mind. Data transforms should be created only to address a practical use-case or problem from your reporting.
A good way to find (and prioritize) those practical use-cases is to start building the reports and dashboards with the data you imported.
When your users start raising query performance issues, you can then look into transforming the data.
This can be caused by reports that either
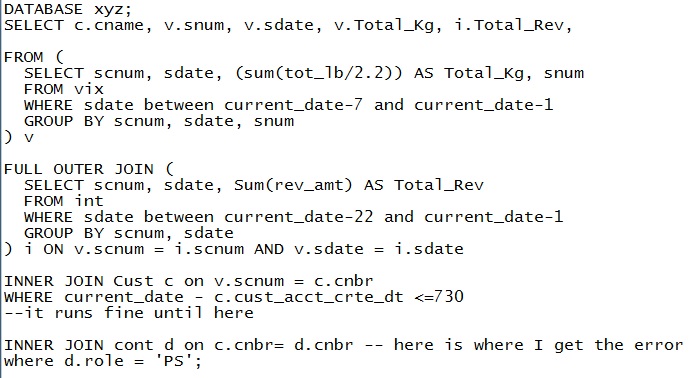
(a) Contains nested subqueries or custom table expressions (CTEs)
(b) Or have multiple (expensive) joins across multiple tables.
This is where the flexibility of SQL-based reports comes in handy to help identify the problems that data transformation can address.
It’s easy for any analyst to quickly identify the root-cause of reports with long running queries, and initiate to optimize their performance.
This is largely done through automatically pre-aggregating the data. This can be done with materialized views where you can create data transform jobs that either:
- Aggregate large transaction tables to speed up query performance.
- Create derived tables with columns from different data sources
- Replace/mask sensitive data for selected groups of users.
Another recommendation is to create a new database schema in your data warehouse for you to store your transformed (or post-processed) tables.
Like the earlier approach of separating each data source by schemas, creating a specific schema can help you identify the list of derived/transformed data tables. This will be helpful later on when you start to string a series of data imports, data transform jobs in sequence as your data maturity grows.
5. Create your internal data documents
This is important, especially if you do not want your data warehouse to be a black box where only a few engineers understands how to use it. If your users don't understand it, they won't be confident to query it.
You can start by creating a shared document (can be Google Doc) that describes a common understanding of:
- Tables and columns in your source data, and how to interpret them
- Include data diagram if any.
- How to read your columns in your reports (dashboard, metrics) and any underlying assumptions behind them
Each time when a report is created (or updated), update this document to reflect any new level of business understanding of your data.
We will share more details on how to create and structure this internal data document in a separate post, so watch out for this space!
That’s it!
We hope this guide has been helpful! Let us know how we can help with your journey to build a reliable data warehouse.

CEO & Co-founder of Holistics. Dedicated to sustainable growth. Loves morning walks, or knowing people better over coffee. :)