6 Qlik Sense Alternatives and Competitors


Contents
When to Look for Qlik Sense Alternatives
You should start exploring alternatives to Qlik Sense when you hit friction in three areas: limited adoption across teams, high total cost of ownership, or misalignment with your broader data stack. If you're building toward a self-service analytics culture or adopting a modern data stack (dbt, cloud warehouses, semantic layers), Qlik might not be your best long-term fit.
Qlik Sense is a technically powerful tool with solid built-in ETL and a unique associative data engine. But if only a handful of specialists can operate it effectively, your organization misses the real upside of BI: giving business users direct access to insight.
Here are a few signs it’s time to consider alternatives:
- Your data team is acting as a reporting service desk. If stakeholders are still emailing you to update dashboards or tweak metrics, your BI tool isn’t enabling self-service. Qlik has some self-service features, but compared to newer tools built for business users (like Power BI, Tableau, or Holistics), it often feels rigid.
- You’re struggling to scale beyond a small user base. Licensing models, steep onboarding curves, and a lack of robust collaboration features can turn Qlik Sense into a walled garden. If only trained developers are building dashboards, you’re not scaling insight.
- Your stack is modern, but Qlik isn’t keeping up. You’re using dbt, storing everything in Snowflake or BigQuery, and version-controlling models in Git. Qlik’s proprietary scripting and limited Git integration mean it often sits outside the flow of your modern analytics workflows.
- You need more polished, flexible visuals. While Qlik is great for power users and backend modeling, its visual output often lacks the polish of Tableau or even Power BI. If executives care about presentation, that matters.
You don’t have to rip out Qlik Sense overnight. But if it’s slowing you down or limiting your ability to democratize data, it’s worth exploring other BI tools.
Best Qlik Alternatives and Competitors
The best alternatives to Qlik we'd recommend are:
- Holistics
- Looker
- Tableau
- Power BI
- GoodData
- Domo
1. Holistics
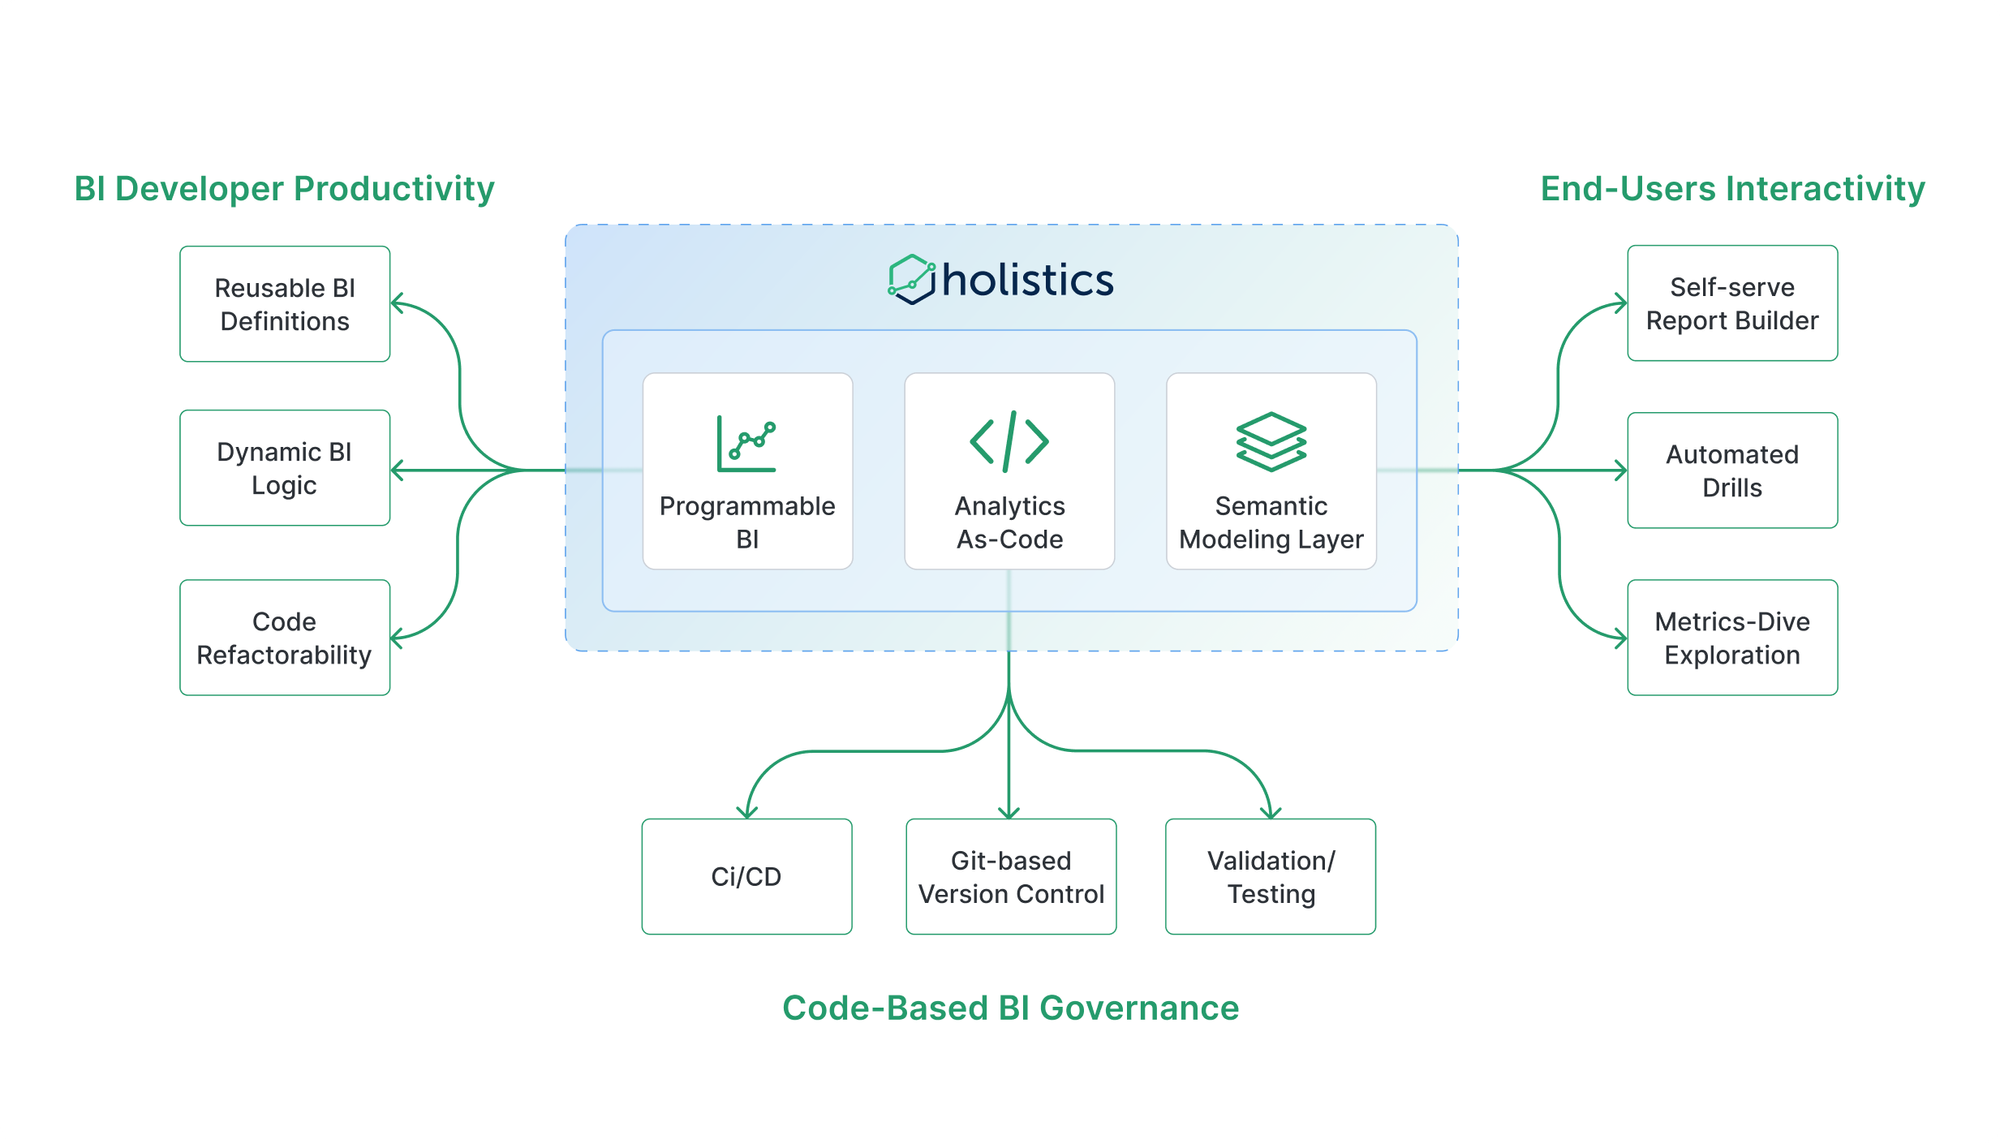
Holistics is a self-service business intelligence platform that combines the power of code-based semantic modeling with a drag-and-drop report builder for business users, making it a strong alternative to Qlik Sense.
If you're coming from Qlik Sense, Holistics might feel like a breath of fresh air, especially if you're tired of juggling scripting quirks, slow UI feedback loops, and siloed dashboard logic.
Key Features
- Code-based Semantic Layer: Define metrics and analytics logic once in a central semantic layer and reuse them in multiple reports. Holistics supports Git-based version control and CI/CD workflows out of the box.
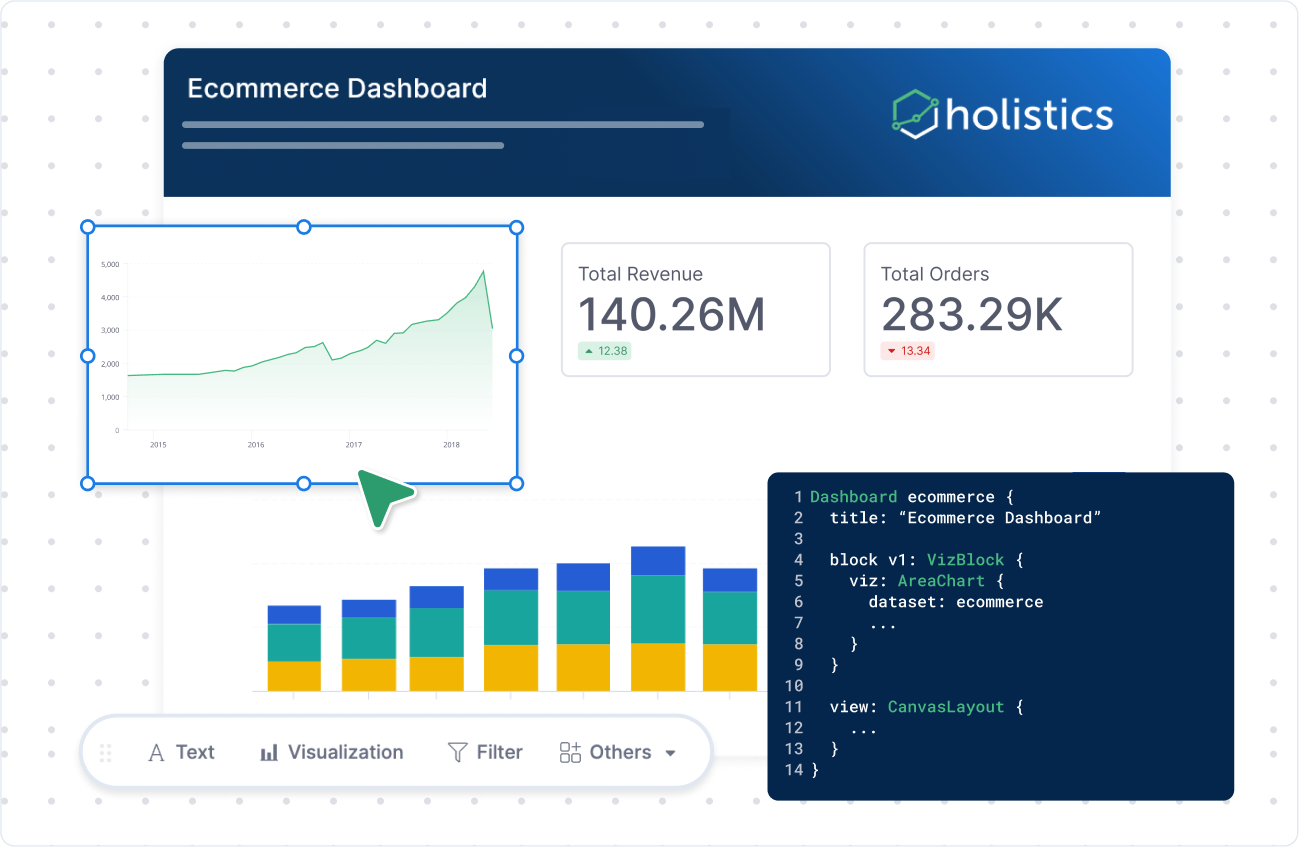
- Dashboard-as-Code: Dashboards can be defined, updated, and templatized via code. Great for teams managing dozens of similar dashboards across regions, clients, or business units.
- Holistics AI: Explore data and generate charts and data models using natural language. Holistics AI acts as a co-pilot for analysts and business users alike, speeding up development and discovery.
- Permission & Governance Controls: Define granular data access at the model layer. Share dashboards with internal or external users while keeping logic and data lineage consistent.
- Reusable BI Components: Define metrics, filters, and chart components once, then reuse them across dashboards. This drastically reduces duplication and improves maintainability across your analytics surface.
- Self-Service Layer: Business users can compare periods, calculate percent-of-total, and slice data using built-in 1-click functions or a drag-n-drop report builder.
Pricing: All plans include a 14-day free trial, starting from $800/month:
- Entry: $800/month
Includes 100 reports, core self-service features, Canvas Dashboards, data delivery destinations, hosted Git version control, and dbt integration. - Standard: $1,000/month
Adds unlimited reports, custom charts, custom dataset views, Git integration to your own repo, and Google SSO. - Security Compliance Suite: $2,000/month
Built for enterprise data governance. Adds RBAC, SSO/SAML, activity monitoring, IP whitelisting, and data export controls.
2. Tableau
Tableau has been the gold standard for BI dashboards for over a decade, especially in enterprises with large data teams. Known for its powerful visual capabilities and pixel-perfect control, Tableau is often the go-to when presentation matters as much as analysis.
Compared to Qlik Sense, Tableau offers a more polished visual experience, but with tradeoffs in flexibility, speed, and cost.
Key Features
- Best-in-Class Visual Design: Tableau’s drag-and-drop interface lets you build polished dashboards with precise layout control. You can tweak fonts, borders, spacing, and interactivity to the pixel, something Qlik Sense often struggles with.
- Strong Community & Ecosystem: Tableau Public, forums, and the broader Tableau user community are unmatched. There’s a decade of templates, tutorials, and extensions to learn from.
- Advanced Interactivity: Parameters, filters, set actions, and tooltips can be deeply customized to create guided analytics experiences or interactive dashboards for executive audiences.
- Tableau Prep for Data Cleaning: Tableau Prep gives analysts a visual way to clean, join, and transform data before it hits a dashboard. While not a full ETL tool, it’s useful for light prep without switching tools.
- Live & Extract Connectivity: You can query your data live or use Tableau’s in-memory extract engine for faster performance. Useful if your database isn’t optimized for real-time BI.
Pricing: Tableau’s pricing depends on role-based licenses and deployment model (Cloud vs Server):
- Tableau Creator: $75/user/month
Full authoring rights, includes Tableau Desktop and Tableau Prep. - Tableau Explorer: $42/user/month
For business users who explore and interact with published dashboards but don’t build them. - Tableau Viewer: $15/user/month
For end users who just need to view and consume dashboards.
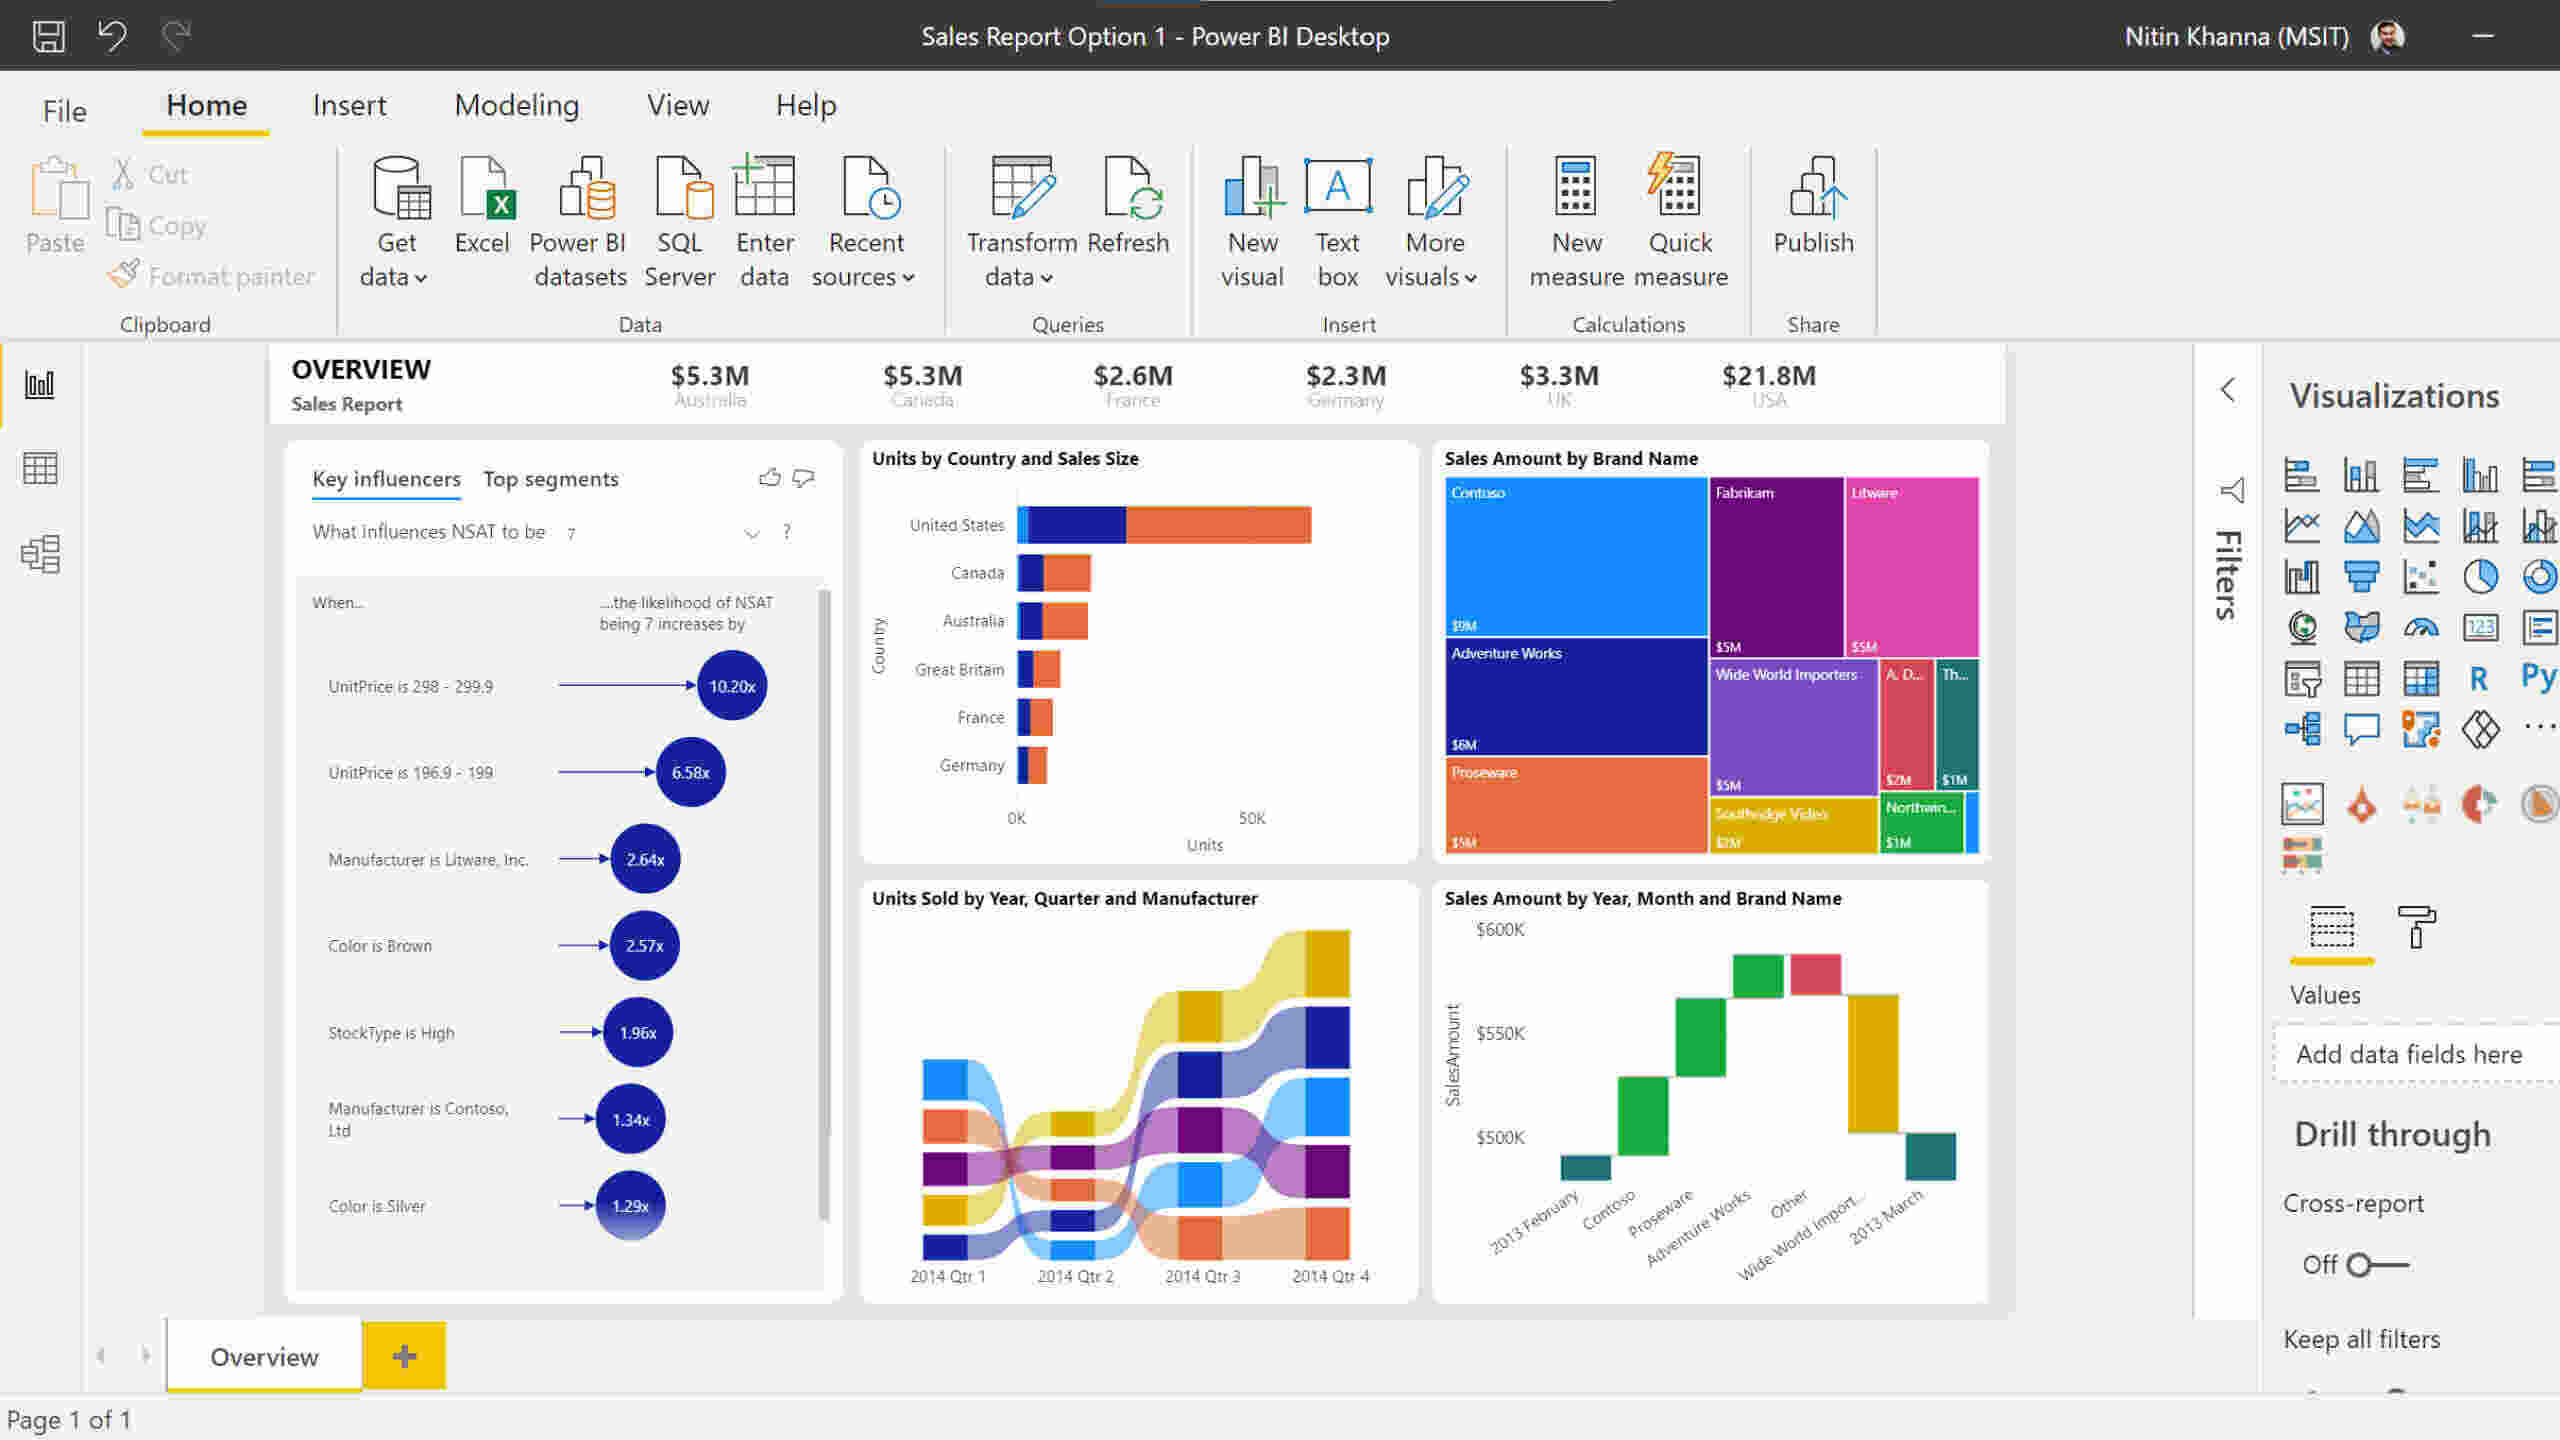
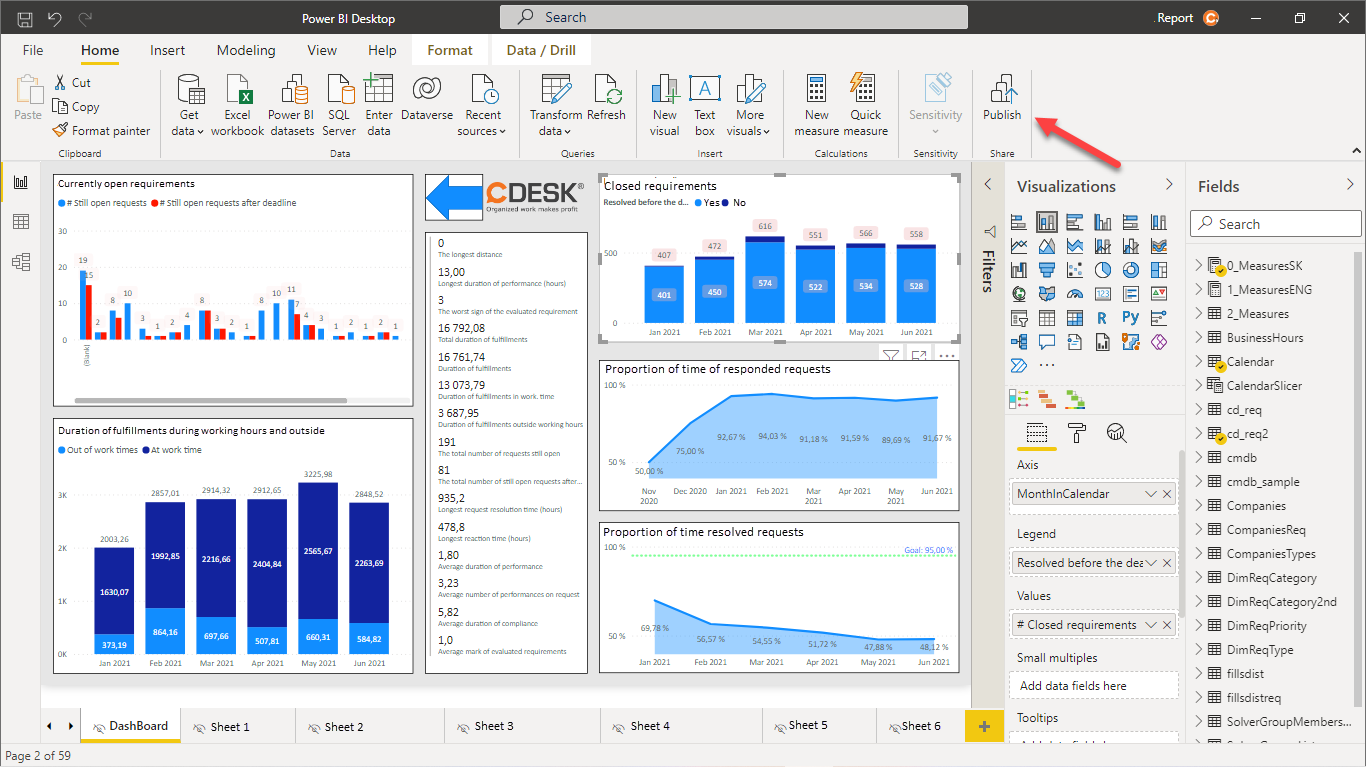
3. Power BI
Power BI is Microsoft’s flagship analytics tool, tightly integrated with Excel, Azure, Teams, and the broader Microsoft 365 ecosystem. It’s often the default choice for organizations already invested in Microsoft, and it’s hard to beat on price. Compared to Qlik Sense, Power BI is easier for Excel users to pick up and integrates more seamlessly into enterprise IT environments.
Key Features
- Deep Excel Integration: If your team lives in Excel, Power BI will feel familiar. You can copy-paste pivot tables, reuse Power Query logic, and even embed Excel reports inside Power BI dashboards.
- Affordable, Flexible Licensing: Power BI offers a free desktop version for individual users and low-cost Pro licenses for collaboration. It’s widely seen as the best value-for-money BI tool on the market.
- Strong Data Modeling with DAX: DAX (Data Analysis Expressions) is a powerful, albeit steep, language for building measures and calculated columns. Complex business logic can live in the model layer, not just SQL.
- Built-in ETL via Power Query: Clean and transform data inside the tool using Power Query, the same engine behind Excel’s data import features.
- Visuals and Customization: Power BI comes with a growing marketplace of custom visuals, and while less polished than Tableau, it’s good enough for most business use cases.
Pricing: Power BI is aggressively priced:
- Power BI Desktop: Free
Full-featured authoring tool for individual use (no sharing or collaboration). - Power BI Pro: $10/user/month
For teams that need to publish, share, and collaborate on dashboards. - Power BI Premium (Per User): $20/user/month
Adds larger dataset sizes, AI features, paginated reports, and more. - Power BI Premium (Capacity): Starting at $4,995/month
For large enterprises that want dedicated capacity and broader scalability across departments.
4. Looker
Looker (now part of Google Cloud) pioneered the modern semantic layer with LookML, a modeling language that lets data teams define consistent metrics across the organization.
Unlike Qlik Sense, which mixes business logic into load scripts and dashboards, Looker separates the modeling layer from visualization, enabling clean governance and repeatability. It’s a great fit for teams prioritizing version control, data consistency, and SQL-based development.
Key Features
- Centralized Semantic Modeling with LookML: Define metrics, dimensions, joins, and logic in code. Once modeled, business users can explore the data without writing SQL—using curated, governed definitions.
- Tight Git Integration: All LookML code is stored in Git, enabling branching, versioning, and deployment workflows like any software engineering project.
- Exploration without SQL: Business users can drag and drop fields into visualizations without needing to understand the underlying SQL. The model layer enforces consistency and guardrails.
- Advanced Access Control & Governance: Granular permissions and user roles ensure secure, role-based access to both data and logic.
Pricing: Looker’s pricing is not publicly listed and is entirely quote-based. That said, here’s what you should expect:
- Enterprise pricing only: Typically starts at ~$30K/year and goes up based on user seats, query volume, and deployment model (cloud vs on-prem).
- No freemium tier: There is no free version or trial you can run without going through sales.
5. Domo
Domo positions itself as an all-in-one cloud-native BI platform that simplifies data integration, transformation, and visualization. It’s designed for business users who want quick access to insights without needing to learn SQL or manage infrastructure.
Compared to Qlik Sense, Domo trades power-user depth for accessibility and automation, making it popular among non-technical teams, especially in sales, marketing, and operations.
Key Features
- End-to-End Cloud Platform: Domo handles everything from data ingestion to visualization in one platform. It includes native connectors, ETL tools, a data warehouse, dashboarding, and even mobile apps—all managed in the cloud.
- No-Code ETL ("Magic ETL"): Users can clean, join, and transform data with a drag-and-drop interface, eliminating the need for SQL in many workflows. Ideal for teams without dedicated data engineers.
- Mobile-First Design: Domo’s mobile app is one of the best in the BI market. Dashboards and alerts are optimized for mobile, making it easy for execs and field teams to check metrics on the go.
- Pre-Built Connectors and Dataflows: Hundreds of prebuilt data connectors (Salesforce, Google Ads, Facebook, Snowflake, etc.) and pre-configured dashboards help teams get started quickly without building from scratch.
Pricing: Domo follows a usage-based enterprise pricing model:
- No public pricing: Domo requires a sales conversation to generate a quote.
- Starts around ~$25K/year: Pricing scales based on users, data volume, connectors used, and custom app development.
Domo’s convenience comes at a premium. It’s best for organizations that prioritize time-to-insight, minimal IT involvement, and strong mobile capabilities over deep control and open architecture.
6. GoodData
GoodData is a lesser-known but technically robust BI platform tailored for product teams, OEM use cases, and enterprises needing fine-grained control over data architecture. Compared to Qlik Sense, GoodData is more API-driven and developer-oriented, but less friendly for internal, ad hoc dashboarding.
Key Features
- Headless BI and Semantic Modeling: GoodData separates the semantic model, metrics, and visualization layers, allowing teams to build data products in a modular, scalable way. You can expose metrics via APIs or embed them into custom UIs.
- Metrics Layer with MAQL: MAQL (Metric Analytical Query Language) is GoodData’s custom language for defining reusable metrics across dashboards and APIs. It abstracts SQL away from the business layer.
- Open APIs and Embeddability: Every dashboard, visualization, and metric can be accessed or manipulated via API. This makes it highly customizable and programmable—but also more technical to set up.
- KPI Dashboards with Alerting: While less visually rich than Tableau or Power BI, GoodData supports flexible KPI dashboards, scheduled delivery, and alerting based on metric thresholds.
- Cloud-Native with Hybrid Deployments: GoodData Cloud is the default deployment, but they also support hybrid options for compliance-sensitive environments.
Pricing
GoodData offers tiered pricing based on data volume, usage, and embedding needs:
- Free Tier (GoodData.CN Community Edition)
Run a local Docker instance to explore the platform, limited in scale and support. - Growth Plan. Starting ~$1,000/month
Includes cloud-hosted deployment, standard dashboards, and limited embedding. - Enterprise Plan. Custom Pricing
Adds advanced governance, SSO, private VPC deployment, multi-tenancy, and higher API throughput.
Qlik Sense vs Looker
Qlik Sense and Looker are both powerful BI tools, but they serve different types of teams.
Qlik Sense is ideal for teams without a modern data stack. It includes its own scripting language and built-in ETL engine, which makes it useful for working with messy or siloed data. Its associative engine enables flexible exploration, but logic is tightly bound to the UI, making governance and versioning harder.
Looker, on the other hand, is built for teams with a centralized warehouse and a software-engineering mindset. It uses LookML (a modeling language) to define reusable metrics and stores everything in Git. Business users explore cleanly-modeled datasets without writing SQL, and dev teams can manage code in CI/CD workflows.
If you need strong visual interactivity and ETL in one tool, go with Qlik. If your priorities are semantic modeling, governance, and code-first workflows, Looker is the better fit.
Qlik Sense vs Tableau
Qlik Sense and Tableau both deliver interactive dashboards, but they optimize for different things.
Qlik Sense shines in data prep and backend flexibility. Its built-in ETL and associative engine are great for exploring complex, messy datasets without needing a full data stack. But its visuals lack polish, and dashboard design is more rigid compared to Tableau.
Tableau is all about presentation. It gives you pixel-level control over visuals, making it the go-to for executive dashboards and data storytelling. It assumes you’ve already modeled and cleaned your data elsewhere, as it offers limited transformation capabilities natively.
Qlik is more developer-friendly under the hood, while Tableau is more visually intuitive for business users.
Use Qlik Sense if your data is fragmented and needs heavy lifting in one tool.
Use Tableau if visual fidelity and presentation quality are your top priorities.
Qlik Sense vs Power BI
Qlik Sense and Power BI often compete head-to-head, especially in enterprise settings, but they cater to different user bases.
Qlik Sense is more developer-oriented, with its own scripting language and in-memory data engine. It handles complex data transformations well and suits teams needing more control over backend logic. However, it can feel heavy for casual users and harder to scale across non-technical teams.
Power BI is designed for broad adoption. It integrates tightly with Excel, Microsoft 365, and Azure, making it an easy choice for Microsoft shops. Business users can build dashboards with little training, and it’s significantly cheaper to license at scale.
Use Qlik Sense if your team has technical resources and complex data challenges.
Use Power BI if you want a cost-effective, business-friendly tool that fits naturally into the Microsoft ecosystem.
Qlik Sense Alternatives for Embedded Analytics
If you're embedding dashboards into a SaaS app, or customer portal, these tools offer stronger capabilities than Qlik Sense:
- Sisense: Robust JavaScript SDK, white-labeling, and multi-tenant support. Built for developers embedding analytics into products.
- GoodData: Headless BI with strong API access, semantic modeling, and native multi-tenancy. Ideal for OEM scenarios.
- Metabase (Open Source): Easy to embed, customizable with JavaScript, and lightweight for startups or internal tools.
- Holistics: Offers public dashboard sharing and embedding, with strong control over user access, filters, and self-serve report building for embedded users.
Alternatives to Qlik Sense with Natural Language Query Support
If you're looking for tools that support natural language querying (NLQ) or AI-driven exploration, consider:
- Power BI: Built-in Q&A feature lets users type questions in plain English to generate visuals automatically.
- ThoughtSpot: Purpose-built for NLQ with a strong search-first experience. One of the most advanced in the space.
- Tableau (with Ask Data) – Supports natural language input with automatic visual generation, though it's more limited than ThoughtSpot.
- Holistics AI: A semantic-aware assistant that lets users chat with data and build visualizations in plain English. Instead of translating prompts directly to SQL, Holistics AI generates queries using its composable AQL language. This ensures higher reliability, reusability, and alignment with your defined metrics.
What's happening in the BI world?
Join 30k+ people to get insights from BI practitioners around the globe. In your inbox. Every week. Learn more
No spam, ever. We respect your email privacy. Unsubscribe anytime.
