10 Domo Alternatives and Competitors To Look For


Contents
Before running a business intelligence company, I was a data engineer. I wrote pipelines, poked Redshift whenever it fell over, and schlepped data from system to system.
I found myself on both sides of the great BI tool trench. On one side, evaluating tools, wading through demos, and trying to guess which buzzwords actually mattered. On the other, filling out RFPs and RFIs, demo-ing Holistis to BI evaluators.
What I learned is that there are two types of data professionals when it comes to evaluating BI tools.
- They stick with the status quo - be it Tableau, Power BI, or Looker, shaping the organization to fit the tool (or at least trying to).
- They come armed with a detailed list of criteria and won’t stop until they’ve vetted everything. I mean everything! (I’ve seen one evaluated 42 tools. I hope they at least got snacks.)
If you’re in the latter group, this post is for you, especially if Domo is currently on your radar.
Domo is great, no doubt about it. It’s been around the block. But, like many big incumbents, cracks start to appear when they outgrow their customer-first roots. Pricing gets mysterious. Data modeling lags behind what you actually need. And support leaves you yearning for more.
In this post, we’ll look into 10 strong alternatives to Domo. Whether you’re a product manager or a CTO, this guide will help you find a tool that fits your specific needs—without the usual headaches of a Domo setup.
Domo at a Glance: Pros and Cons
Domo is a popular tool in the embedded analytics market, but its reputation is often mixed. While it offers a range of features designed for data-driven teams, Domo’s drawbacks—particularly its high costs and limited flexibility—make it a less-than-ideal solution for many. Here’s a closer look at what Domo brings to the table, as well as where it tends to fall short.
Key Features of Domo
- Cloud-Based Platform: Domo provides a fully cloud-based infrastructure, making it accessible for distributed teams and removing the need for extensive local IT support. This setup is ideal for companies needing a secure, scalable analytics platform.
- Extensive Pre-built Connectors: Domo offers a wide range of pre-built connectors, allowing seamless integration with hundreds of data sources. This makes it easy for teams to centralize data from multiple platforms, reducing the time and complexity of manual data imports. Learn more about Domo’s connectors here.
- Custom Visualization Options and Maps: Domo provides a variety of visualization options, including customizable dashboards and interactive maps, to suit different business needs. Although customization is somewhat limited, these built-in visuals make it easier to start analyzing data without heavy configuration.
- Mobile Accessibility: Domo’s mobile-first design enables users to access dashboards and analytics on the go, an increasingly valuable feature for teams that rely on mobile devices for data-driven decision-making.
- Robust Embedding: Domo supports robust embedded analytics, allowing companies to integrate analytics directly into their own applications. This feature is particularly valuable for organizations looking to provide clients or internal teams with seamless access to insights within existing workflows.
Domo Limitations
High Costs and Opaque Pricing Structure
Finding Domo’s pricing might feel like trying to solve a Rubik’s cube in the dark—complex, unpredictable, and a little infuriating.
The lack of transparent pricing often catches teams off guard, especially those that need to scale.
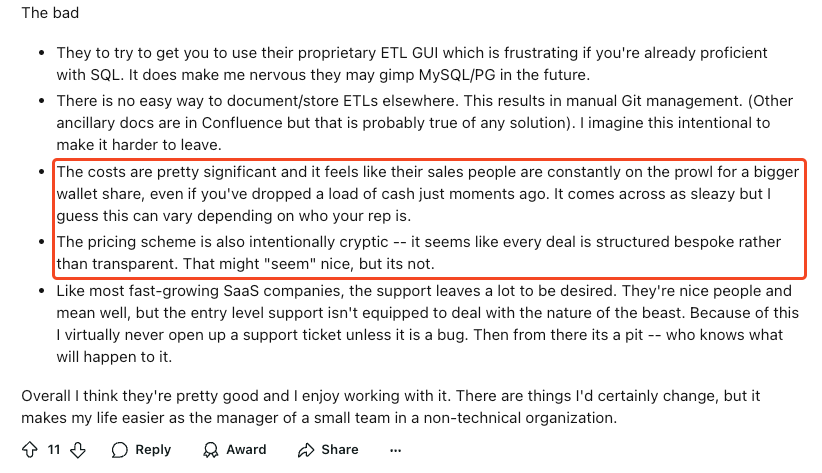
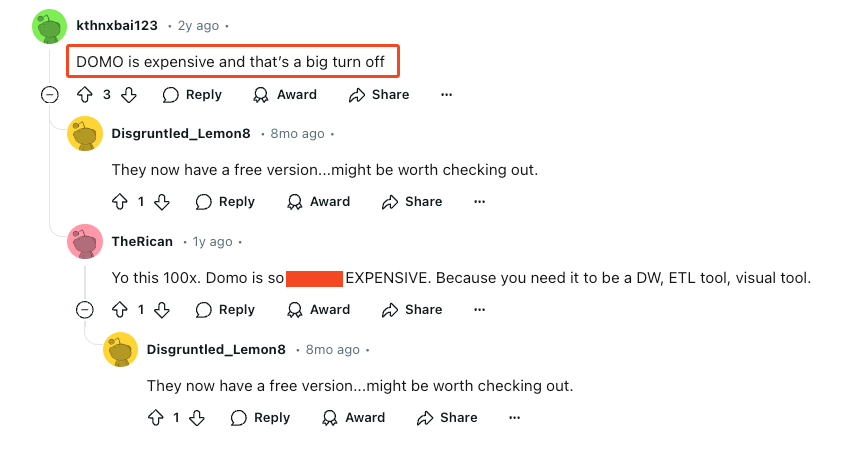
On Reddit and other forums, frustration is easy to find: users frequently vent about Domo’s opaque pricing model, with many questioning whether they’re paying for features they don’t actually use. For budget-conscious teams, this unpredictability can make planning difficult and might even deter organizations from fully committing to the platform.
Limited Frontend Customization
This is something you need to try out yourself.
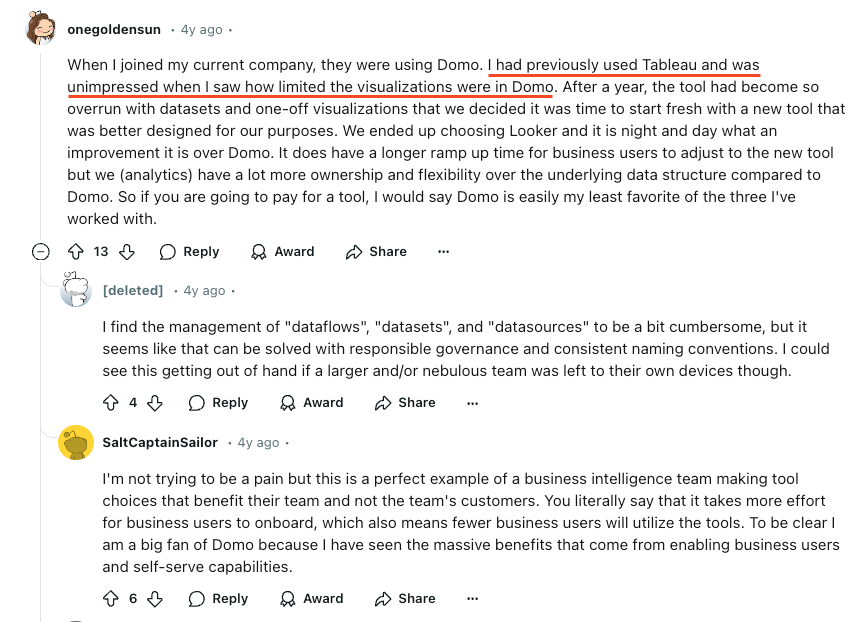
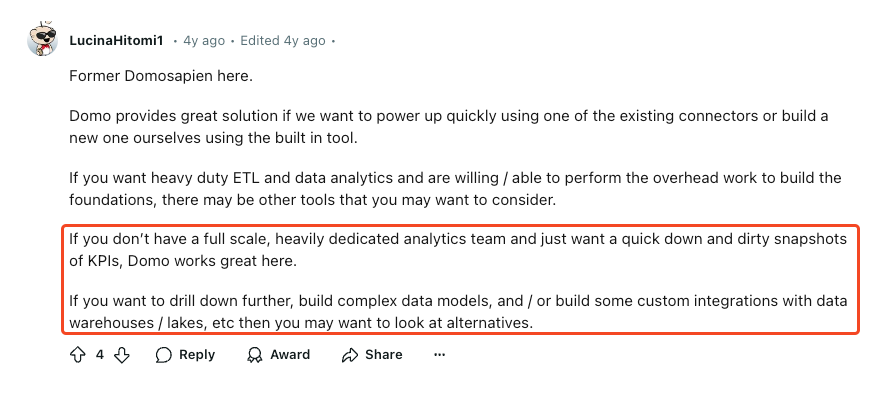
Some users reported that Domo is great for quick data snapshots, and ad-hoc exploration, offering a wide range of visualizations. Yet, for some, Domo’s visualization and customization options are limited when compared to tools like Tableau.
Limited data modeling capabilities
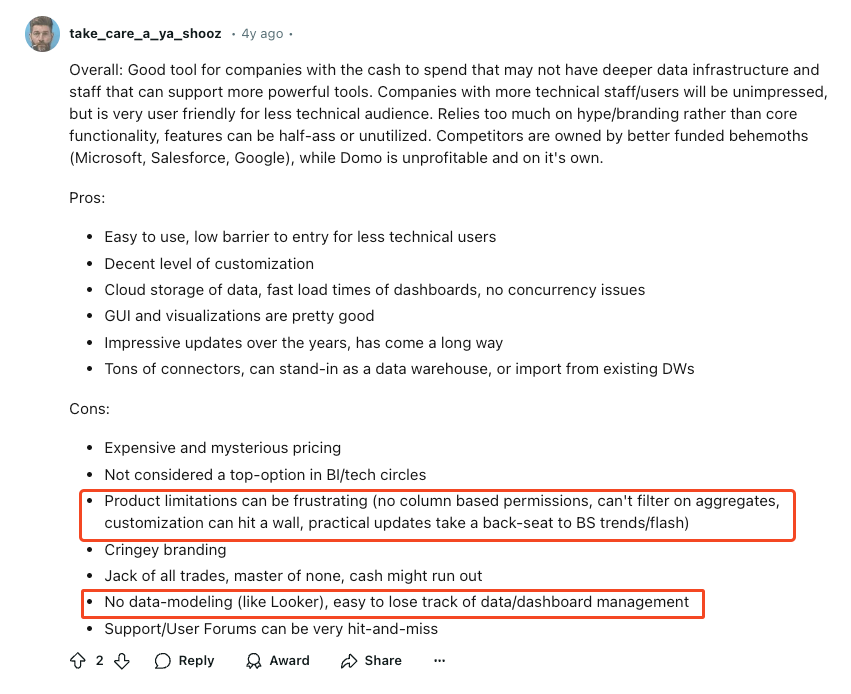
Unlike platforms like Looker, Holistics, or GoodData which offer a semantic modeling layer to unify data definitions, Domo lacks a central place to define reusable metrics. This absence of a semantic layer can lead to inconsistencies across reports, muddying insights and making it challenging to maintain data accuracy as needs evolve. As your teams grow, the inconsistency in metrics can become a real headache, hampering efficient decision-making.
Limited Analytic Capabilities
Advanced analytics can be a struggle with Domo. Users who need to perform complex calculations often find that Domo’s capabilities just don’t measure up. This limitation makes it hard to dig deep into the data for teams that rely on detailed custom calculations for their analysis.
On Reddit, Domo users have voiced their frustration with this constraint, expressing disappointment over the tool’s inability to handle more advanced analytics and calculations.
How To Choose A Domo Alternative
Choosing a new analytics tool can be overwhelming—especially if you’re ready to move away from Domo’s high costs and rigid setup. Here are some of the factors to consider when evaluating the best alternatives to Domo.
1. Transparent and Flexible Pricing
Pricing transparency is essential, especially if you’ve dealt with Domo’s unpredictable costs. Many teams find it challenging to track expenses with Domo, where hidden fees can arise as data needs grow. Look for a tool with straightforward pricing, so you know exactly what you’re paying for, no matter how much you scale.
2. Strong Modeling Capabilities
Data modeling is necessary for ensuring data consistency across reports. Unlike Domo, which lacks a centralized semantic layer, a strong alternative should allow you to define reusable metrics and manage them centrally.
Having a “single source of truth” for key metrics ensures that everyone is working with consistent data, making it easier to align on goals and make informed decisions.
3. Code-Based Governance with Git Version Control
For teams prioritizing governance and scalability, a tool with code-based governance features, like Git version control, is necessary. Domo’s focus on self-service can lead to dashboard sprawl, as users create new datasets and visuals without oversight. With Git-based governance, you can better manage and maintain analytics assets, ensuring clean, organized dashboards that grow with your needs.
10 Best Domo Alternatives To Consider in 2025
If you’re fed up with Domo’s high costs and rigid structure, you’re not alone. Below, we dive into 10 top alternatives, exploring what each brings to the table—and where they might fall short. Whether you’re looking for flexibility, affordability, or better data modeling, there’s an option here for every need.
1. Holistics
Holistics is a self-service BI tool designed with DevOps principles at its core. It enables data teams to define analytics logic, datasets, metrics and dashboards as code, govern with Git version control, and manage them centrally in a code-based semantic layer. This allows analysts to build a single source of truth for the entire organization, ensuring consistent, accurate, and well-governed reports.
Using curated datasets, business users can confidently explore data and create their own reports with an intuitive drag-n-drop builder.
The platform also offers flexible, canvas-based dashboards that analysts can design as code. This approach gives analysts full control over dashboard content and design, enabling easy change governance, bulk updates, and customized, reusable visualizations.
That said, Holistics does have a learning curve, particularly for teams used to traditional SQL-based BI tools. A solid understanding of data modeling concepts is needed to fully leverage its capabilities. While the platform handles most data visualizations effectively, creating highly customized visuals requires familiarity with Vega. Additionally, a few minor UI quirks can occasionally make the experience feel less smooth.
Pricing: Holistics pricing starts from 800$/month.
Compared to Domo, Holistics addresses one of Domo’s biggest limitations by offering a code-based semantic layer that ensures consistent, reusable metrics across reports and dashboards. While Domo might excel in ease of use and collaboration features, Holistics focuses on scalability, flexibility, and governance, making it better suited for teams that value engineering practices and centralized control over their analytics.
2. Looker
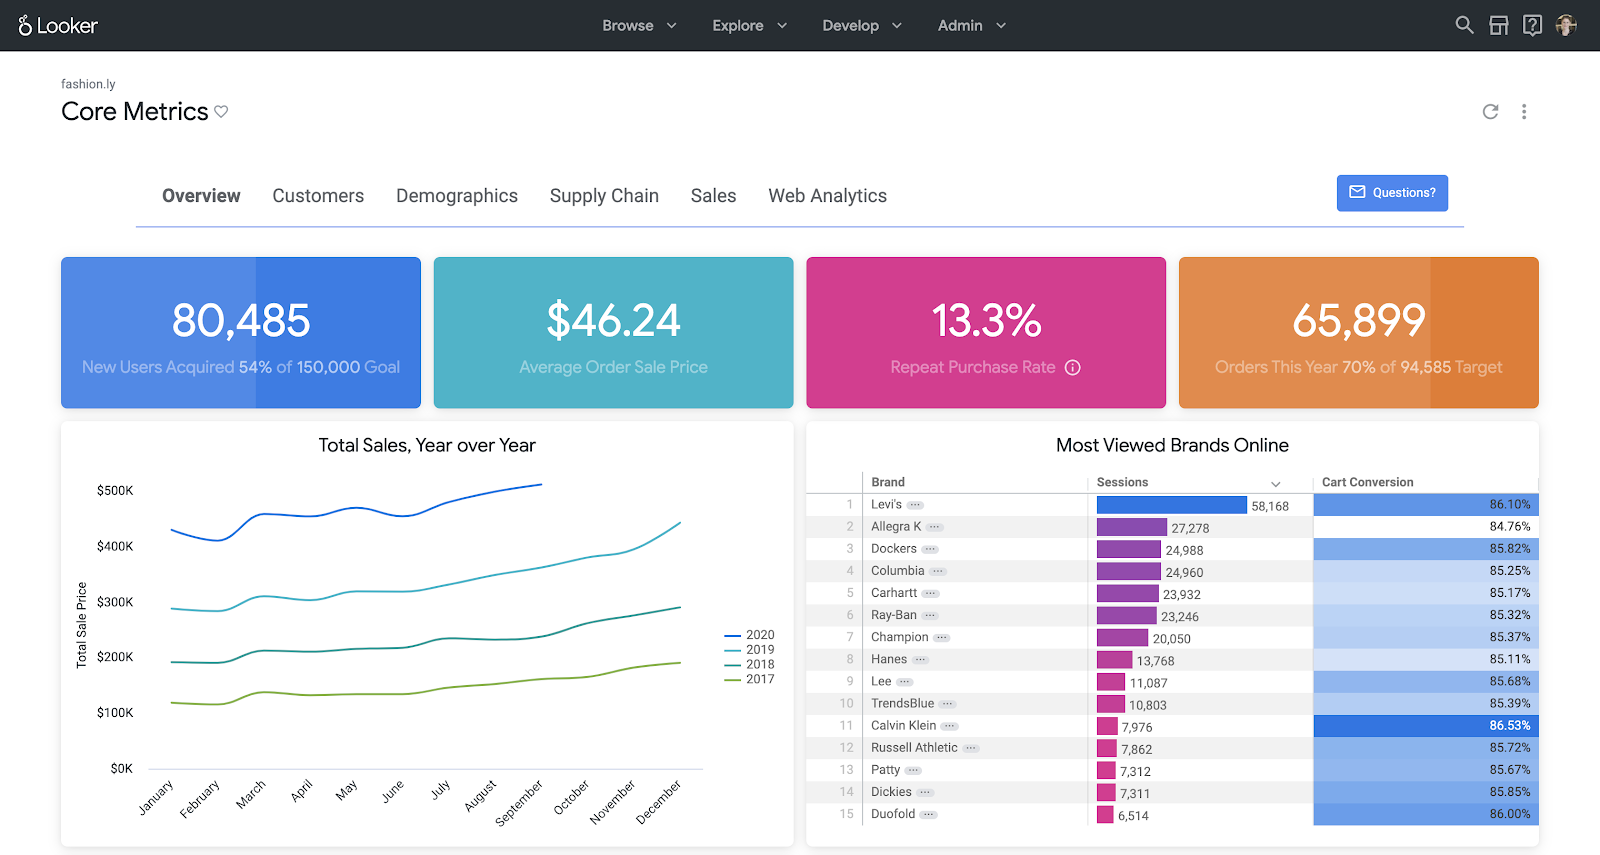
Looker is a governed self-service BI tool, known for its robust semantic layer that lets you define and reuse metrics across dashboards, ensuring consistent data reporting. It also offers an intuitive interface that lets business users explore data and build report themselves.
That said, LookML, Looker’s proprietary modeling language, can be challenging for teams without a technical background in data modeling. It requires significant time and training, which may slow down adoption for teams needing quick insights.
While Looker excels in creating well-structured, reusable data models, its visualization options are surprisingly limited compared to other BI tools. If you’re looking for highly customizable, modern, or interactive visuals, Looker may leave you wanting more. Another point of concern is Looker’s pace of product development. After its acquisition by Google, updates to the platform have been slowed down significantly.
Pricing: Looker’s pricing, starting around $3,500/month, is also prohibitive for smaller companies or teams with limited budgets.
Compared to Domo, Looker addresses one of Domo’s biggest limitations by providing a centralized semantic layer that allows for consistent, reusable metrics across dashboards. However, both Looker and Domo are high-cost solutions, making them more suitable for enterprises rather than smaller teams. Looker’s technical learning curve with LookML makes it better suited for teams with dedicated data engineers, while Domo’s easier interface is a better match for non-technical users needing faster deployment.
3. Power BI
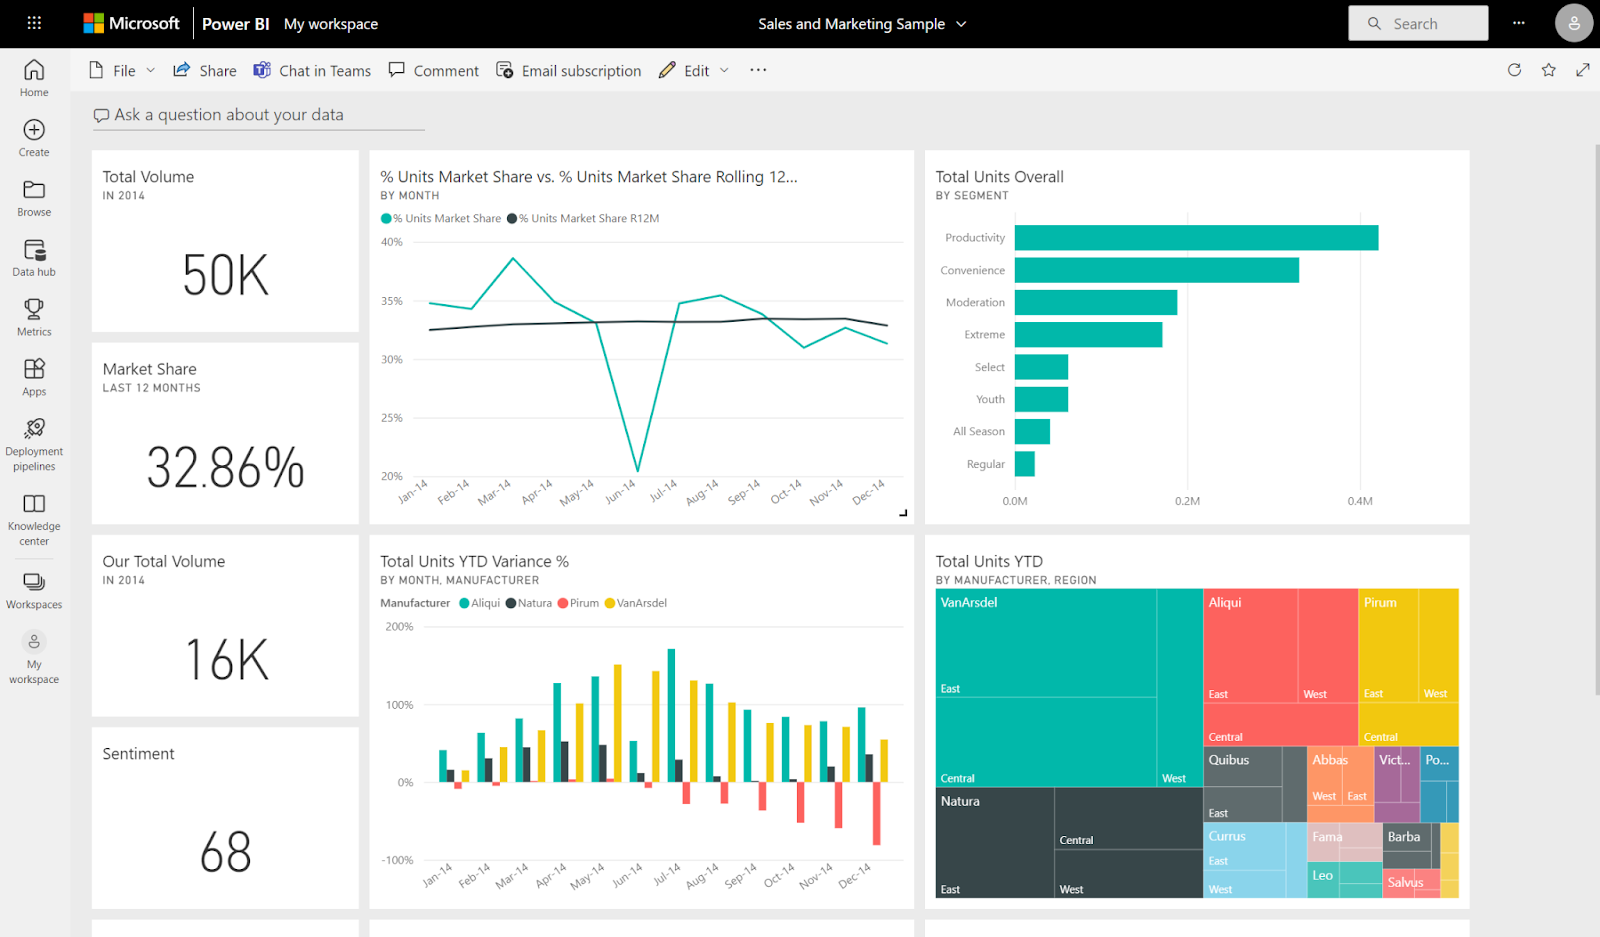
Power BI offers extensive visualization options and integrates seamlessly with the Microsoft ecosystem, making it an ideal choice for organizations already using Azure, Microsoft 365, or other Microsoft products. It also offers powerful data modeling and transformation tools - Power Query to streamline data cleaning and preparation and DAX (Data Analysis Expressions) to support advanced calculations for deeper analysis.
That said, you might face the following problems when using Power BI
- Heavily Microsoft-Centric: PowerBI is not compatible with non-Microsoft operating systems like Linux or MacOS, and users can’t create reports or perform data analysis without installing PowerBI on their computers.
- No Git Version Control: PowerBI’s workflow is not designed to have code checked into the Git repository, making it difficult to manage changes, perform code branching, and maintain the accuracy of analytics logic.
- Steep Learning Curve: PowerBI’s DAX is powerful, but it can be challenging to learn for both technical and non-technical users which can further limit self-serve data exploration and dampen analysts’ productivity.
Pricing: Starts at $9.99 per user per month for the Pro version, with higher-tier options available.
When compared to Domo, Power BI is a more attractive, cost-effective alternative especially for companies already using Microsoft tools. Its affordability makes it accessible for smaller teams, whereas Domo’s pricing structure often surprises users with add-ons and hidden costs.
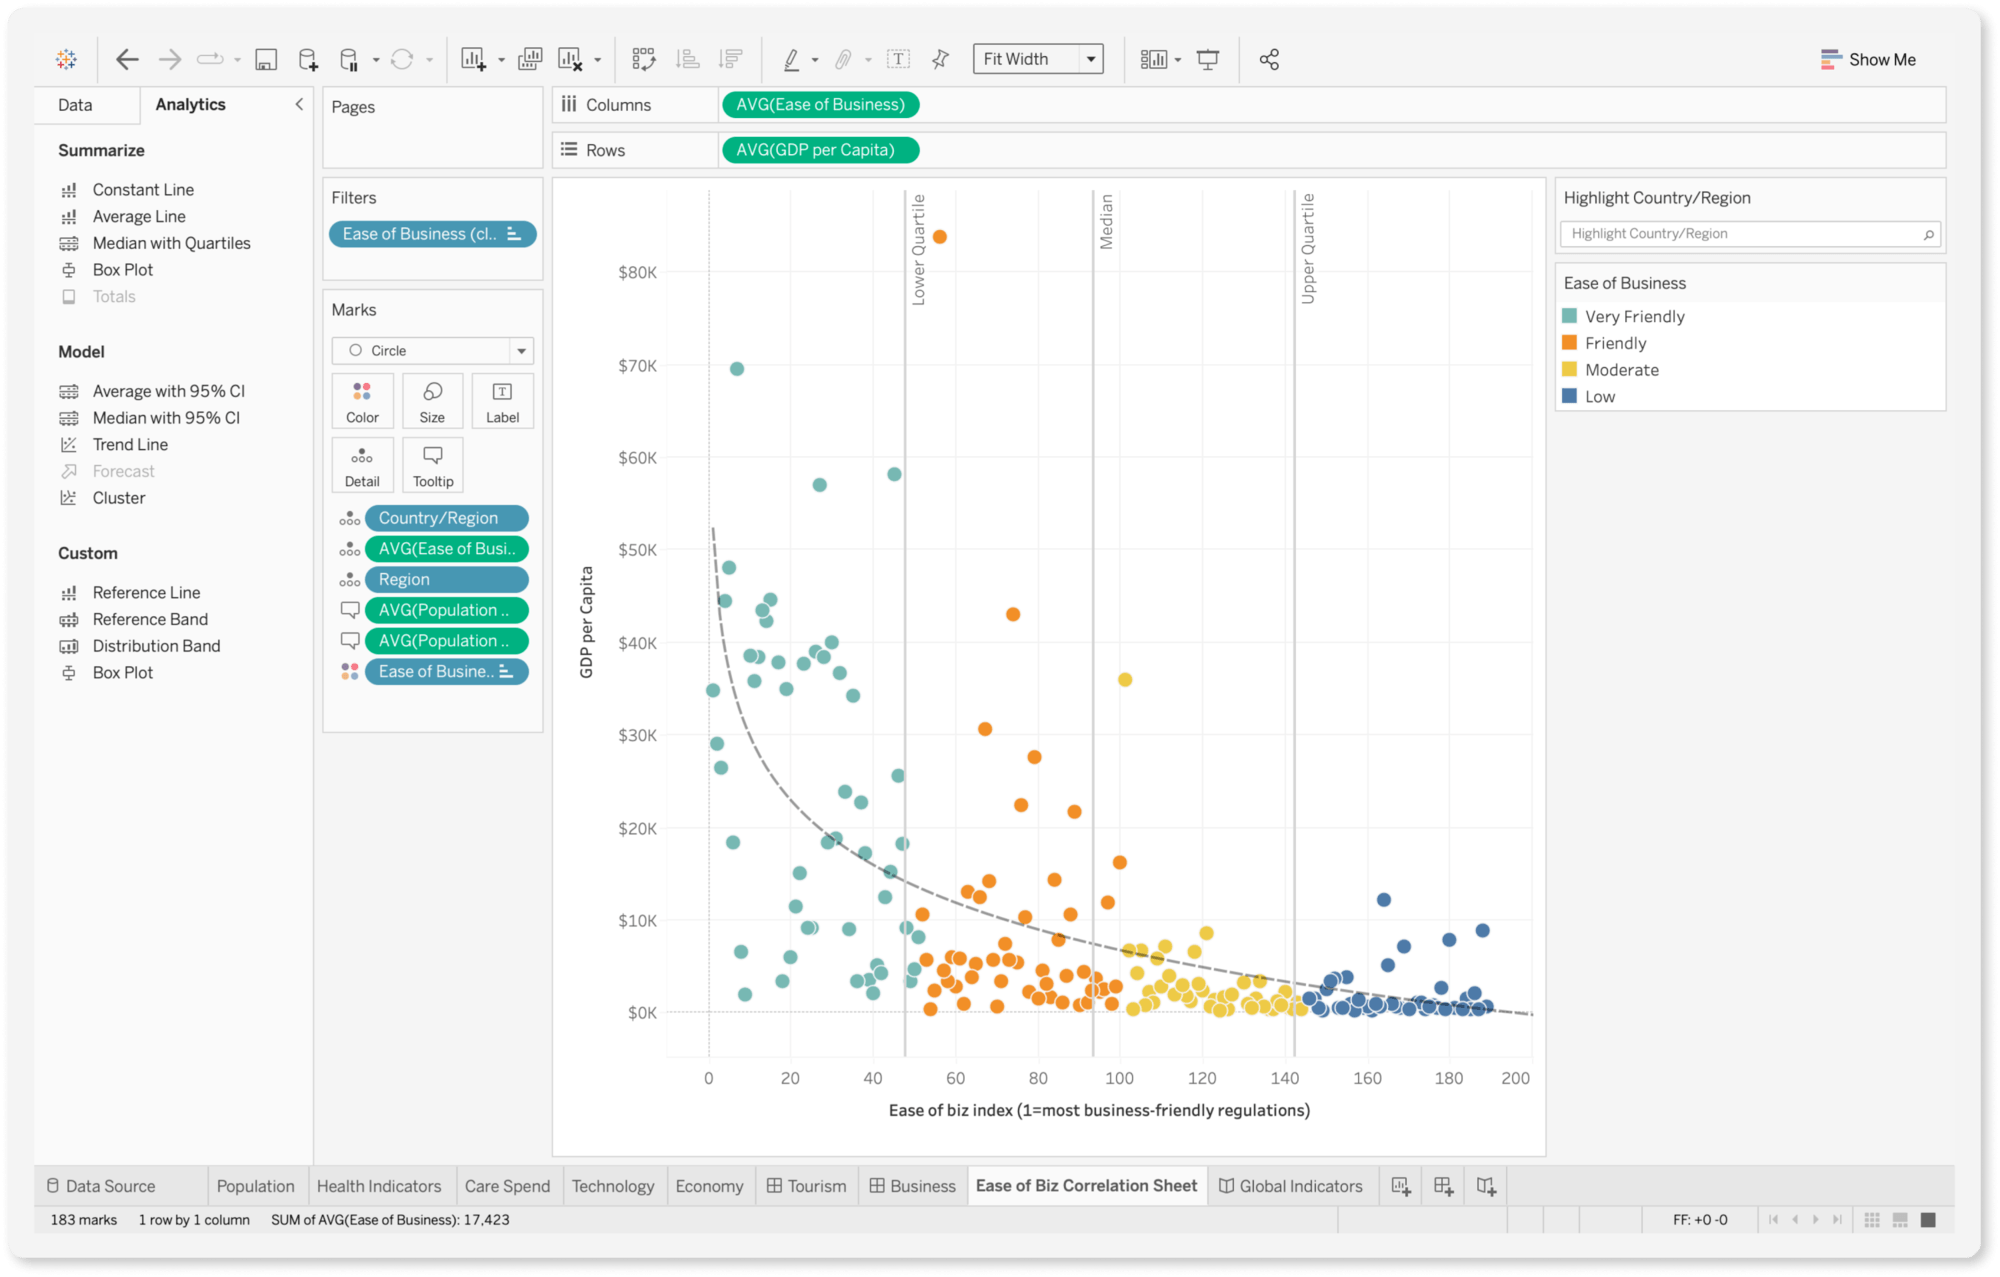
4. Tableau
Tableau is known for its stunning visualizations and extensive customization, making it a favorite for creating detailed, interactive dashboards. It also supports numerous data connectors and has strong data preparation capabilities.
That said, while its visualization capabilities are excellent, its data modeling functionality is limited compared to Looker, which may pose challenges for teams that rely on centralized metrics. Additionally, Tableau’s self-service capabilities are limited as it doesn’t allow business users to customize their own setup of dimensions and metrics in the reports they want, causing frustration for users who don’t know SQL but still need to explore data beyond pre-defined views in Tableau.
Pricing: Starts at $70 per user per month for Tableau Creator, with additional costs for specific tools and add-ons.
When compared to Domo, Tableau’s visual customization is a standout feature, allowing teams to build highly interactive, detailed dashboards. However, its more complex setup makes it more suited to teams with the resources for extensive training.
Domo, in contrast, provides a more user-friendly experience with less training required, although it lacks Tableau’s advanced customization. For teams prioritizing aesthetic and interactive dashboards, Tableau is a top choice; for quick and simple analytics, Domo is easier to implement.
5. Qlik
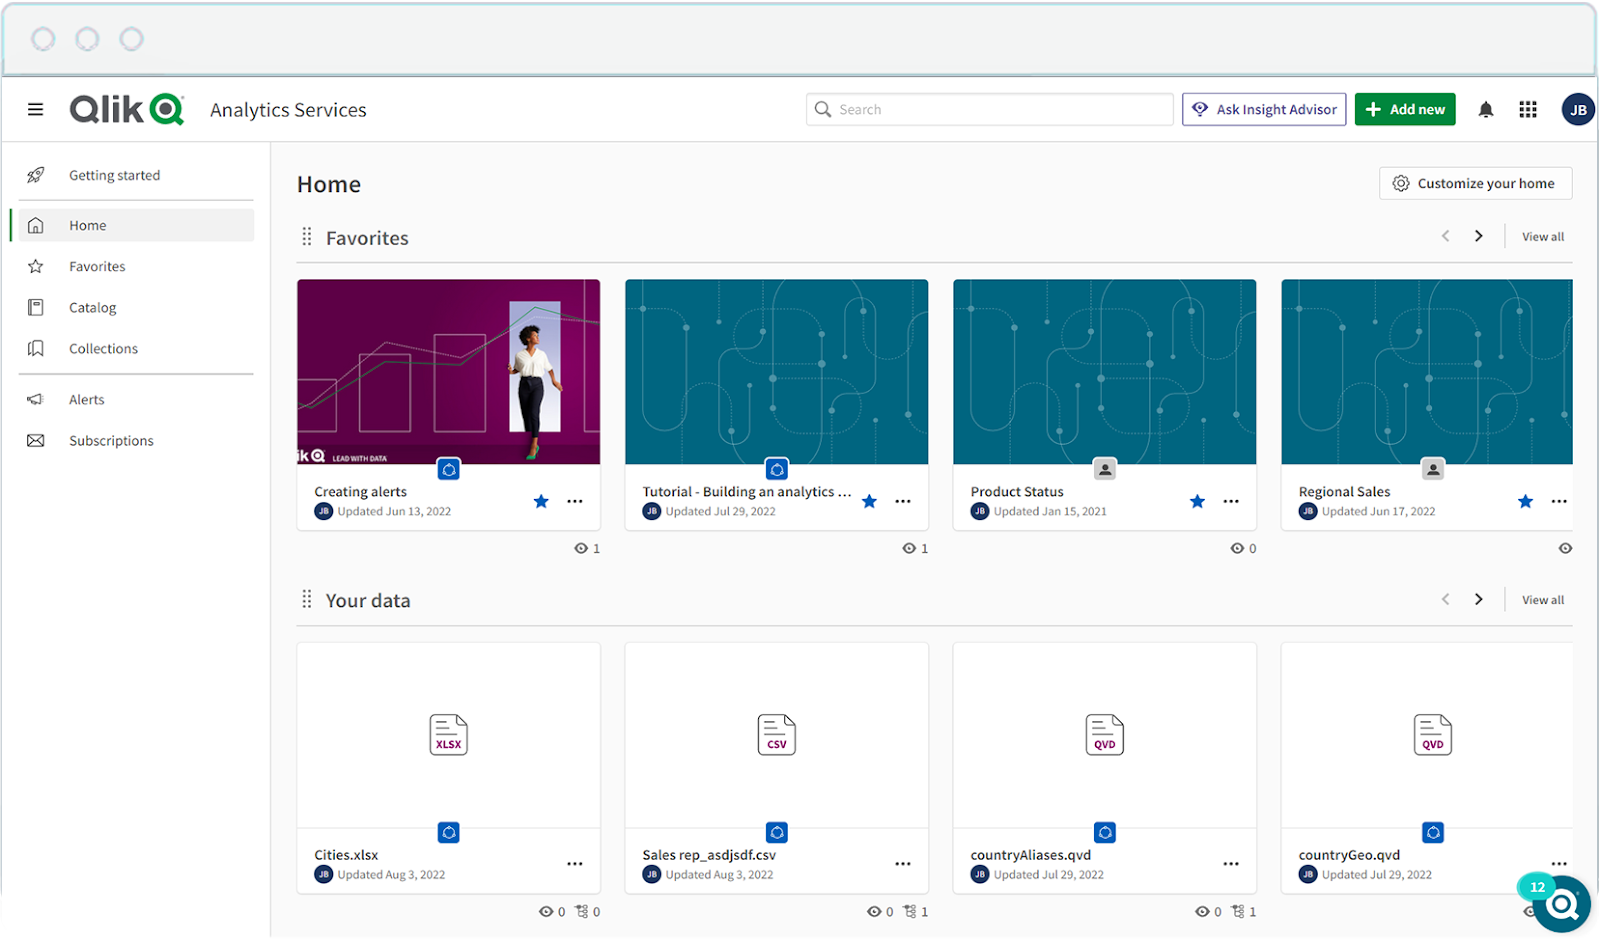
Qlik is known for its data engine, allowing users to explore data intuitively across multiple data sources. Qlik also supports advanced customization, making it suitable for data-driven storytelling and complex analyses.
That said, Qlik’s associative data engine comes with a steep learning curve that can be challenging for users without a technical background. Many users report that Qlik’s setup is time-intensive and resource-heavy, particularly for large-scale deployments. Furthermore, Qlik’s complex interface can feel unintuitive for new users, and some teams find that they need ongoing training to fully leverage its capabilities.
Pricing: Starts at $30 per user per month, with additional costs for enterprise features.
When compared to Domo, Qlik is excellent for advanced data exploration, allowing for more interactive analysis than Domo. However, its complex setup and interface mean that Domo is a better choice for beginners or teams without a dedicated data team. Qlik provides deeper analytic capabilities, making it ideal for experienced teams in need of comprehensive data exploration, while Domo’s ease of use is better suited for quick adoption and immediate insights.
6. Sisense
If you’re evaluating embedded BI platforms, you probably hear about Sisense. Sisense has a strong embedded offering, tailored for developers with robust APIs and extensive customization options. This makes it perfect for companies that want control over the back-end and front-end design of their analytics setup.
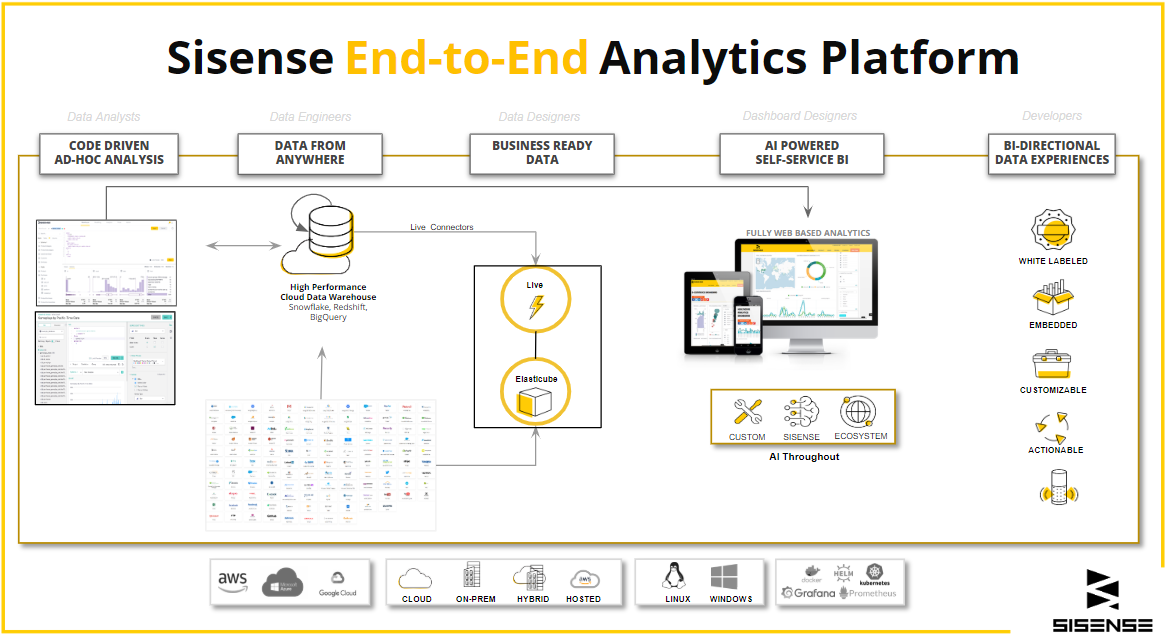
That said, Sisense’s data modeling interface is frequently criticized for being cluttered and unintuitive, making it challenging to understand table relationships. Users also often express frustration with limited layout flexibility and a lack of easy customization options.
Support and documentation leave much to be desired compared to other BI tools. Many resources are outdated, and the smaller community makes finding solutions harder, especially when compared to the robust user bases of tools like Tableau or Power BI. Pricing is another sticking point, with vague structures and costs that are often higher than similar tools and on par with Domo.
Pricing: Custom pricing, generally mid-to-high range depending on the setup and scale of implementation. Learn more: Sisense Pricing.
When compared to Domo, Sisense offers greater flexibility for teams looking to create branded, embedded analytics solutions, while Domo is more focused on ease of use. Sisense’s API capabilities and customization make it ideal for developer-led teams, but Domo’s faster setup and ease of use make it more accessible for teams without technical resources. For those needing full control over their analytics experience, Sisense is a robust choice; Domo is a simpler alternative for teams seeking plug-and-play functionality.
7. ThoughtSpot
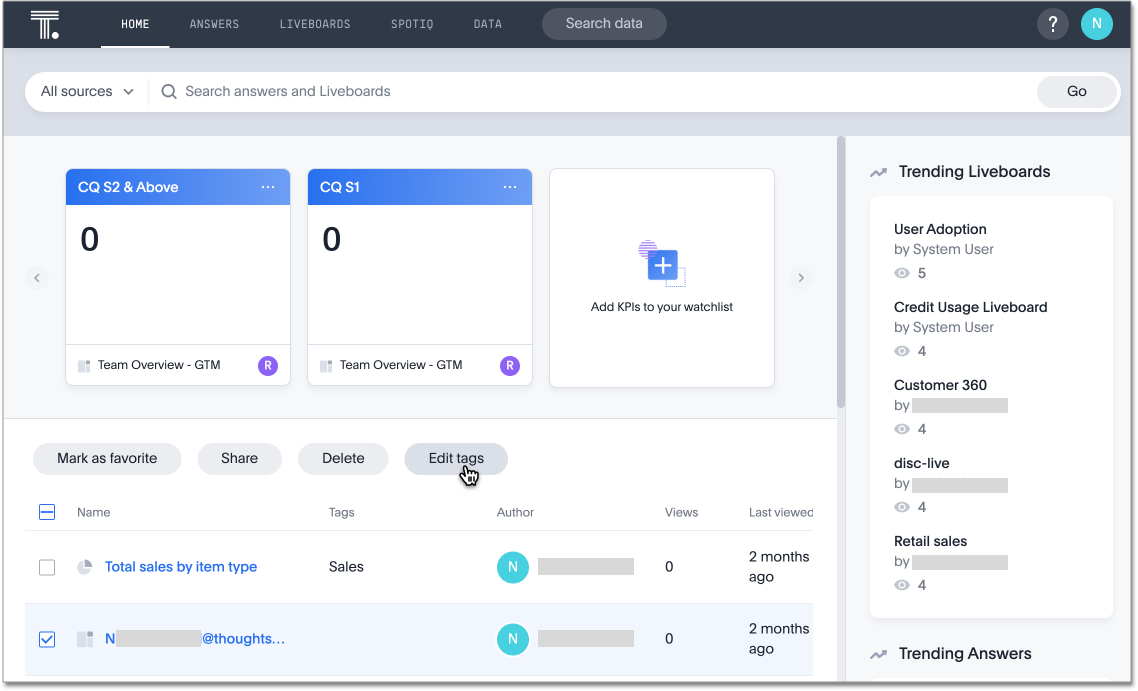
ThoughtSpot is a leader in AI-driven analytics, offering features like SpotIQ for automated insights and data storytelling, ThoughtSpot has a user-friendly experience for natural language querying (NLQ). Its AI capabilities, powered by GPT-4 and Google Gemini, provide personalized suggestions and self-learning, making analytics more intuitive.
Despite its strengths, ThoughtSpot has limitations. While the search functionality is powerful, ThoughtSpot has limited customization options, especially for teams that want branded dashboards or unique visualizations. Its heavy reliance on AI also means that users may sometimes find unexpected or overly broad results, especially if the data isn’t well-structured. Additionally, ThoughtSpot’s premium pricing can be a barrier for smaller teams.
Pricing: Premium pricing with enterprise plans available upon request, generally considered on the higher end.
When compared to Domo, ThoughtSpot is a better option for teams prioritizing self-service analytics, as its natural language search makes data accessible to non-technical users. ThoughtSpot’s focus on AI-driven insights may appeal to organizations seeking quick, searchable data exploration, while Domo’s templated setup is better suited for those needing consistency in visual presentation across reports.
8. GoodData
GoodData stands out for its headless vision, focusing on centralized metrics stores that ensure consistency in metric definitions and alignment with business objectives. Its integrations with data pipeline companies and other analytics vendors position it as a neutral player in the evolving metrics layer market.
GoodData also embraces a composability-first focus, adhering to the analytics-as-code philosophy. This allows seamless integration of analytics development into application development workflows, supporting automation and scaling as data operations grow in complexity. Additionally, GoodData stands out for its robust embedded analytics offering.
That said, GoodData caters primarily to mature buyers, requiring strong data engineering and governance capabilities to unlock its full potential. For less experienced teams, this steep learning curve might pose challenges. GoodData’s strength lies in its composable and headless BI solutions, but it is less effective for traditional ABI use cases, making it less suitable for organizations with legacy analytics needs. Users looking for extensive design control may find GoodData lacking compared to visualization-focused tools like Tableau. Additionally, some users report that GoodData’s learning curve is steep, particularly for those new to BI.
Pricing: Subscription-based, generally mid-range with flexible plans that cater to different organizational sizes.
When compared to Domo, GoodData’s transparent pricing and multi-tenant support make it a strong choice for organizations needing scalability across multiple clients or departments. Domo’s opaque pricing model and limited multi-tenant capabilities are often drawbacks for organizations with diverse analytics needs. However, Domo’s built-in templates and visual options may be preferable for teams focused on simplicity in design, whereas GoodData’s strengths lie in its scalable, data-driven environments.
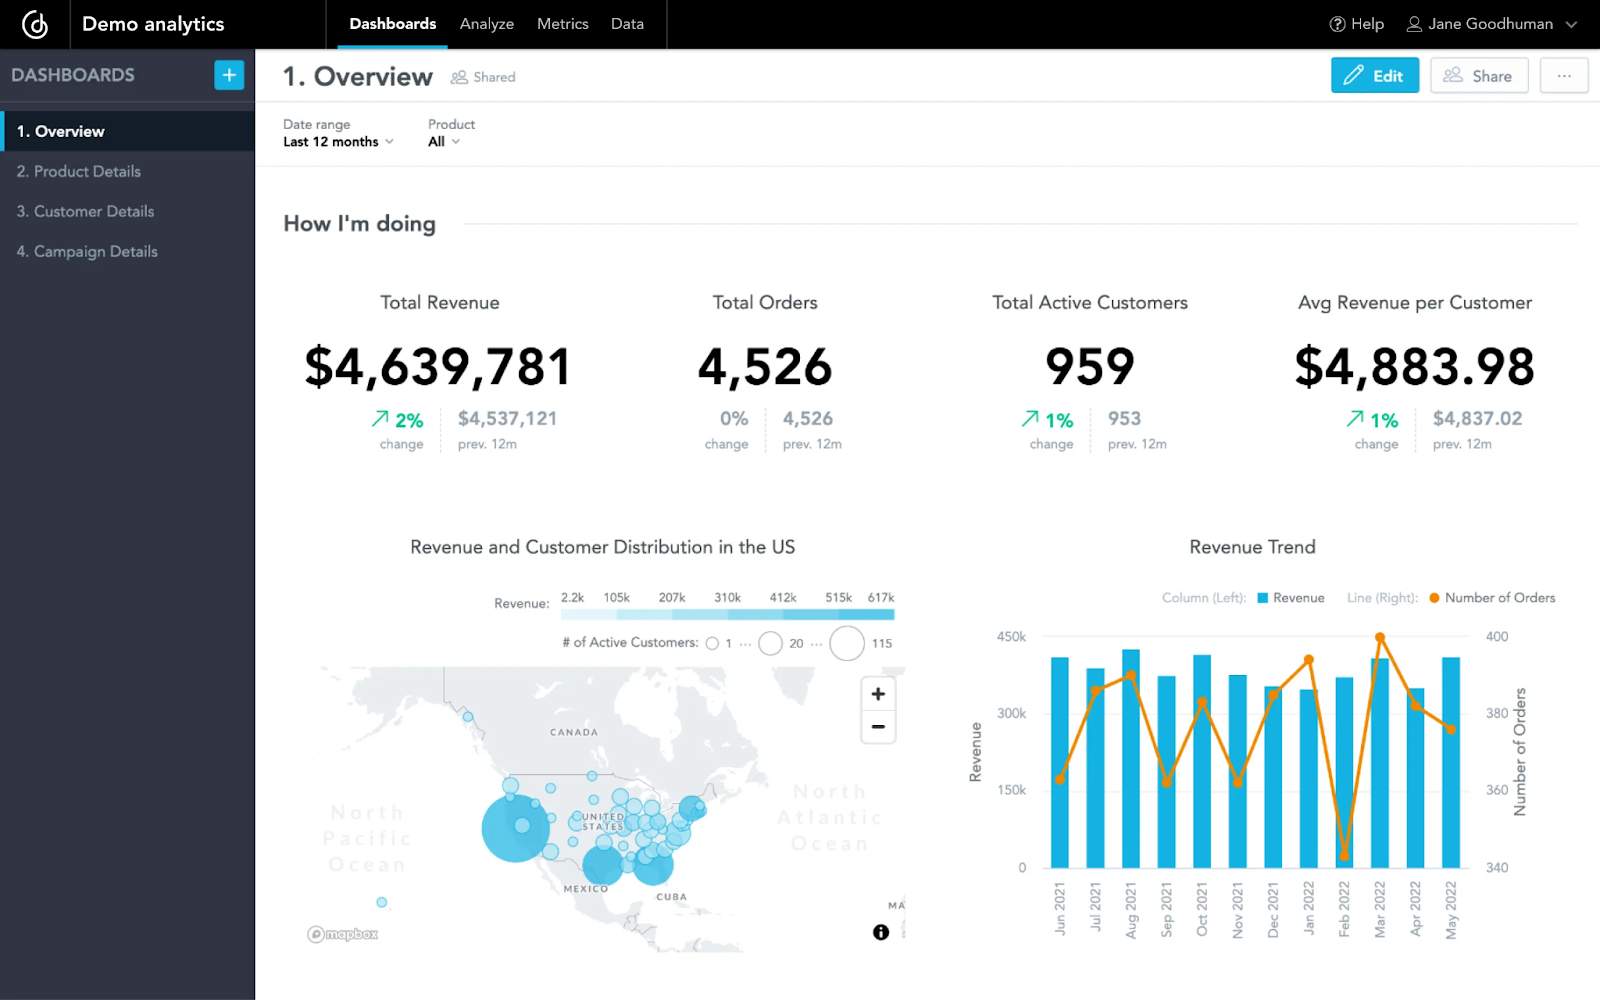
9. Metabase
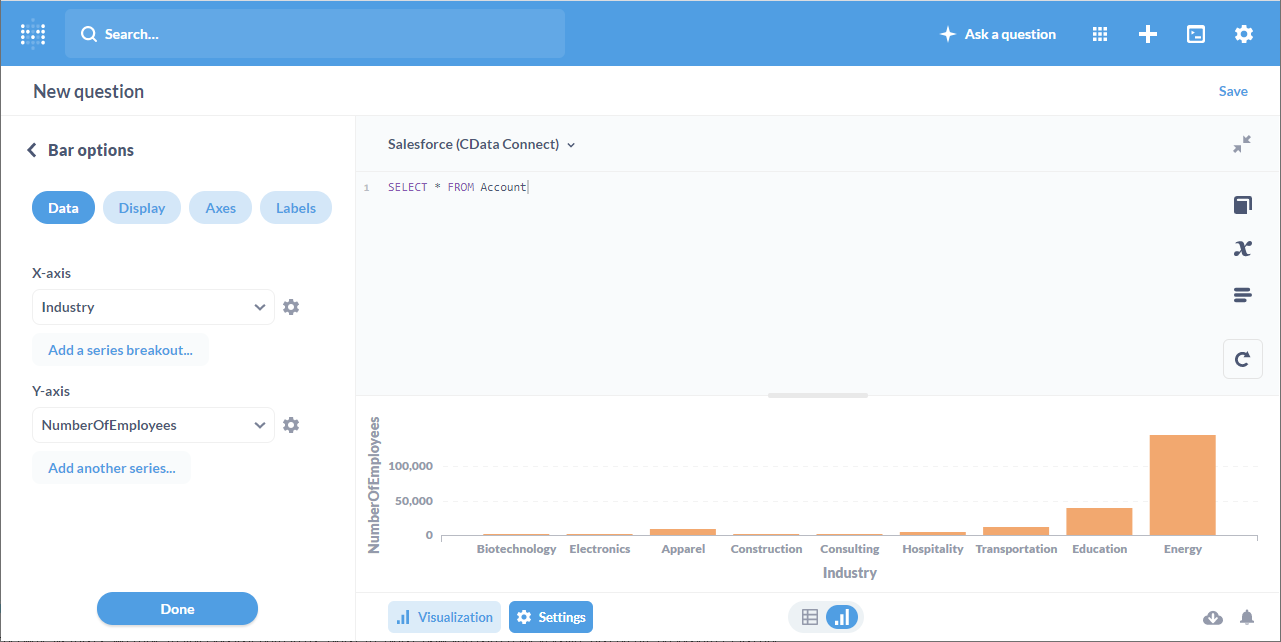
Metabase is a popular open-source BI tool, offering basic analytics features with an easy-to-use interface and solid embedded analytics capabilities. Its SQL-based querying and straightforward dashboards make it a great fit for smaller teams or startups looking for affordable analytics without the headache of heavy customization.
Metabase’s open-source, SQL-centric approach is ideal for smaller teams, but it lacks the scalability and advanced features required by more mature data teams. Its open-source, SQL-first design works well for lightweight use cases, but when it comes to complex data models or handling large datasets, performance can take a hit. And here’s the kicker—Metabase doesn’t have code-based version control. So as your team grows, you might find yourself in a game of "Who broke the dashboard?" as tracking changes becomes a messy, time-consuming challenge.
Pricing: Free for the community version, with enterprise subscription options available for added features and support.
When compared to Domo, Metabase is a cost-effective, open-source alternative to Domo, making it attractive to startups and small teams needing simple analytics. However, Domo offers greater scalability, richer data integration, and more comprehensive visualization options. For basic reporting and SQL-driven queries, Metabase is an affordable choice; for more extensive analytics needs, Domo provides a more feature-rich environment better suited to larger teams.
10. Redash
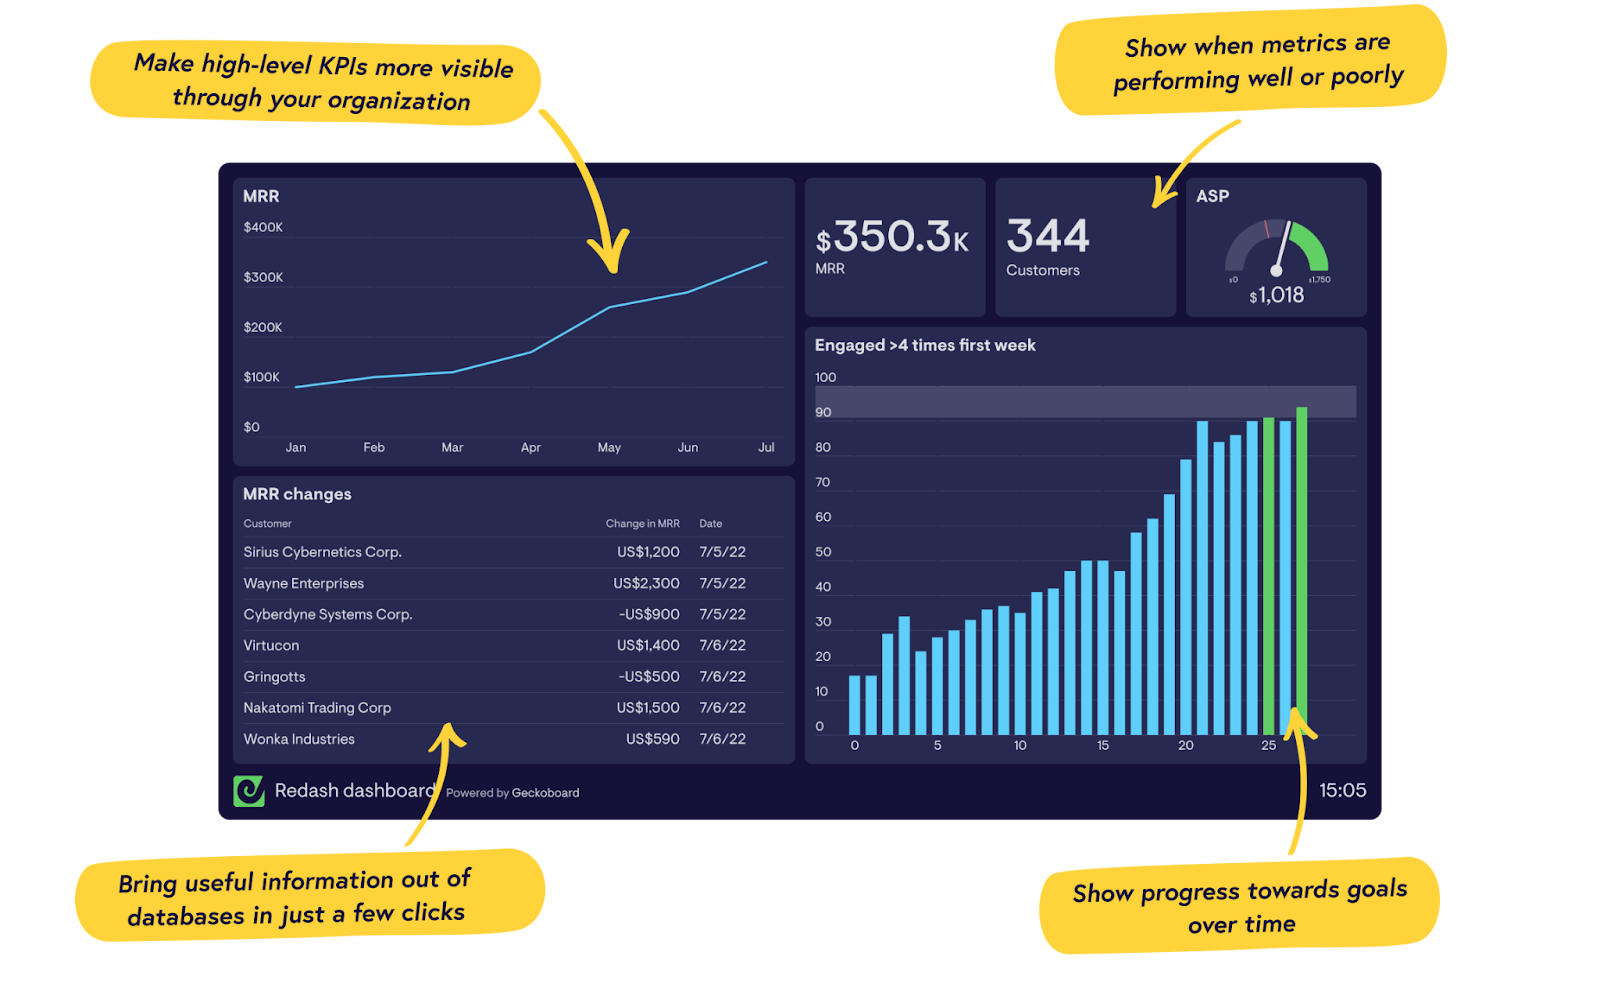
Redash is a SQL-centric tool that allows users to connect directly to their databases and create simple, straightforward dashboards. It’s ideal for teams that need quick, SQL-driven insights without extensive BI features, making it popular for small teams and data engineers who want to query data quickly.
That being said, Redash’s straightforward SQL-centric design works well for smaller teams, but its limitations become apparent with larger, more complex data needs. Redash lacks the scalability, extensive visualization options, and advanced analytics features that larger teams often require. Additionally, support is minimal unless users opt for the paid, hosted version, which can be limiting for those needing assistance with setup or troubleshooting.
Pricing: Free for open-source; paid plans available for the hosted cloud version.
When compared to Domo, Redash is an excellent choice for SQL-savvy teams that need quick insights without the complexity of a full BI platform. Its minimalistic design is suitable for small teams, while Domo offers a broader range of data integrations, visualization options, and scalability. For agile teams needing simplicity and SQL-driven dashboards, Redash is ideal; Domo, on the other hand, caters to organizations requiring a comprehensive BI toolkit that supports complex, multi-department analytics.
Conclusion
If you’ve experienced the frustrations of working with Domo, you already know how critical it is to find a platform that genuinely works for your team, from flexibility to upfront pricing.
Today, there are options that don’t compromise on value. Looker offers serious data modeling power, ideal if you’re looking to keep your analytics process organized and consistent.
Power BI has been a favorite for Microsoft users because of its affordability and seamless integration with the Office suite. On the other hand, Sisense gives you the freedom to tailor your dashboards and analytics deeply—a solid choice for developers who need custom solutions.
Holistics steps in as an all-around solution that keeps things straightforward. It doesn’t just provide data access; it offers a robust semantic layer, so your metrics are consistent across every report and dashboard, without confusing discrepancies.
If Domo’s unpredictable costs and limits on customization have been roadblocks, Holistics is designed to remove those barriers, letting your team run analytics in a way that feels intuitive, affordable, and reliable.
Analytics today is about giving teams the power to ask questions and instantly get insights. Holistics understands the need for independence. Why not give it a try? You can start a free trial to experience a smoother, more transparent approach to analytics—one that empowers your team to go from data to action without the usual hurdles.
What's happening in the BI world?
Join 30k+ people to get insights from BI practitioners around the globe. In your inbox. Every week. Learn more
No spam, ever. We respect your email privacy. Unsubscribe anytime.
