DataOps: Framework, Tools, Platforms, and Everything In Between
When you hear DataOps, the first thing that comes to mind is most likely DevOps for data analytics. And while that is not entirely inaccurate because it adopts some principles from DevOps, they are two different things. So, we will explain the differences between these two.
But first, let us understand what DataOps is and why we need it.
I. What Is DataOps?
Before we explain what DataOps is, let us briefly dive into what led to the rise of DataOps. With more companies increasingly focusing on data, they need their data teams to keep up. Here are some of the problems that brought about the need for DataOps:
- The big data era brought about large volumes of diverse data from many different sources. Handling this complex data and making sense of it is a tedious process.
- This data needs to be transformed through a series of processes before the business can use it. Data governance - the quality, integrity, and privacy of the data - is also necessary. These processes require different tools that can lead to technology overload and productivity loss.
- People with different roles and skillsets need to work on the data using multiple procedures and technologies before it becomes useful. This could lead to collaboration problems that slow down processes.
These problems slow down productivity and could limit the value that data should give. Hence, the need for DataOps.
In 2015, Andy Palmer, who is associated with the origin of the term ‘DataOps,’ defined it as “a data management method that emphasizes communication, collaboration, integration, automation, and measurement of cooperation between data engineers, data scientists, and other data professionals."
Let us take a look at the process of delivering value from data before DataOps:
- The business needs data and meets the IT team. IT then tries to add said data from whatever source into the data warehouse before it can be used for any analytics. This process can be slow without tools that apply DataOps concepts. And slow processes mean the business has to wait. The result is unhappy customers, and nobody wants that.
The whole purpose of DataOps is to deliver quality data and analytics to businesses faster using new tools and technology.
There needs to be a continuous integration from various sources and faster delivery to the businesses. The process should be flexible to accommodate changes, and the data needs to be trusted and secure.
There are three parties involved in this: people, process, and technology. The people are the data team and the business, the process based on company needs, and the technology are the tools that help you achieve the goals. This is where the modern data stack comes in with tools that help to automate continuous data integration, extraction, transformation, loading, and analytics. The DataOps framework provides end-to-end observability that helps data teams achieve better performance across their modern data stack.
So how do you know if your business needs DataOps? Let us start with these questions:
- Are you able to keep up with the data demand rate of the business?
- Is your data integration process flexible enough to accommodate more sources?
- Are your data pipelines providing continuous data?
- How secure are your processes to ensure data integrity and privacy?
These are some of the questions you should consider to know whether it is time to switch up.
II. DataOps Framework and Principles
The DataOps framework consists of artificial intelligence and data management tools and technologies, an architecture that supports continuous innovation, collaboration among the data and engineering teams, and an effective feedback loop. To achieve these, DataOps combines concepts from Agile methodology, DevOps, and Lean manufacturing. Let us look at how these concepts relate to the DataOps framework.
01. Agile Methodology
This methodology is a project management principle commonly seen in software development. Using agile development, data teams can deliver on analytics tasks in sprints - short repeatable periods. By applying this principle to DataOps, data teams can produce more value much quicker because they can reassess their priorities after each sprint and adjust them based on business needs. This is especially useful in environments where the requirements are constantly changing.
02. DevOps
DevOps is a set of practices used in software development that shortens the application development and deployment life cycle to deliver value faster. It involves collaboration between the development and IT operations teams to automate software deployments, from code to execution. But while DevOps involves two technical teams, DataOps involves diverse technical and business teams, making the process more complicated. Companies can apply DevOps principles to DataOps and its multiple analytics pipelines to make processes faster, easier, and more collaborative.
03. Lean manufacturing
Another component of the DataOps framework is lean manufacturing, a method of maximizing productivity and minimizing waste. Although commonly used in manufacturing operations, it can be applied to data pipelines - the “manufacturing” side of data analytics.
One lean manufacturing tool that DataOps adopts is the statistical process control (SPC). It measures the data pipelines in real-time to monitor and ensure the quality leading to better quality and increased efficiency. This control process involves a series of automated tests to check for completeness, accuracy, conformity, and consistency.
With lean manufacturing, data engineers can spend less time fixing pipeline problems.
The DataOps Manifesto and Principles
DataKitchen, a leading DataOps company, put together an 18-principles Manifesto that is also in line with our philosophy at Holistics. Here's how you can implement DataOps properly.
1. Continually Satisfy Your Customer: Fulfilling all your customers’ analytics needs must always be the top priority
2. Value Working Analytics: It’s not just enough to deliver analytics; they should also be valuable, insightful, and accurate
3. Embrace Change: This is one of the reasons for the agile methodology adoption in DataOps. Change is constant, customer needs evolve, and we should embrace and adapt to these changes
4. It’s a Team Sport: Most data teams comprise people with different roles, skill sets, and backgrounds who should work together, as opposed to silos, to increase productivity. This is often referred to as the principle of flow, which emphasize the performance of the entire system, as opposed to the performance of a specific silo of work or department.
For example, let's take a look at 02 primary problems:
- Silos between data engineering, data analysts, data scientists and business users
- Inconsistent knowledge and skillset
Following the principle of flow, the solution space might look like this:
- Self-service for business
- APIs and hooks that allows each part of the process to communicate with the rest
- Data pipeline + automated data delivery make the whole workflow automated and repeatable
- Time taken for each part of the pipeline is recorded for later analysis to find bottleneck and friction
5. Daily Interactions: It is necessary for all parties - the data team, operations, and the business - to work together and be in constant communication
6. Self-Organize: When teams are responsible for their actions, they produce the better results
7. Reduce Heroism: Analytic teams make sure that there is no heroism within the team to achieve sustainability in the long run
8. Reflect: The internal team at Holistics refers to this as the principle of feedback. Analytic teams should always amplify feedback loops and reflect on all feedback - concerns or improvements - to improve the system. In line with this, Holistic’s data delivery product focuses on getting the right insights to all stakeholders and effectively receiving feedback.
9. Analytics is Code: Analytic teams use a variety of individual tools to access, integrate, model, and visualize data. Fundamentally, each of these tools generates code and configuration which describes the actions taken upon data to deliver insight.
10. Orchestrate: Analytic success is dependent on the end-to-end orchestration of people and processes
11. Make it Reproducible: The importance of version control in analytics - data, configurations, tools - is essential in creating reproducible results
12. Disposable Environments: Members of the analytic team should have disposable technical environments similar to the production environment where they can freely work, learn, and experiment. This principle allows for continual learning and experimentation which is necessary for innovation to happen. It helps teams learn from their experiments and also master skills that require repetition and practice.
For example, let's take a look at 02 primary data problems related to this principle:
- No central place for everyone to learn about data definition
- Hard to experiment without a personal workspace
Following this principle, here's how the solution space looks like:
- Personal workspace for business users and analysts
- Centralized data wiki with powerful search function to allow for self-discovery and learning
- Analytics as code and Git integration that allow all parts of the system to be stored in a Github repository
- Integrated Git branching workflow
13. Simplicity: Simplicity, one of the agile principles, is the art of maximizing the amount of work not done. It is essential to keep on looking for possibilities of improvement, however little
14. Analytics in Manufacturing: Data pipelines are functionally similar to lean manufacturing lines, and DataOps always focuses on making this process as efficient as possible
15. Quality is Paramount: Good analytic pipelines should be able to detect inconsistencies and security issues in data, code, and configurations while providing continuous feedback
16. Monitor Quality and Performance: All processes involved in analytics should be monitored constantly to detect and fix errors quickly
17. Re-use: A crucial aspect of achieving efficiency in analytic insight manufacturing is to re-use, where applicable and as much as possible, a team member’s previous work
18. Improve Cycle Times: In working towards giving customers the best analytic value within the shortest possible time, we should minimize time and effort by creating repeatable processes and re-usable products
III. Top 10 DataOps Tools
There are different kinds of DataOps tools that serve various purposes. The all-in-one tools provide end-to-end DataOps services - data ingestion, transformation, governance, monitoring, and visualization. There are also Orchestration tools that allow businesses to manage automated data tasks to create workflows across data pipelines. Case-Specific tools are designed to focus on certain DataOps processes.
Some of the best DataOps tools are:
01. Composable.ai
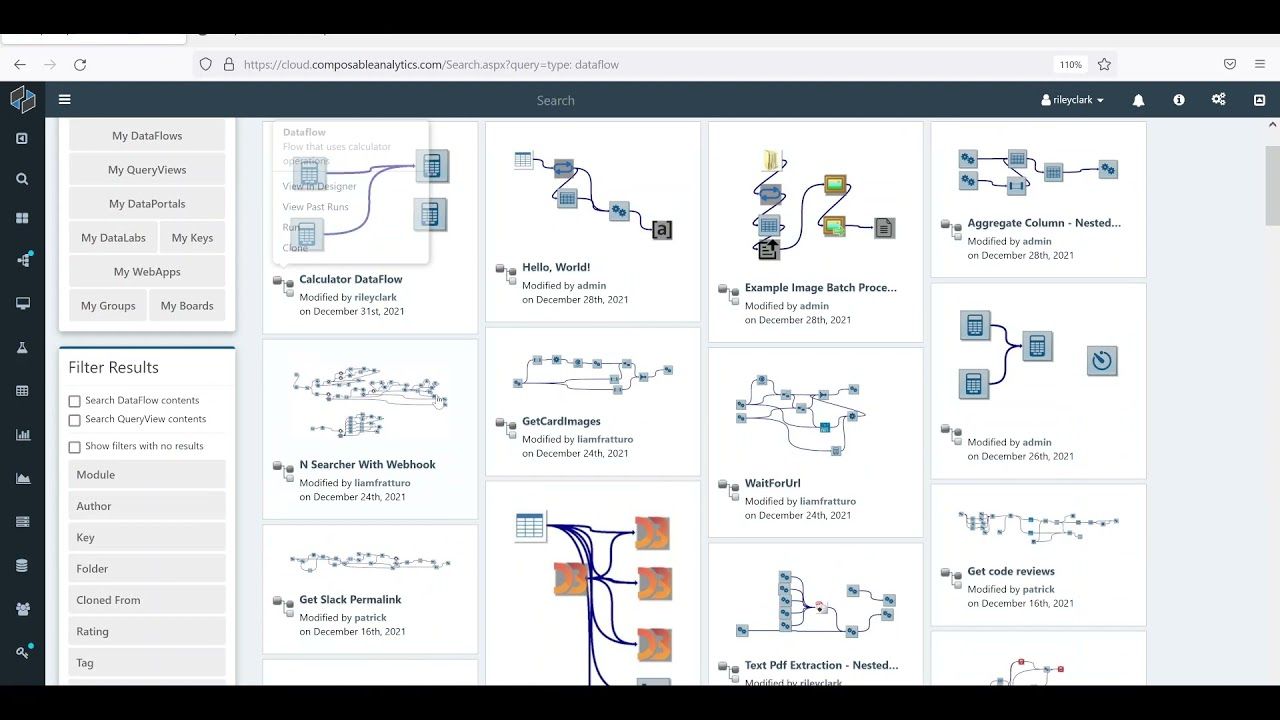
Composable DataOps is an Analytics-as-a-Service platform that provides an end-to-end solution for managing data applications and is the only DataOps platform to do so. With its low-code development interface, users can integrate data in real-time from different sources, set up data engineering, and build data-driven products with its AI platform.
Composable can quickly perform these scalable transformations and analytics in the cloud using AWS, Microsoft Azure, and GCP. However, the self-service option is available on just AWS and Azure. Composable also has an on-premise deployment option with no third-party dependencies required.
Key Features:
- Data Flows: Composable provides for real-time data processing and automated data pipelines as well as data integration across multiple services and applications
- Query Views: It also has an interactive query service to write SQL codes for creating interactive analytics
- Data Catalogs: This platform provides enterprise-wide metadata catalog and documentation for data management
- Data Labs: Its customizable cloud notebook feature allows multiple users to perform analytics on the same notebook and share them with others.
- Data Repositories: This feature allows extensive exploration and management of data from different sources. Users can also visualize relationships.
- Dashboards: Its interactive dashboard interface creates live visualizations of analyzed data, forecasts, and predictions.
- Data Security: It provides policy-based security and access controls for end-to-end data audit, authentication, and protection.
- Customer support: Composable Data Ops Platform offers online, business hours, and 24/7 live support.
What users say: Composable has a very high overall rating of 4.9 on Capterra. Most users love its dataflow feature and praise their customer service.
Some users, however, say that there is too much information on a page and that trying to understand it is time-consuming. Also, first-time users may experience difficulty with some processes like the data flow.
02. K2View
This DataOps tool combines customer data from different systems, transforms it, and stores it into a patented Micro-Database to make the data readily available for analytics. These Micro-Databases are compressed and individually encrypted to enhance performance and data protection.
With its multi-node, distributed architecture, this platform can be deployed on-premises or in the cloud at a low cost.
Key Features:
- Data Integration: K2View Integrates data from various data sources into micro-Databases that users can get delivered to their desired systems and in different formats - streaming, messaging, virtualization, change data capture (CDC), ETL, and API
- Data Orchestration: Users can quickly create data flows, transformations, and business workflows - and make them re-usable
- Data Masking: K2View allows users to mask data from multiple sources whenever they want so that it is never exposed
- Micro-service Automation: It has an intuitive low-code/no-code interface that allows users to build and deploy web services easily
- Micro-Database Encryption: K2View's security module ensures that all data is safe by encrypting all micro-databases with its 256-bit encryption key
- It also provides data governance, catalog, micro-database management, and real-time micro-database sync with underlying data sources.
What users say: Apart from the features mentioned earlier, K2View users on Review Platforms like that they can comfortably build features that do not originally come with the installation. However, there have been complaints about how complex it is to upload and update data on the platform in CDC mode.
03. RightData
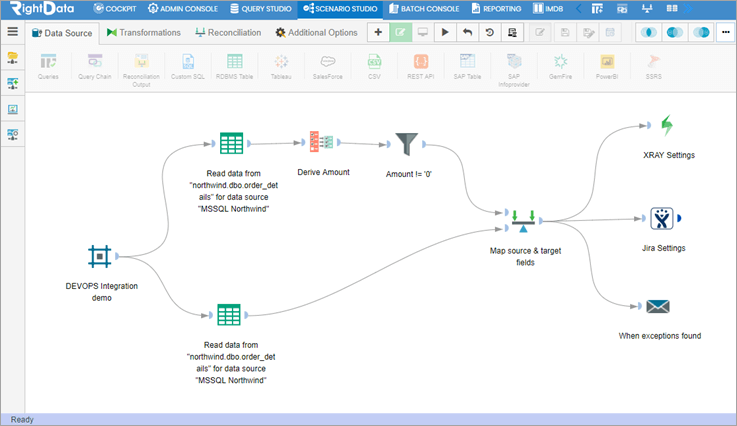
This DataOps tool provides efficient and scalable data testing, reconciliation, and validation services. With little to no programming, users can build, implement and automate data reconciliation and validation processes to ensure data quality, reliability, and consistency and avoid compliance issues. RightData has two platforms: Dextrus and RDt as RightData tool.
Dextrus is a self-service solution that performs data ingestion, cleansing, transforming, analyzing, and machine learning modeling. RightData tool enables data testing, reconciliation, and validation.
Features:
- Data Migration: RightData enables data migration from legacy platforms to modern cloud databases like AWS Redshift, Google Big Query, Azure, and Snowflake using embedded Dextrus connectors.
- Real-time data streaming: This platform transfers data in real-time through the data pipelines to the target platforms. This makes it easy for businesses to access the latest data and insights
- Data Reporting: During the ETL process, RightData provides analytics at every integration and transformation stage. Data engineers can leverage this service to build more efficient pipelines.
What users say: RightData Users particularly like the availability and responsiveness of the customer support team. Also, the company considers customers' suggestions and incorporates them into the platform for ease of use.
Although some users have experienced performance lapses, they were usually quickly resolved by the RightData team.
04. Tengu
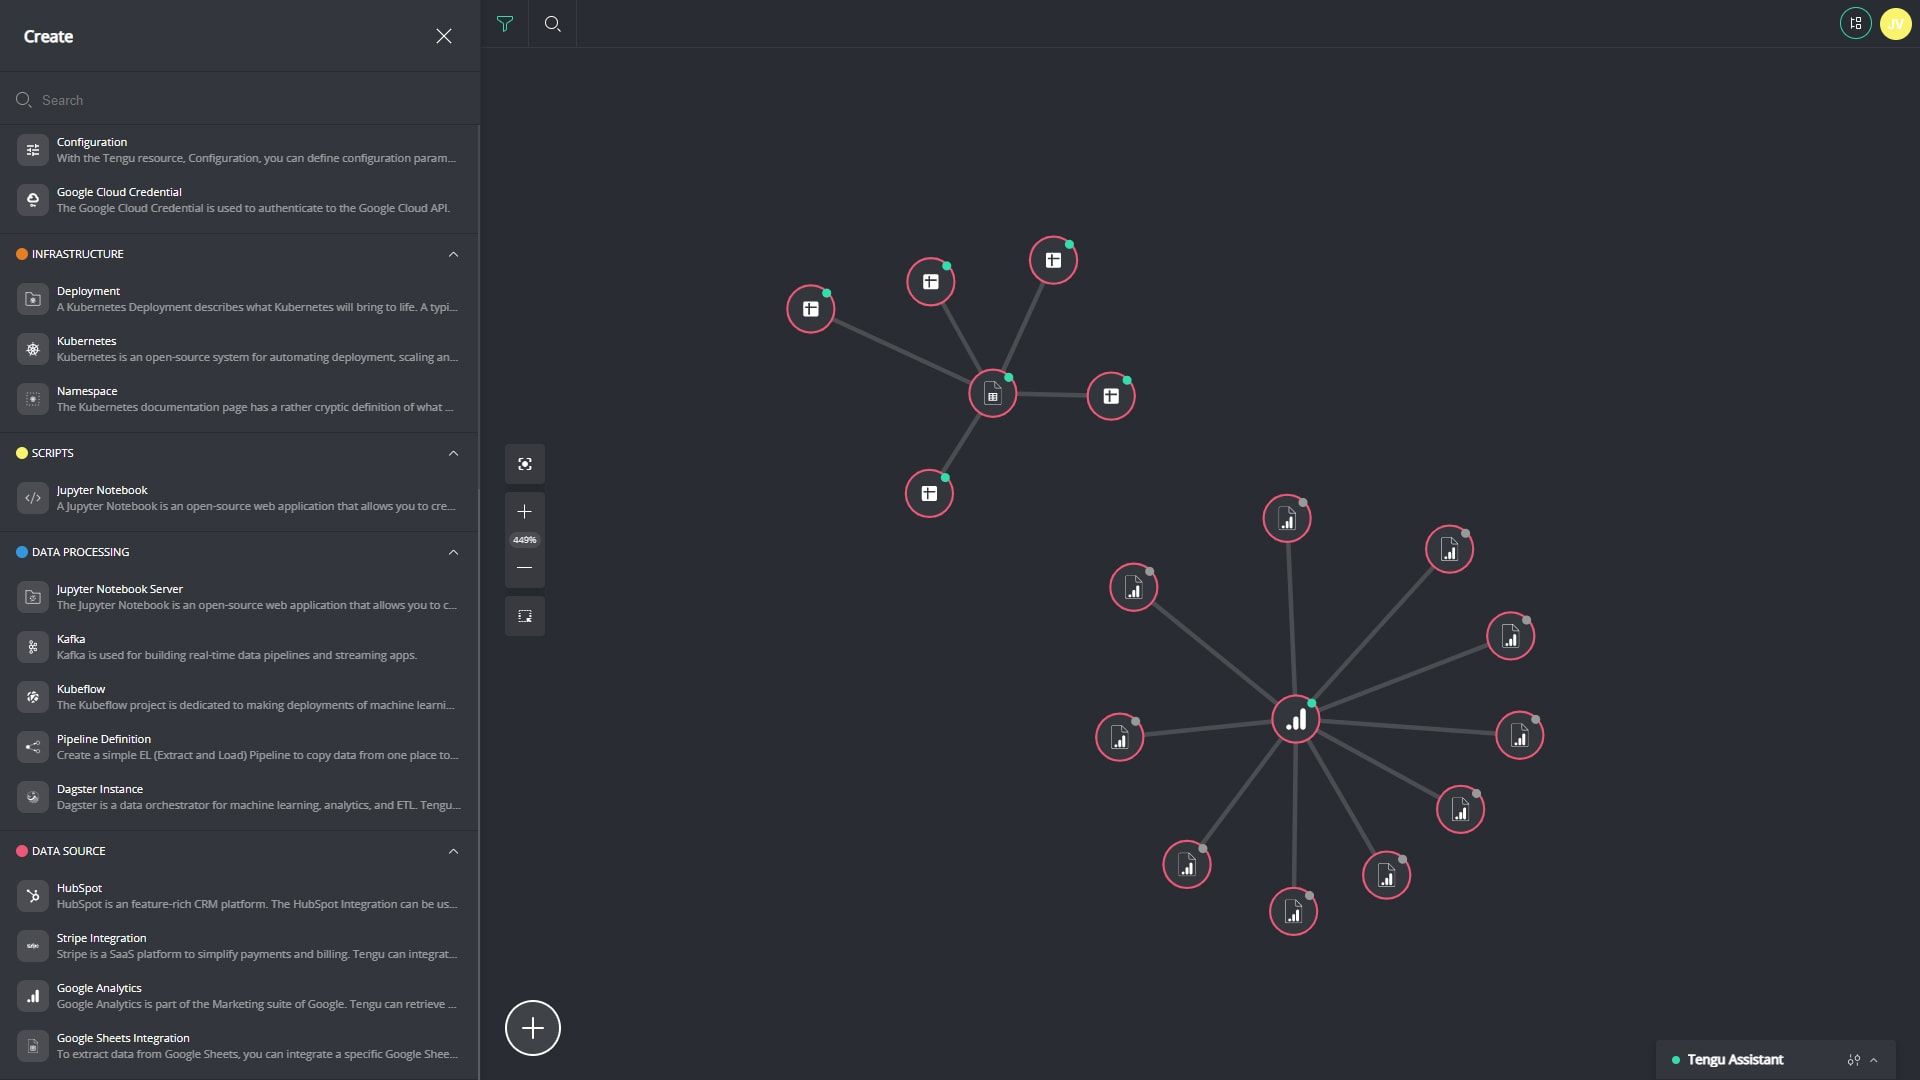
Tengu is a low-code DataOps tool designed for both data experts and non-data experts. The company provides services to help businesses understand and maximize the value of their data. Tengu also offers a self-service option for existing data teams to set up their workflows. It also supports a growing list of tools that users can integrate. This platform is available in the cloud or on-premise.
Key Features:
- Fast integration: Tengu provides data integration from different sources in a few clicks
- Schedule Pipeline orchestration: Users can deploy, manage, and run pipelines on a schedule to get updated data anytime
- Tengu assistant: It provides a built-in automatic assistant to help users with their DataOps
- Intuitive graph view: Tengu auto-generates graphs that assist users in understanding their data environments easily
- Collaborate: It also has collaboration capabilities that enable users to share any element in the graph.
- Automated Watchers: Users can trace all changes to their processes, and also detect any error quickly.
What users say: Tengu users, for the most part, are pleased with the tool, especially its capability to connect to important sources. However, although it is designed for non-technical users, there are complaints that it is still too technical for non-IT users.
05. Datafold
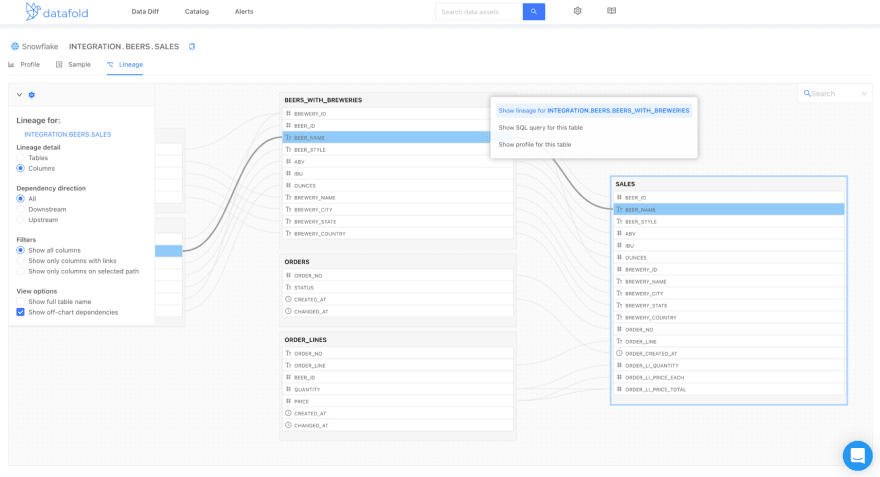
Datafold is mainly a data observability platform that helps users to trace data flows to detect and prevent any data anomaly from getting to production. With its Data Diff feature, it also tests ETL code and highlights changes and the impact on produced data.
Datafold can integrate with many data warehouses and data tools like Airflow and dbt.
Features:
- Proactive Data Testing: Users can test changes to code and use column-level lineage to track the impact on production data using GitHub integrations.
- SQL compiler: Datafold analyzes SQL statements in data warehouses and creates graphs of dependencies to show relationships.
- Data Observability: Users can set up notifications through various channels to alert them of any data issue.It also provides an intuitive interface showing a high-level overview of your pipelines, data migration to new data warehouses, data monitoring, and data catalog.
What users say: Datafold users love the DataDiff feature because of how easy it is to see differences in code. Datafold support team is also loved by their users.
06. High Byte Intelligence Hub
This DataOps tool is designed for industrial data - large volumes of diversified data generated at high speed. Running on-premises at the Edge (close to the data source), it integrates different systems to transform raw data into useful insights with re-usable models
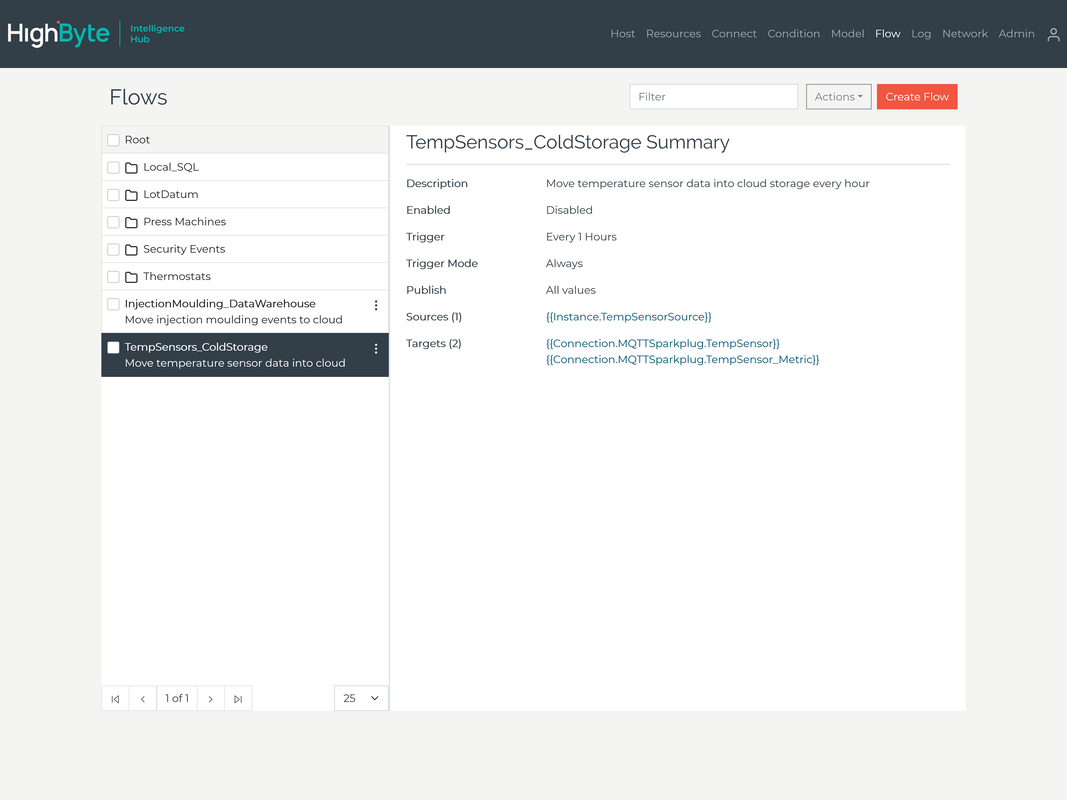
Key Features:
- Data Transformations: High Byte Intelligence Hub uses its built-in transformation engine to standardize data from different sources
- Multi-Hub Configuration: Administrators can connect multiple hubs into one central hub to monitor and compare hub activity.
- Administration: Administrators can create unique user names and passwords for each hub user and assign specific permissions.
This tool also offers data modeling, built-in security, user authentication, and log auditing features.
07. StreamSets
StreamSets allows users to easily design, build and deploy data pipelines to provide data for real-time analytics. Users can deploy and scale on-edge, on-prem, or in the cloud.
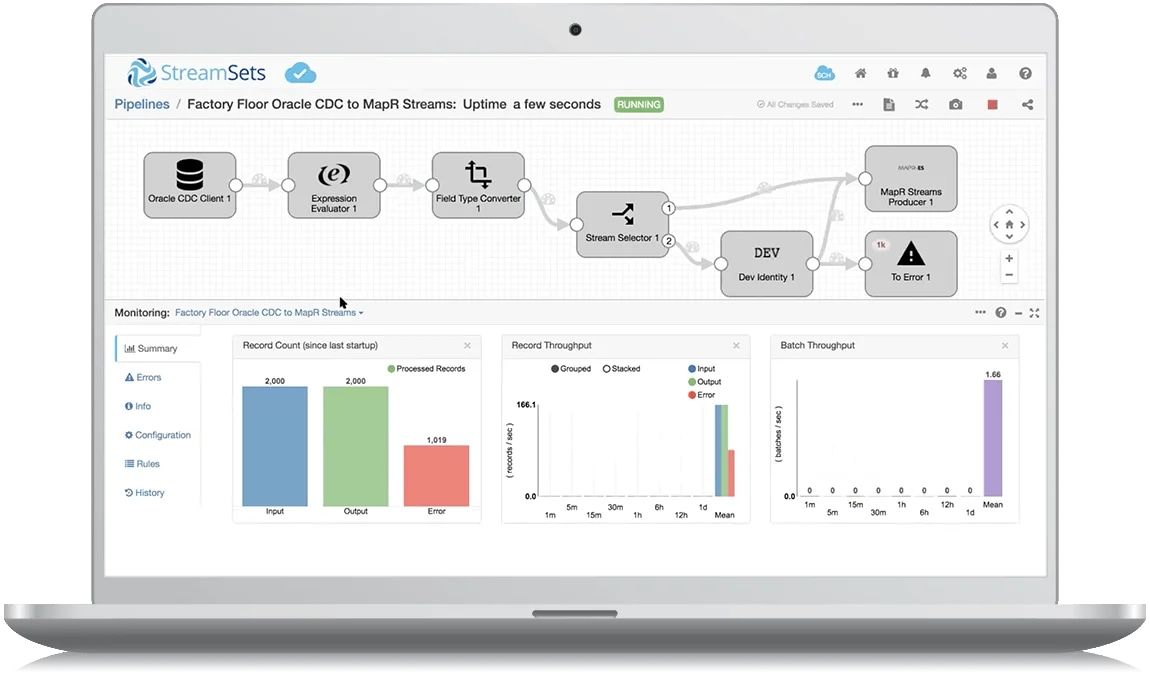
Replace specialized coding skills will visual pipeline design, test, and deployment. Get a live map with metrics, alerting, and drill down.
Features:
- Rapid Ingestion: StreamSets supports streaming data from multiple sources with its execution engines
- Transformation in Flight: Users can transform real-time data used by analytics applications on-the-go
- Operationalize and Scale: StreamSets users can monitor data pipeline performance to ensure data reliability.StreamSets also provides features that enable collaboration between team members and visual pipeline design.
What users say: On review platforms, most users love that their Engineering Pipelines is super easy to build. The tool could use more detailed error logging and more friendly In-built Job Monitoring.
08. DataKitchen
DataKitchen DataOps platform enables easy automation and coordination of workflows and people from orchestration to value delivery.
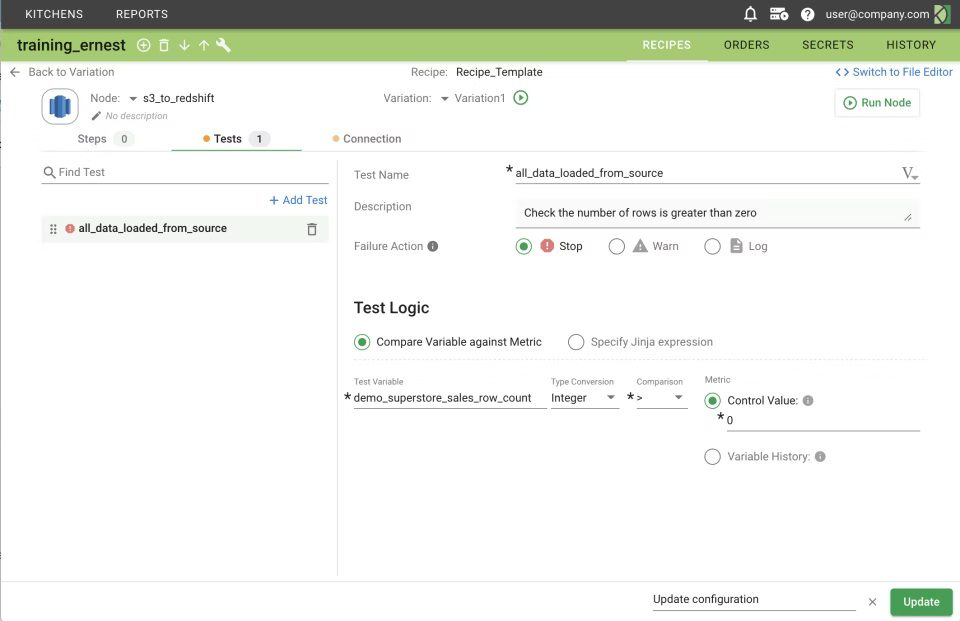
Features:
- Automated Testing and Monitoring: DataKitchen DataOps Platform enables users to add automated tests to every step in your development and production pipeline so that they can catch errors before it is too late.
- Customizable Alerts: Users can set alerts for different processes through email or third-party applications.
- Orchestrate Any Tool or Technology: DataKitchen allows the integration of multiple tools and workflows to orchestrate data pipelines
- Collaboration and Version Control: Members of a team can work collaboratively on analytics projects using different tools and resources and seamlessly merge their work without conflict.
- Measure and Improve Team Productivity: DataKitchen also provides dashboards that show the team’s performance and highlight areas of concern.
What users say: DataKitchen’s intuitive interface is a favorite among users because of its smooth experience.
09. Unravel
Unravel delivers end-to-end observability for data pipelines to enhance performance in data applications that provide business value. It also provides AI-powered recommendations for in the cloud and on-premises systems.
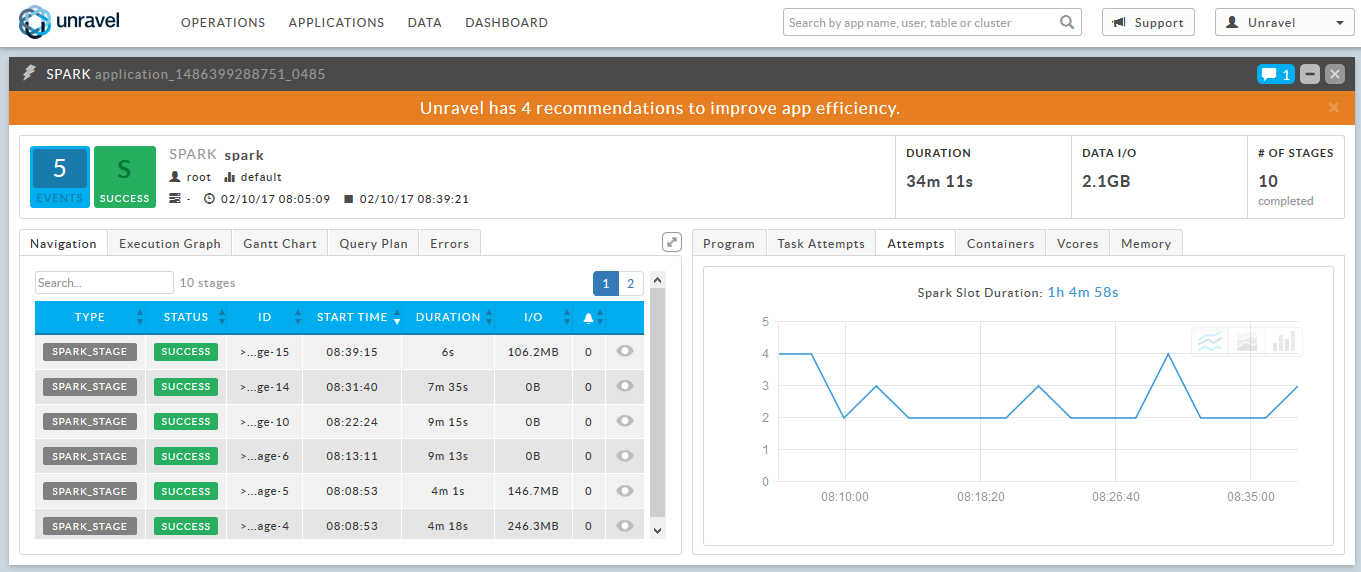
Features:
- Full-stack observability: The Unravel DataOps framework helps data teams to monitor and optimize the entire modern data stack for better reliability, performance, and cost optimization
- Cloud migration with reporting governance: Unravel provides insight into success metrics and cost implications of cloud migrations, and provides recommendations to improve these metrics.
- Big Data Application Performance Monitoring (APM): The Unravel APM monitoring tool insights to manage and optimize the performance of modern data applications. It also makes predictive recommendations based on the insights derived
10. Zaloni Arena
Zaloni Arena is a data management, governance, and observability platform that uses customizable workflows and detailed visualizations to enhance data accuracy and reliability. It also offers data security services with its masking and tokenization features.
Features:
- Cloud migration: Users can easily integrate and migrate data from the Zaloni Arena DataOps platform to the cloud
- Data management: Zaloni has flexible connectors that automate data integration from multiple sources. It also performs data quality checks and highlights version differences
- Data Governance: Users can profile data to improve data quality governance policies to ensure the continuous availability of accurate data
What users say: Zaloni users love its user-friendly interface and “out-of-the-box functionalities”. Although, the Self-Service ETL capabilities might need some improvement.
Conclusion
Deciding to implement the DataOps framework is the first step to acquiring the continuous, fast, and reliable analytics that your business needs. With a DataOps platform, you could automate these processes very quickly. Alternatively, you could use open-source tools like Apache Airflow to write scripts that perform some of these processes.
If you are interested in learning more about the DataOps movement and the related roles that have emerged, we have just the resources for you:
What's happening in the BI world?
Join 30k+ people to get insights from BI practitioners around the globe. In your inbox. Every week. Learn more
No spam, ever. We respect your email privacy. Unsubscribe anytime.
