Data Quality from First Principles
If you’ve spent any amount of time in business intelligence, you would know that data quality is a perennial challenge. It never really goes away.
For instance, how many times have you been in a meeting, and find that someone has to vouch for the numbers being presented?
“These reports show that we’re falling behind competitor X,” someone might say, and then gets interrupted —
“How do you know these numbers are right?”
“Well, I got them from Dave in the data team.”
“And you trust him?”
“We went through the numbers together. I can vouch for these numbers.”
“Alright, carry on.”
The conversation in itself tells you something about the relationship the organization has with data. It tells you that perhaps data quality problems have plagued management in recent months.
Nobody wants to make decisions with bad data. And nobody wants to look stupid. So for as long as people use data in the workplace, trusting the quality of your data will always be a background concern.
Which in turn means that it’s going to be your concern.
The Right Way to Think About Data Quality
There’s this old nut in business circles that goes: “people first, process second, and tools third”, sometimes known as “People Process Tools”, or ‘PPT’. One take on that saying is that if you have a group of well-trained, high quality people, you don’t need to have rigid processes. If you can’t expect people to be great 100% of the time, then you have to introduce some amount of process. And if you’ve tried your best with people and process, then you have to think about augmenting both with tools or technology.
(The other way of looking at this is that if you have terrible tools, work still gets done; if you have terrible processes, good people can still figure out a way around the bureaucracy, but if you have terrible people, all hope is lost.)
Data quality is a PPT problem. This is actually the consensus view in the industry, and should not be surprising to most of us. Here’s Snowplow, for instance, in their whitepaper on data quality:
We won’t lie - measuring the accuracy and completeness of your data is not easy and is a process rather than a project. It starts at the very beginning: how you collect your data. And while it never ends, quality grows with better-defined events going into your pipeline, data validation, surfacing quality issues and testing.
And here’s data warehousing legend Ralph Kimball, in a white paper he published back in 2007:
It is tempting to blame the original source of data for any and all errors that appear downstream. If only the data entry clerk were more careful, and REALLY cared! We are only slightly more forgiving of typing-challenged salespeople who enter customer and product information into their order forms. Perhaps we can fix data quality problems by imposing better constraints on the data entry user interfaces. This approach provides a hint of how to think about fixing data quality, but we must take a much larger view before pouncing on technical solutions (emphasis added).
(…)
Michael Hammer, in his revolutionary book Reengineering the Corporation (HarperBusiness 1994), struck to the heart of the data quality problem with a brilliant insight that I have carried with me throughout my career. Paraphrasing Hammer: “Seemingly small data quality issues are, in reality, important indications of broken business processes.” Not only does this insight correctly focus our attention on the source of data quality problems, but it shows us the way to the solution.
(…) Technical attempts to address data quality will not function unless they are part of an overall quality culture that must come from the very top of an organization (emphasis added).
But common sense dictates that while tools can only succeed with the right people culture and processes in place, tools will influence what can be done, and by whom.
Kimball's Principles
Kimball’s whitepaper is useful because he outlines a common-sense, first principles approach to thinking about tools for data quality.
In his view, tools that promote good data quality should come with the following features:
- They should enable early diagnosis and triage of data quality issues. Ideally, you should be notified the instant some number seems off.
- Tools should place demands on source systems and integration efforts to supply better data. Integrating with the tool should force data teams to reckon with a certain baseline of expected quality.
- They should provide users with specific descriptions of data errors when encountered during ETL. This is a tool-specific requirement, and it applies to both ETL and ELT-paradigm tools.
- There should be a framework for capturing all data quality errors. That is, data quality errors should be treated as a source of data itself, which means that:
- There should be a method for measuring data quality over time. And finally:
- Quality confidence metrics should be attached to final data.
If you’re wondering what a quality confidence metric is, you’re not alone. In the whitepaper, Kimball goes to great lengths to define quality confidence metrics as a statistical measure of expected value. For instance, if we are tracking data in 600 stores with 30 departments each, we should expect to receive 18,000 sales numbers each day. Kimball explains that all numbers that are three standard deviations above the historical mean could be logged into a separate error table. The data team should then take responsibility for investigating every event that is logged there.
(Kimball being Kimball, he describes the error table as a fact table in a dimensional star schema … because of course he would).
What That Looks Like Today
Are there more modern approaches to data quality? Yes there are. In a blog post a couple of weeks ago, Uber released details of their data quality monitoring system (which they’ve named DQM), which uses similar statistical modeling techniques to guarantee data quality at scale.
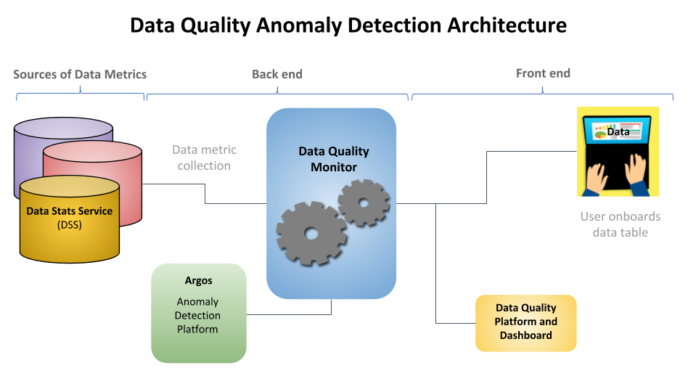 DQM from Uber
DQM is essentially a more sophisticated version of the same approach. It observes data tables and generates a multi-dimensional time series for each. For numeric data, DQM tracks metrics like average, median, maximum, and minimum. For string data, DQM tracks the number of unique values and the number of missing values in the strings they’re monitoring. On normal days, DQM spits out a quality score for each table, for display to data table users. But if DQM observes data that is abnormal compared to the historical patterns, it alerts all downstream reports and dashboards and warns both data consumers as well as data engineers to mistrust the numbers, and to check source systems for the potential problems.
I won’t summarise Uber’s blog post, because it does a great job of explaining the technical details in a concise, useful manner. But I couldn’t help but notice that Uber’s system fulfils all the requirements set out in Kimball’s original whitepaper.
To wit:
- DQM enables early diagnosis and triage of data quality issues.
- DQM sits on top of all other data infrastructure, thus placing demands on source systems and integration efforts to supply better data.
- DQM stores specific descriptions of data errors that are encountered at any point in the data lifecycle.
- It captures all data quality errors.
- It generates time series data, which means that stored data quality scores are an easy way to measure data quality over time. And finally:
- Quality confidence metrics are always displayed alongside actual data.
DQM may be proprietary to Uber, but the approach is pretty darned inspirational to the rest of us in the industry. Which was probably what the authors intended with their blog post.
If you’re struggling with data quality at your company, take a step back to see if you can address your problems with tools or processes that feature even a handful of Kimball’s suggested principles. Don’t fret if you fail; data quality is an ongoing concern … which implies you won’t get it right all at once. You merely have to make sure you’re getting better at quality over time.