View media kit
  • Product
    Offerings
    • AI analytics Explore data using natural language.
    • Self-service BI Let anyone analyze and explore data, no SQL required.
    • Embedded analytics Delivers AI-powered embedded analytics to customers.
    Features & Capabilities See All
    • Semantic layer The programmable semantic layer. Model your business in AML.
    • Analytics query language The composable query language built for AI reasoning.
    • Analytics as-code Define metrics and dashboards as code. Version control with Git.
    • Agentic BI development Develop BI with coding agents, locally or in browser
    • dbt integration Connect dbt transformation layer with Holistics BI layer
    • Canvas dashboard Empower your data storytelling with unparalleled flexibility
    • Reusable analytics Build reusable analytics components
    • Dynamic data sources Dynamically select data source by user and environment
    • All features Explore all powerful features in Holistics
  • Pricing
  • Docs
  • Blog
  • Customers
    Customer Stories
    • Customers & case studies Learn how our customers built reliable BI systems with Holistics
    • Support White-glove support to help you succeed with Holistics
  • Resources
    Learn
    • Worldview Our worldview on business intelligence
    • Not all semantic layers are equal Why the semantic layer is the real AI differentiator
    • Demo sandbox Try Holistics in your browser with sample data.
    • Documentation Learn how to get started with Holistics.
    • Support White-glove support to help you succeed with Holistics
    • Release notes What just got shipped!
    • Product roadmap What's shipping next?
    Engage
    • Community Ask questions, request new features or mingle with other Holistics users
    • Blog Inner Join - our blog on Business Intelligence for practitioners.
    • Newsletter Our weekly newsletter to 30K+ data professionals worldwide.
    • About us A decade betting on one idea: the semantic layer.
    • Contact us Have questions? Contact our team.
    • Partners Holistics consulting partner network.
    • Referral program Earn commission by referring prospects to Holistics
    Books
    • The analytics setup guidebook Build scalable analytics & BI stacks in the modern cloud era
    • Slice & dice: A self-service analytics comic What self-service analytics is, and why it is important.
    • Log in
    • Book a demo Book a demo
    • Offerings

      • AI analytics
      • Self-service BI
      • Embedded analytics
    • Features & Capabilities

      • Semantic layer
      • Analytics query language
      • Analytics as-code
      • Agentic BI development
      • dbt integration
      • Canvas dashboard
      • Reusable analytics
      • Dynamic data sources
      • All features
  • Pricing
  • Docs
  • Blog
    • Customer Stories

      • Customers & case studies
      • Support
    • Learn

      • Worldview
      • Not all semantic layers are equal
      • Demo sandbox
      • Documentation
      • Support
      • Release notes
      • Product roadmap
    • Engage

      • Community
      • Blog
      • Newsletter
      • About us
      • Contact us
      • Partners
      • Referral program
    • Books

      • The analytics setup guidebook
      • Slice & dice: A self-service analytics comic

← See previous newsletters

Huy Nguyen · November 13, 2023

Inner Join is Holistics's business intelligence newsletter. This week, I write a short post about the two forms of metrics, and how knowing this distinction helps data analysts communicate better with business stakeholders.


The Two Forms of Metrics: Interval vs Point

As a data analyst, how would you respond to these two simple data requests?

  • “What’s our revenue last month?” (e-commerce business), vs
  • “What’s our MRR last month?” (SaaS business)

The first question is fairly simple, you take all orders generated last month (30-31 days) and sum their sales:

SELECT SUM(sale_total) FROM orders WHERE order_date::month == '2023-10'

But for the second question, we actually have two ways to interpret (and calculate) this:

  1. Take the company’s MRR at the very end of last month, or
  2. Sum all the new recurring deals that happened last month.

If you run a SaaS business, you know instantly that “MRR last month” refers to option one. Option two gives you “Net MRR Growth last month", which is likely not what the business user asked for.

But why is MRR's form of calculation different from Revenue's calculation above? Aren't they supposed to be the same? What caused this difference?

This is because of a concept I call the two forms of metrics. The interval vs point forms.

  • A metric’s interval form is one that goes with a specific time period (day, week, month, or any custom time period).
  • A metric’s point form is one that goes with a specific point in time: end of month, beginning of year, end of year, etc.

In actual business conversations, the metric's form is sometimes ignored and implicitly understood. Understanding this concept will give you much better clarity in dealing with metrics (and of course, business stakeholders).
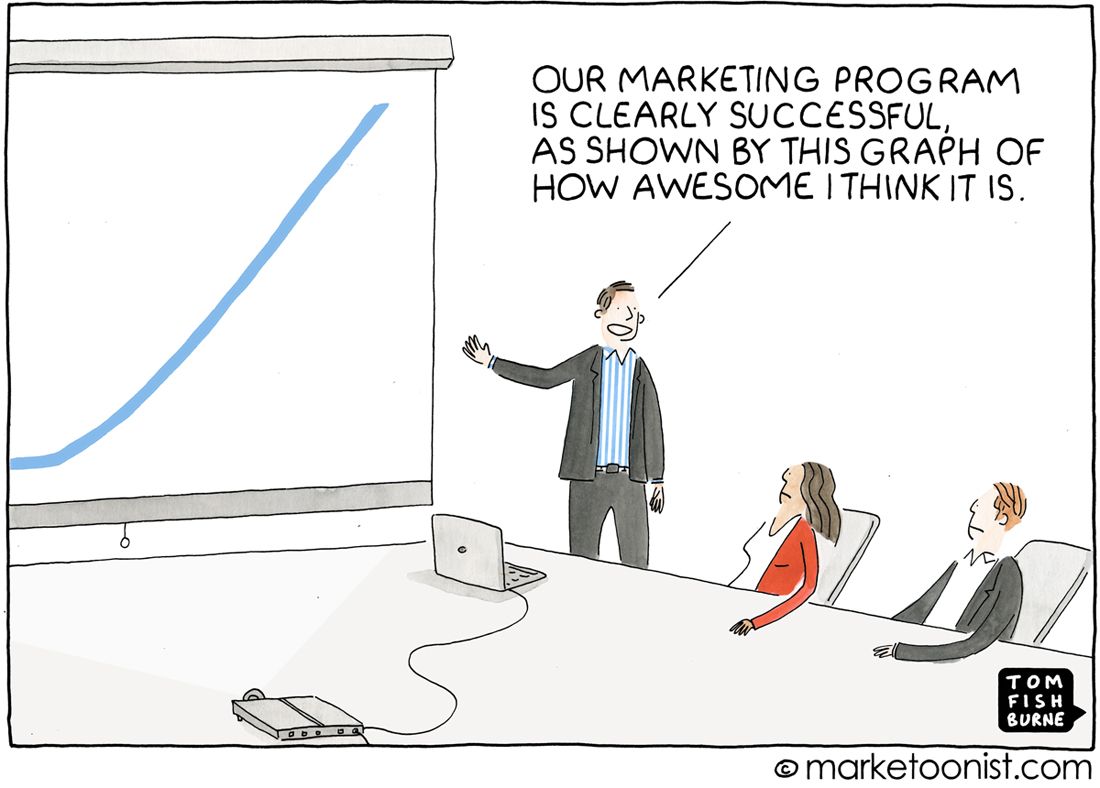
Understand 02 forms of metrics will give you much better clarity in dealing with metrics and help business stakeholders focus on the right one (and not vanity metrics)

Here's a few interesting attributes about these 2 forms of metrics:

1- Some metrics are implied in one form over the other. For example, “active users” metric is an interval form metric, “MRR” is commonly used in point form.

2- Some metrics only take one form. For example, “active users” only makes sense in its interval form (daily active, weekly active, 7-day active, etc). Their point form is virtually non-existant.

3- A metric can make sense in both point form and interval form. An investor asking a founder "What's your business's revenue?" can be answered with "all time revenue", or "most recent month's revenue". The first example in this post demonstrates the interval form of revenue. Its point form counterpart is: “What’s our all-time revenue until the end of last month?”

4- A metric’s point form is usually the cumulative version of their interval form (span from the beginning of time):

Revenue (at t) = Revenue [begin, t]

5- Here’s a table of a few sample metrics, alongside their interval and point forms:

Metrics Interval Form Point Form
Revenue Revenue for month X Cumulative revenue at time T
MRR (Less common) MRR at time T
Active Users DAU, WAU, MAU (Not applicable)
Conversion rate The conversion rate for month X (Less common)

This simple concept has helped me multiple times when talking to my business colleagues. It gives me the conceptual vocabulary so that when I hear a request from a user, I can instantly classify them, and ask follow-up clarification if necessary.

Hopefully you'll find it useful as well.


Interested in hearing more about practical advice or thoughtful take on contemporary BI practice? Check out our related blog post:

  • The skill chasm of data analysts career
  • How to run a data clinic (or data office hour)
  • The misleading data analyst job title (and career ladder)

Get Inner Join in your inbox

Inner Join cuts past vendor noise to the durable ideas behind analytics, modeling and data organization.

Product
Self-service BI
Semantic Layer
Data Delivery
Embedded Analytics
Canvas Dashboard
What Makes Holistics Different
Compare with Looker
Compare with PowerBI
Compare with Tableau
Compare with QuickSight
Compare with Metabase
Resources
Docs
Not all semantic layers are equal
Demo Sandbox
Product Roadmap
Release Notes
Community Forum
Analytics Guidebook
Uptime Monitoring Service
Blog
Partners
BI Comparison Guides
Best BI Tools
BI Tools with Semantic Layers
Self-Service BI Tools
Embedded BI Tools
AI BI Tools
Security & Policies
Data Security
SOC2 Compliance
GDPR Compliance
Privacy Policy
Terms of Service
Support SLA
Responsible Disclosure
Data Processing Agreement
Company
About Us
Contact Us
Media Kit
Careers
Customers
Customer Login
Contact
Twitter
LinkedIn
Facebook
Singapore
14 Robinson Rd,
Far East Finance Building, #08-01A,
Singapore 048545
United States
2400 North Henderson Ave, # 1156
Dallas, Texas 75206
Vietnam
457 Nguyen Dinh Chieu, Level 2
Ban Co Ward, Ho Chi Minh, Vietnam
Copyright 2015 - 2026 Holistics Software. All Rights Reserved