Looker BI Tool Review | 100% Vendor-Neutral Guide
Looker is unique among the popular business intelligence (BI) tools for its innovative approach to data modeling and exploration. In this post we're going to do a high-level review and analysis of Looker, what it does, and what it strengths and weaknesses are.

Contents
A comprehensive analysis of Looker, its strengths and weaknesses.
Looker is unique among the popular business intelligence (BI) tools for its innovative approach to data modeling and exploration. In this post we're going to do a high-level review and analysis of Looker, what it does, and what it strengths and weaknesses are.
This post is meant for data & analytics teams who are looking into evaluating Looker among others as their BI tool/data analytics software.
TL;DR
Looker is an innovative product with a unique approach to business intelligence and analytics. Looker has its own proprietary modeling language called LookML, which is Looker's source of strength but interestingly also its weakness. It provides a data modeling layer that is both reusable and maintainable, yet its steep learning curve makes it less approachable than other alternatives.
Looker works best for experienced data teams that appreciate its unique approach to data modeling and have the need for allowing everyone in the organization to slice and dice data on their own. It also requires an existing data warehouse, which is preferable for data teams that have already set up their own.
Related reading:
- Best Looker Alternatives For Growing Data Teams
- Looker vs Holistics: Comparision, Pricing and Feature
Looker assessment table
| Functionality | Assessment | Notes |
|---|---|---|
| Data Modeling | Good/Great | Sophisticated data modeling with its own proprietary language LookML |
| Data Visualization | Weak/Medium | Servicable data visualization |
| Data Blending | Weak/Medium | Minimal data blending with Merged Results feature |
| Access control and permission management | Great | Flexible and sophisticated access control but quite complex with high learning curve |
| Pricing | Weak/Medium | Expensive and non-transparent |
| Data Delivery | Good | Have multiple options for data delivery |
| Data Connectors | Weak/Medium | Only support SQL-based data connectors |
| Interactive Drilldowns | Good | Flexible and decently good drilldown support |
Feel free to skip ahead to the sections that interest you best, we'll be covering the following topics here:
- Data Connectors
- Date Modeling with LookML
- Data Exploration and Visualization
- Drilldowns and Drill-throughs
- Data Blending
- Data Delivery and Scheduling
- Organization with Looker
- Access Control, Permission Management and Data Governance
- Data Preparation Capabilities
- Pricing
- Conclusion
Data Connectors
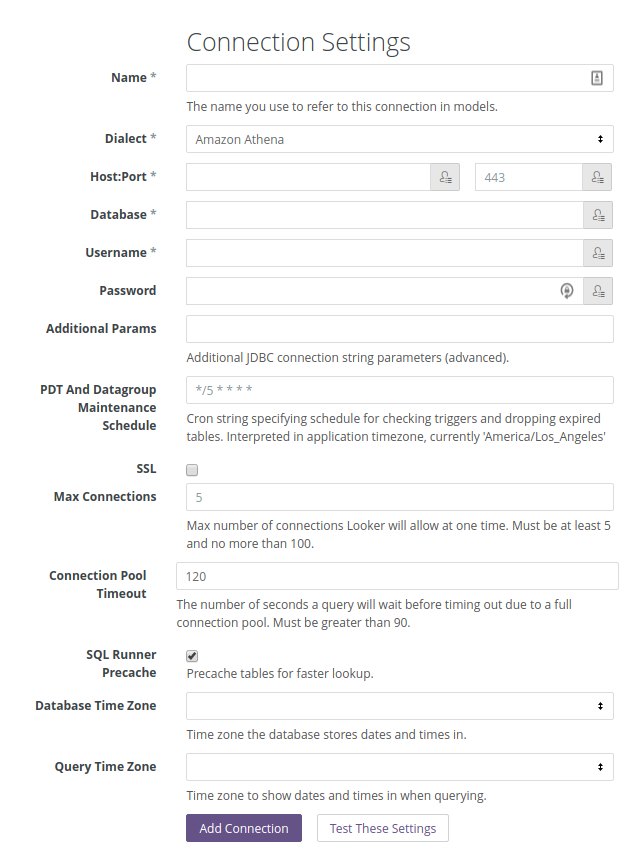
As with any other Business Intelligence tool, in Looker, right off the bat, you need to set up connections to your data sources.
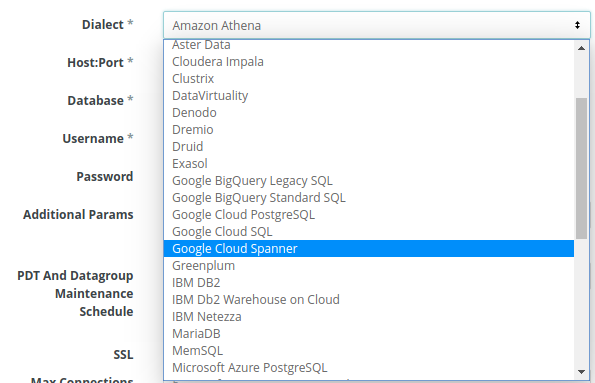
As a SQL-based BI tool, Looker unfortunately only supports SQL databases. On the bright side, its list of supported data sources is quite decent, ranging from common RDBMS like Oracle, Microsoft SQL Server to obscure ones like Denodo and XtremeData.
The amount of advanced options available is also impressive with options like max number of connections and connection pool timeout. However, it would have been better to hide these options behind an "Advanced" checkbox to make the form less cluttered and intimidating.
Data Modeling with LookML
A requirement that immediately sets Looker apart from other alternatives is the need to invest time in an upfront data modeling step, before any data visualizations can be done. For Looker, this means learning and preparing the modeling work in LookML first, as an abstraction on top of a SQL database.
LookML concepts
Here is the definition of LookML from Looker's documentation:
LookML is a language for describing dimensions, aggregates, calculations and data relationships in a SQL database.
The most important concepts in Looker are Views, Explores and Models which are modeled directly in LookML.
Views
In Looker, a view is a set of fields that are linked to a physical or derived table. The fields are in turned classified into 2 types: dimensions and measures. Think about dimensions as your database table columns and calculated fields as drawn from those columns; and measures as columns with SQL aggregations (sum/avg/min/max/etc.) applied.
Explores
Looker calls a view that can be queried an explore. It also declares the relationships to other views (called joins) and works as a starting point for a query, or in SQL terms, the table referenced in a FROM clause.
Data Models
Looker calls a model a customized portal into the database. In essence, it is a set of related views and explores that can be shared to business users to provide drag-and-drop data exploration.
Its three-step data modeling process starts from defining views, combining views using relationships into an explore, then combining explores into a data model to be shared to business users.
Defining views, explores and models with LookML
Development mode vs Production mode
Looker distinguishes between development mode and production mode during the data modeling process. Development mode allows you to create and edit LookML projects while production mode allows business user to explore created LookML data models. Separating two modes can get tedious for users when you just want to get-things-done, but the benefit is that you have a clear mental separation between what is available to business users and what is still under development.
Git integration
Git is the de facto standard distributed version control system widely used by programmers to manage source code. Looker is unique in that it forces you to use Git to manage your LookML projects. You can use Looker in development mode without a Git integration, but if you want to share it with your business users and do data exploration in production mode, you must set up Git.
Looker's approach is polarizing. Experienced analysts will appreciate the maintainability and flexibility of a powerful version control system like Git. For analysts who are not familiar with Git, you will need to learn Git concepts like commits, branches, etc. to fully understand the whole workflow. The knee jerk reaction could be strong resistance to the learning curve involved, wondering why they need to jump through hoops just to do data modeling.
The LookML editor
To start the data modeling process, Looker presents you with a web-based text editor to develop LookML.
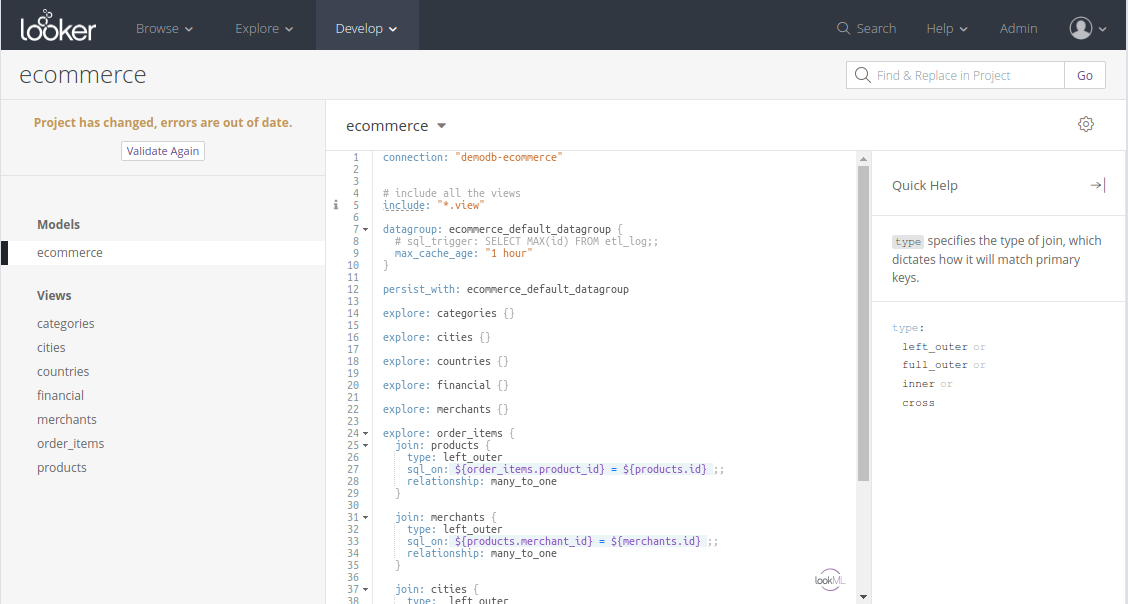
The editor has standard features expected from a code editor like auto-complete and even support for Vim/Emacs key bindings if that's your jam. The Quick Help sidebar is quite useful as otherwise you'd need to constantly refer to Looker's official documentation site.
The editing experience is not too bad but the worst thing about this process is the long feedback loop. Unlike other tool like PowerBI where you can instantly see the output of your modeling every step along the way, in Looker you need to really know what you are doing: type in the correct rules, click on "Validate" button, then "Save" button, try exploring the data using the created models to verify, then rinse and repeat. Any wrong step along the way will need you to start the cycle all over again. In our experience, this drawback is the weakest part of Looker's data modeling offering, as compared to other similar tools.
Data Exploration and Visualization
Once the views and explores have been defined in LookML, a user can now start doing self-service exploration in Looker Explore. You do this by selecting the fields you are interested in from the left side bar and then clicking on the Run button. Pivoting is easy but not very intuitive as you need to click on the Pivot button for the fields you want to pivot, instead of dragging the fields into column/row boxes like in Excel.
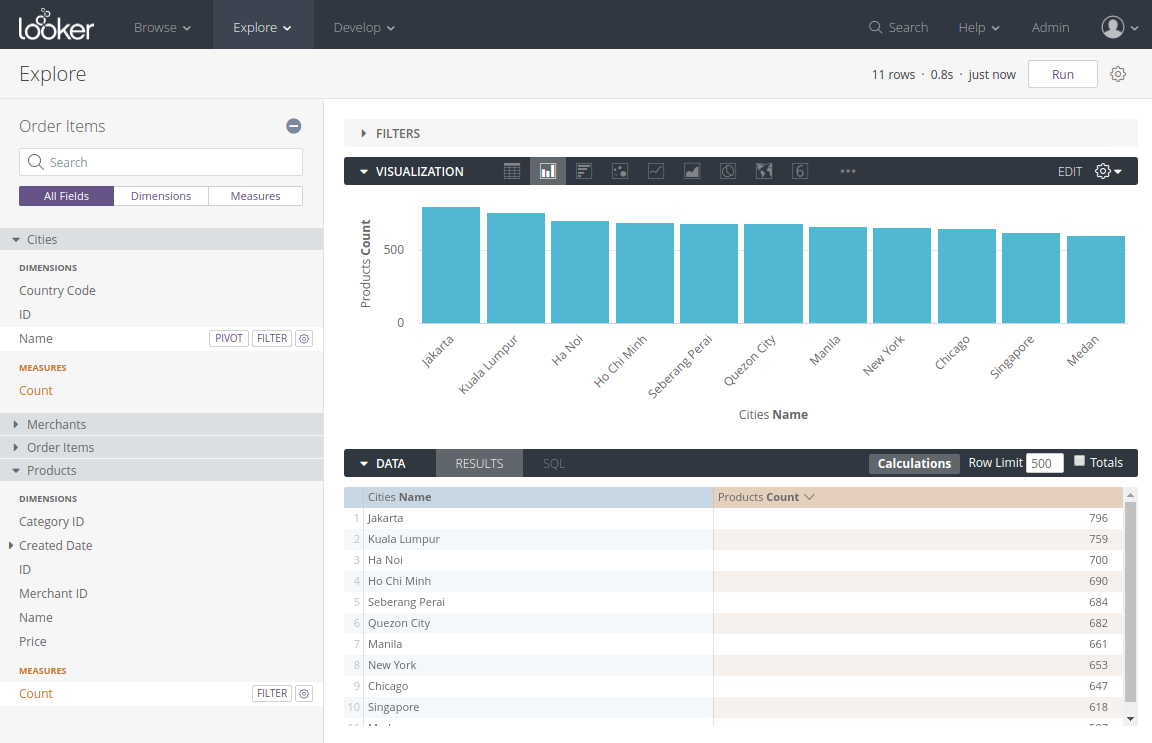
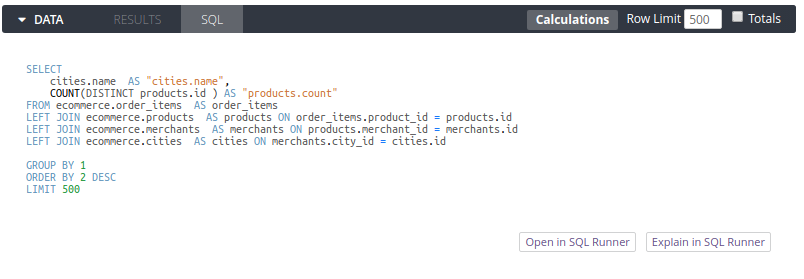
Play around with Looker's data exploration feature for a while and you'll start to realize you are actually operating a SQL query builder under the hood. Looker uses your input and combines it with the underlying views/explores set-up beforehand to generate and execute the final SQL query, to get the data back to you.
One of the first things you'll notice when doing data visualization with Looker is that you need to manually click on the "Run" button every time you change something. This is a result of the way Looker works: generating a new SQL query anytime you change the data visualization configuration. It is logical but pretty annoying when you are familiar with other BI tools that provide instant feedback without having to rerun a query.
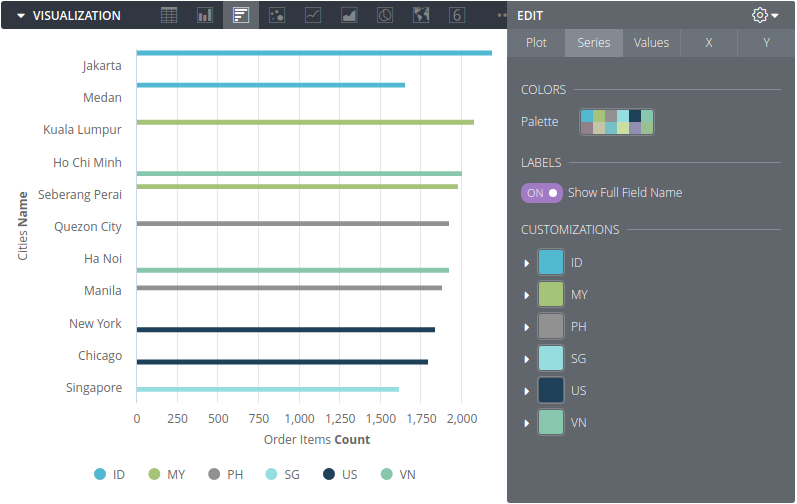
In terms of visualizations, Looker's offering is passable but can't match the likes of Tableau or even PowerBI or QlikView. It supports about 15 different types of charts with standard customization options such as color palette, series types (line, area, scatter, etc.) and other usual suspects.
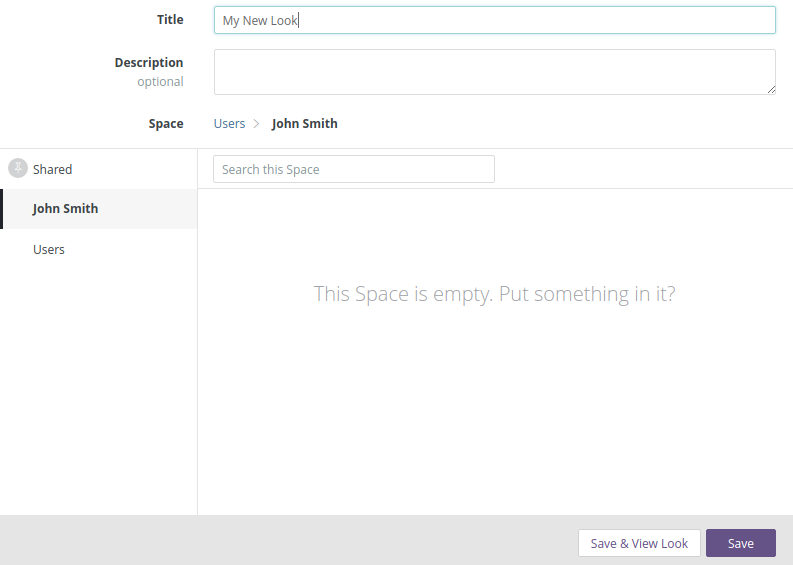
Once done exploring, you can save an individual exploration to what Looker calls a Look, or a group of Looks to a dashboard.
Drilldowns and Drill-throughs
As with almost everything else in Looker, you need to use LookML to define your drilldowns. It is pretty intuitive once you are familiar with the way Looker works.
You set-up a set of fields that will be exposed when you do drilldowns on a certain dimension or measures.
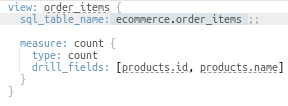
Now when an "Order Items Count" measure is selected, you can drill down on that field.
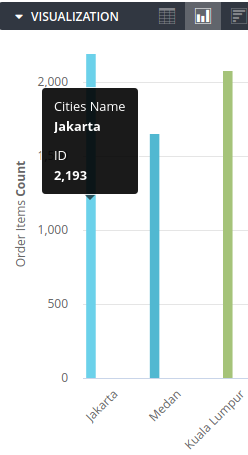
For example, when you click on a column in the chart, the corresponding measure "Order Items Count" is drilled on and its drill fields ("Products ID" and "Products Name") are triggered, with a new result set returned:
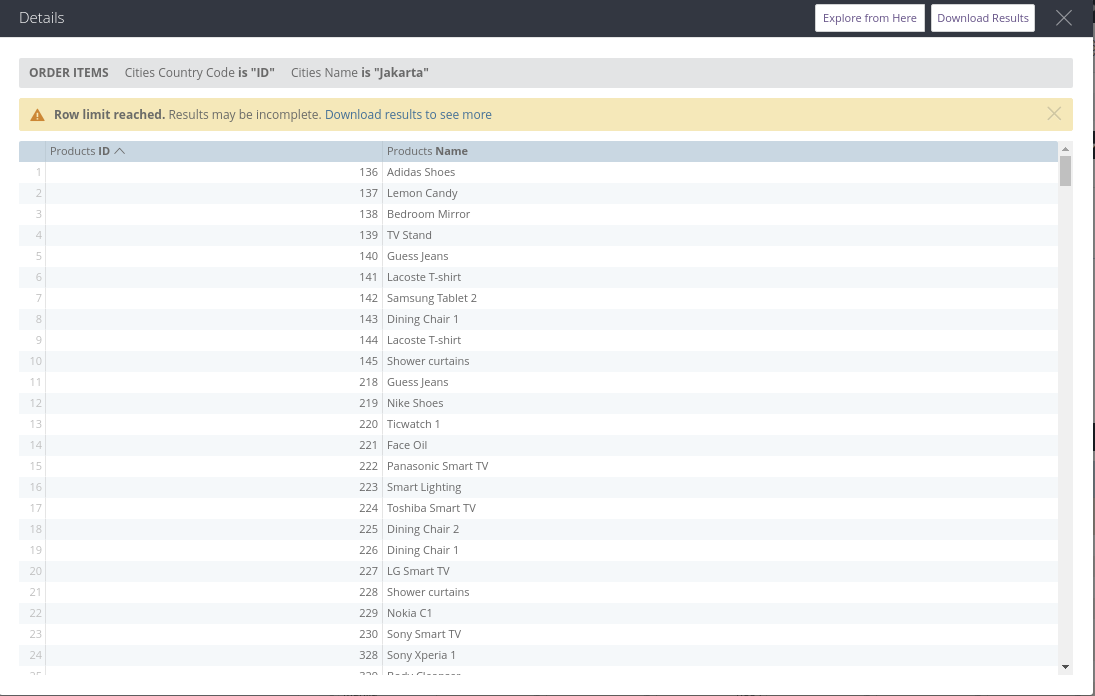
Clicking on "Explore from here", you will be presented with a new exploration window with "Products ID" and "Products Name" preselected:
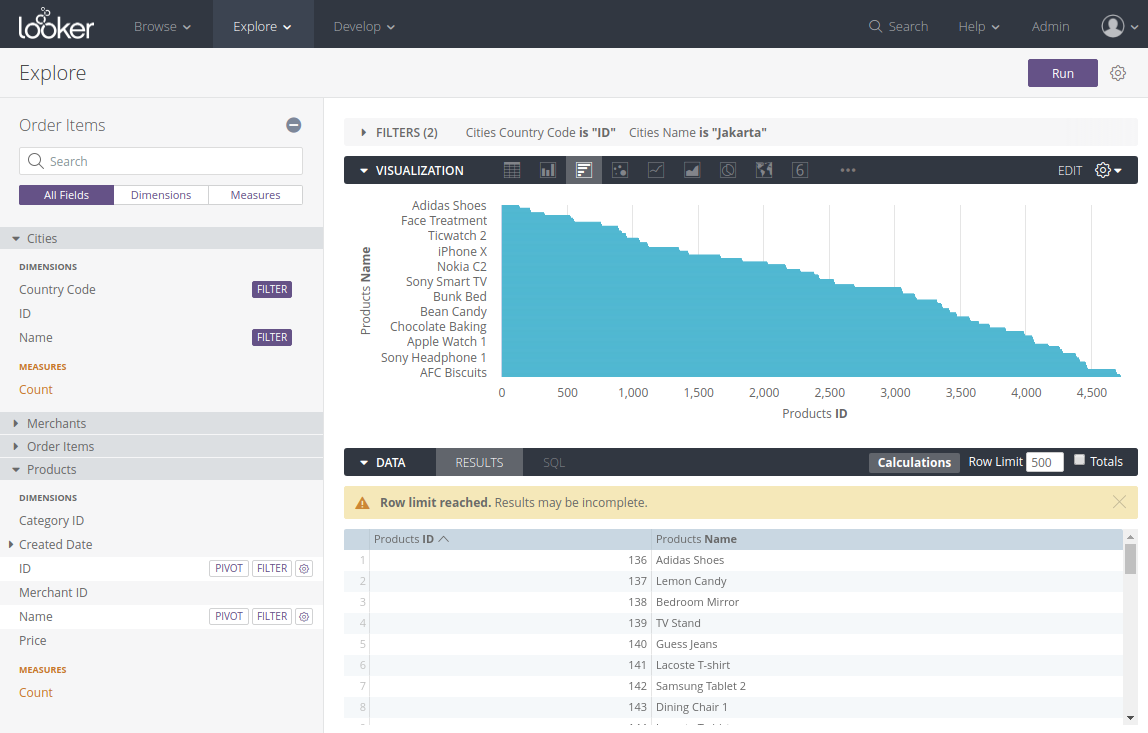
From the example above, we can see that due to its robust data modeling layer, Looker's drilldown is easy to set up and provide a smooth and intuitive user experience.
Data Blending
Looker supports data blending with the concept of Merged Results. It works like a SQL join between result sets, even across databases.
In order to use this, you will need to use Explore to generate a result set. Once done, you can click on "Merge Results..." from the menu:
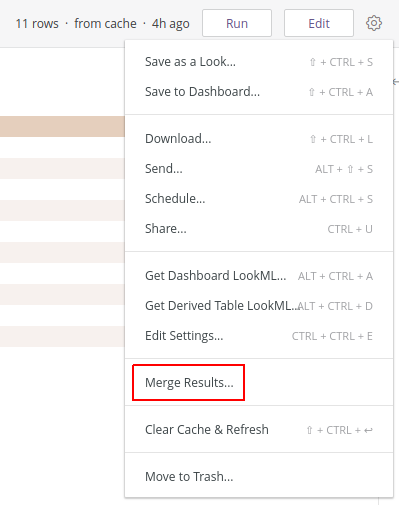
Then you will need to add another result set (Looker calls it a Query) to merge it into the original one.
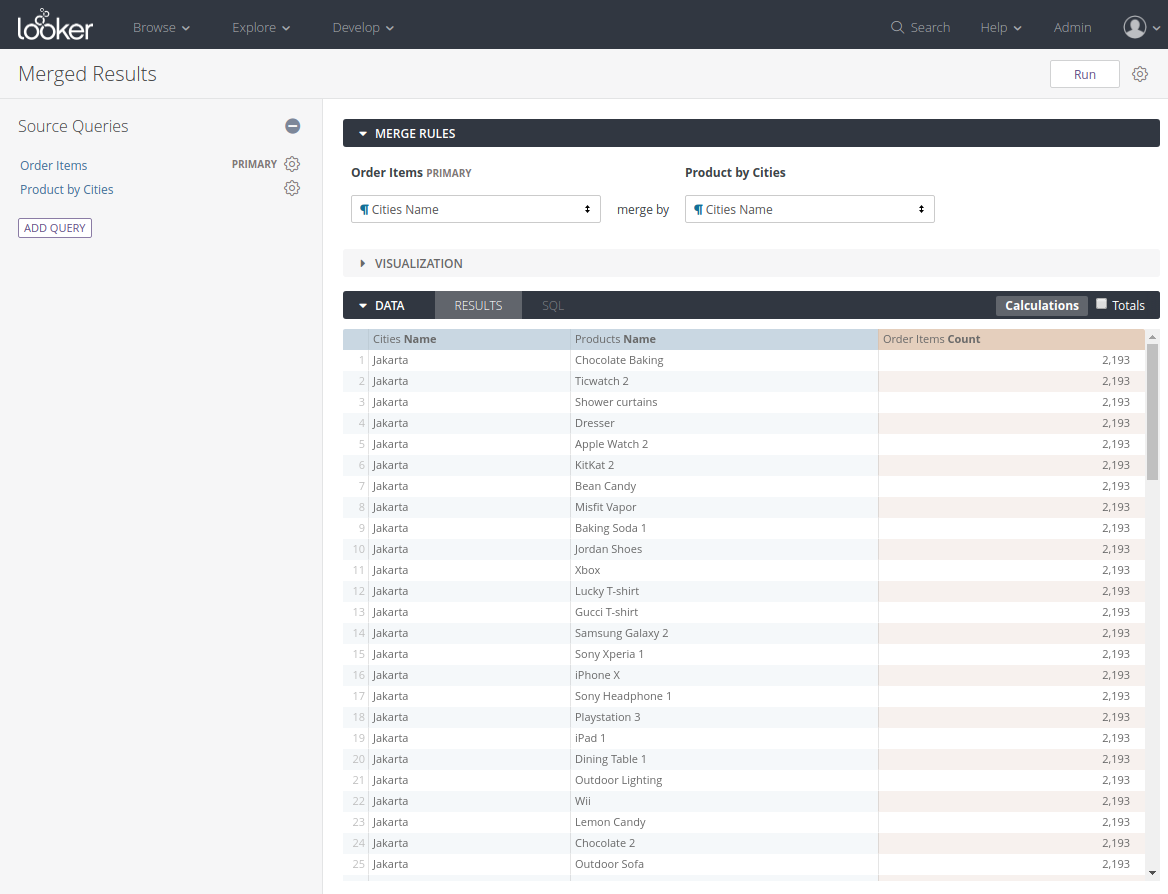
You can add multiple queries to merge but you need to have one set as the primary query.
Merge Results in my opinion feels out of place with the way Looker works with data modeling, nonetheless it empowers users to handle a common use-case decently well.
Data Delivery and Scheduling
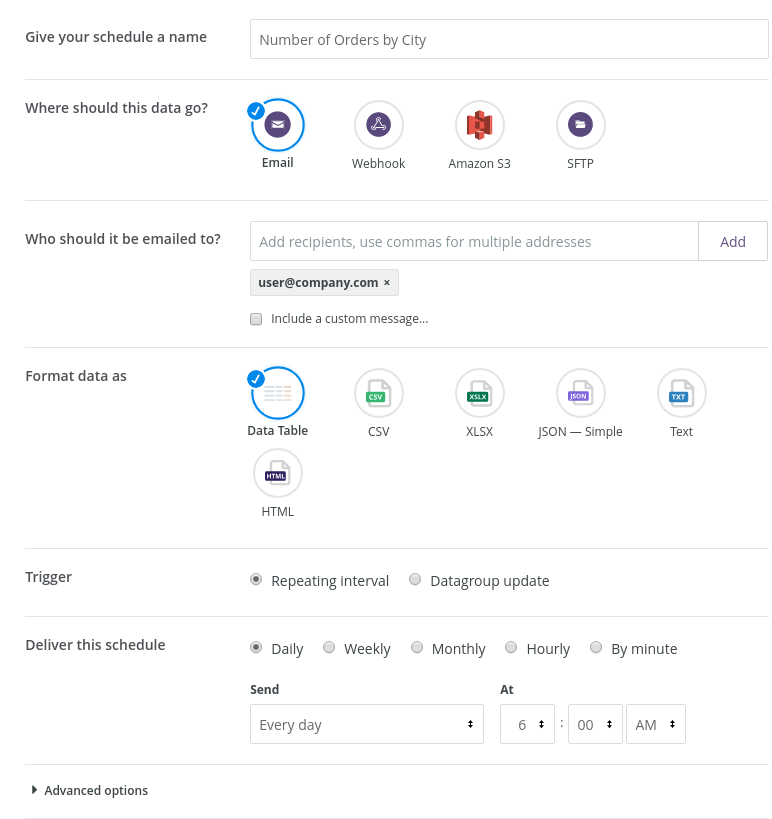
Looker provides a decent range of data delivery targets as shown in the screenshot below. You can send the data results through email, webhooks, Amazon S3 or SFTP servers.
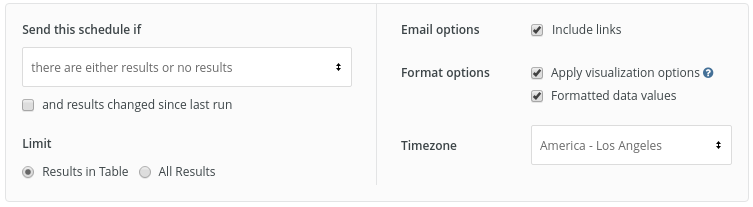
You can even create custom alerts by using Advanced options to only send the result set when it is empty or if the results changed since the last run.
Organization with Looker
Once you use a BI tool for a while, things start to get harder and harder to manage as you start to have a sprawling set of Looks and Dashboards. To make it easier to manage those, Looker provides a feature called Space. A Space is basically a container that allows you to store Looks and Dashboards. A Space can also contain other Spaces, making it possible to create a hierarchical folder structure similar to how a file system works.
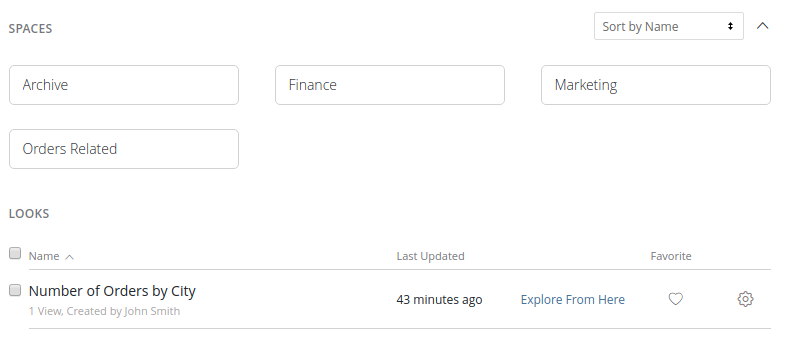
Space is also used for permission and access controls, as detailed in the next section.
Access Control & Permission Management
Compared to other BI tools, Looker has a pretty robust and sophisticated set of features to support access control and permission management. There are 3 types of access in Looker:
- Content access: Control over permissions to access and manage Spaces .
- Data access: Control over which data users are able to view. This is done via access filters.
- Feature access: Control over types of actions an user can do in Looker. This can be done by creating custom roles with specific privileges and assign those roles to specific users.
Looker also has LDAP and SAML integration for companies that have an existing authentication infrastructure. We haven't had the chance to try it out but it is certainly a bonus point if your organization already uses those technologies for authentication.
From Looker's access control and permission management design, we can clearly see that Looker aims to target enterprise customers and businesses with complex needs as its system seems to be an overkill for smaller organizations.
Data Preparation Capabilities
Looker does not provide preparation capabilities, but instead relies on its partners like Stitch or Alooma to provide data pipeline functions. Nevertheless, Looker has something called a Persistent Derived Table (PDT) that can be used for certain data preparation use cases.
PDT is good enough and functional when what you want is to simply speed up your queries by materializing some data in your database. It works like this: First, you set up a derived model, either directly from SQL or by saving a Look to LookML. Then, set-up a schedule for Looker to materialize the data from that model to your database. You can also set-up additional options like the indexing or materializing frequency.
Nevertheless, Looker PDT's options are quite limited as it does not provide incremental and dependent materializations like the ones offered by Holistics or dbt.
Pricing
Looker doesn't have a free trial and does not provide a public pricing on their website but chooses to offer a custom tailored model instead. The final price will depend on multiple factors including total users, types of users (viewer vs. editor), database connections, and scale of deployment. According to a third party site, Looker's pricing starts from $3000-$5000 a month for 10 users with an additional $50 a month for each new user. This is similar to traditional enterprise pricing structures and thus may not appeal to prospects who are familiar with a predictable and transparent SaaS based pricing.
For more details about Looker pricing, check out: How Much Does Looker Really Cost? A Detailed Explanation
Customer Support
We don't have direct experience with Looker's customer support, but based on the reviews and conversations with a few Looker customers it seems Looker's support experience is responsive and helpful.
However, it's been reported that Looker support quality has degraded since Google Acquisition.
Personal notes on Looker's approach
Looker's approach to data modeling is unique, innovative yet not without downsides. It is characterized by two things:
- It leverages the power of modern data warehouses instead of building their own storage layer, eliminating the need to load data into its own proprietary engine. This provides two benefits: full access to row-level raw data and elimination of the hassle of managing loading/refreshing data. Users are assured that the data, when queried, is updated. On the other hand, this approach is a double-edged sword as it means query performance depends entirely on the underlying data warehouse and is not predictable or standardized from the point of view of Looker users.
- Its use of LookML and Git integration means the data team has a centralized, version-controlled, single source of truth for data modeling logic. This makes the data modeling process much more maintainable and reusable. The downside is the steep learning curve of the language and the long feedback loop of the data modeling process.
Conclusion
Looker is an innovative BI product with its unique approach to data modeling. It is great for experienced data teams that have complex data models and appreciate maintainability and reusability.
Here are the few key points:
- Its use of LookML provides a steep learning curve, yet provides a maintainable and reusable data modeling layer.
- Drilldown ability is decently powerful and easy to use once you are familiar with LookML.
- Looker does not have its own storage layer but instead relies on customer's data warehouses.
- Looker, in essence, is a SQL query builder engine that converts business users drag-and-drop inputs into SQL queries.
- Looker provides highly flexible and sophisticated access control and permission management, sacrificing simplicity for power.
- Looker has limited data preparation capabilities compared to other tools, delegating this task to its partners to provide these capabilities.
What Data Practitioners Said About Looker
In case you need a second opinion or more reviews from other data leadrs and practitioners, check out these communities where you can find more nuanced, varied takes on Looker BI.
Here are some of the common sentiments about Looker:
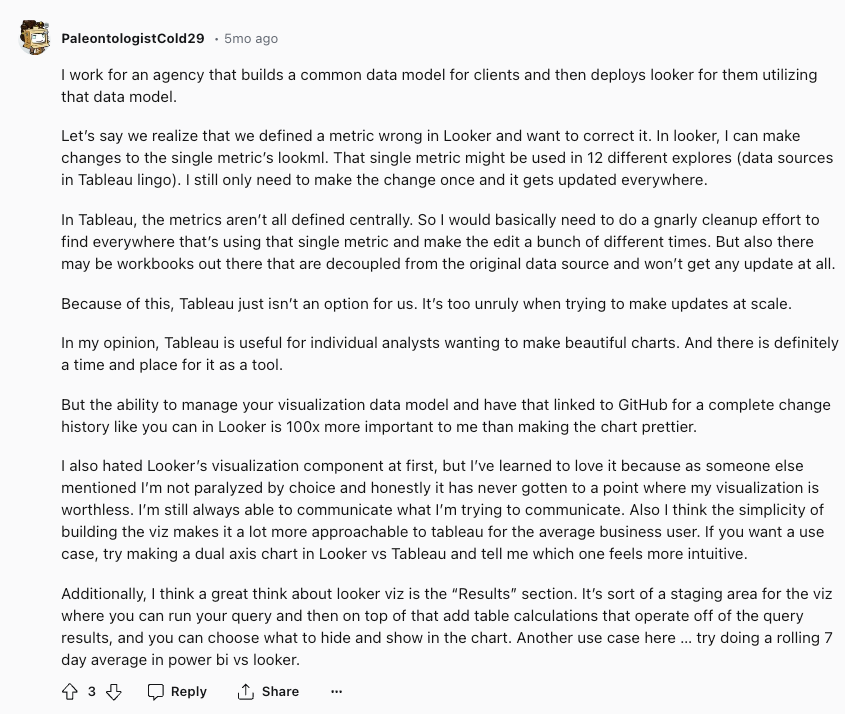
"Only need to make the change once and it gets updated everywhere"
With LookML, data team can bring DevOps best practices to their analytics workflow - version control, CI/CD, bulk refactoring, making it easier to reuse code such as explores, or other logic in the semantic layer.
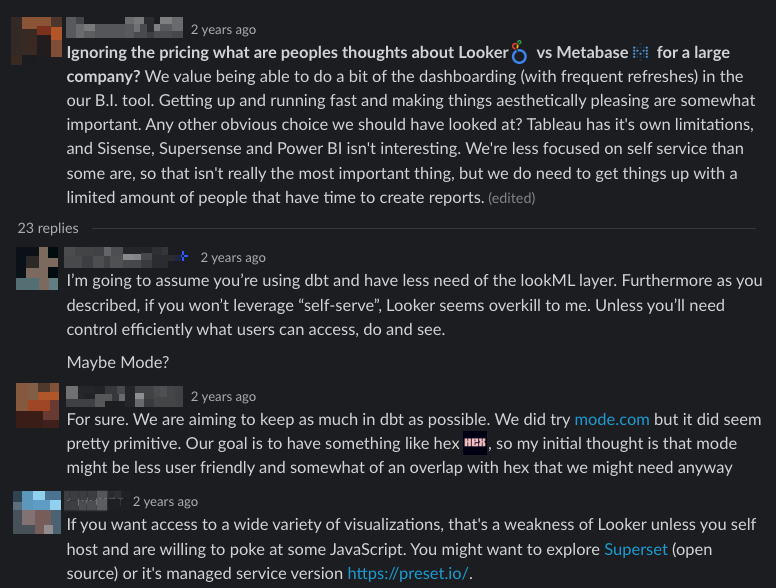
"Looker seems like an overkill if you have less need of LookML layer and self-serve capability"
"Looker product development is getting slower after Google Acquisition"

References
LookML Terms and Concepts
Looker Reviews 2019 | G2 Crowd
More Powerful Data Drilling
A Short Guide to Understanding Looker Pricing and Capabilities
Access Control and Permission Management
Organizing with Spaces
Merging Results from Different Explores
Using Derived Tables
Looker vs. Tableau: Pricing and Features Comparison
Looker Embedded Dashboarding - A Practitioner's Review
What's happening in the BI world?
Join 30k+ people to get insights from BI practitioners around the globe. In your inbox. Every week. Learn more
No spam, ever. We respect your email privacy. Unsubscribe anytime.
