Hire Your Data Analysts First
Let's say that you're running a fast-growing company, and you've reached the point where you want to start getting serious about your business intelligence.
You have user behaviour data from your website, financial data stuck inside your accounting software, and marketing performance data locked inside both the Facebook ads and Google ads consoles. You want to pull the data from these sources into one place, so that you may analyse it and act on it.
What do you do?
Up till very recently, you would be told to go hire a bunch of data engineers as a first step. These data engineers would then go to work, picking all the various parts of a traditional data analytics stack:
- A data warehouse.
- An ETL tool.
- Some sort of reporting software, preferably with the ability to run on top of really performant OLAP cubes.
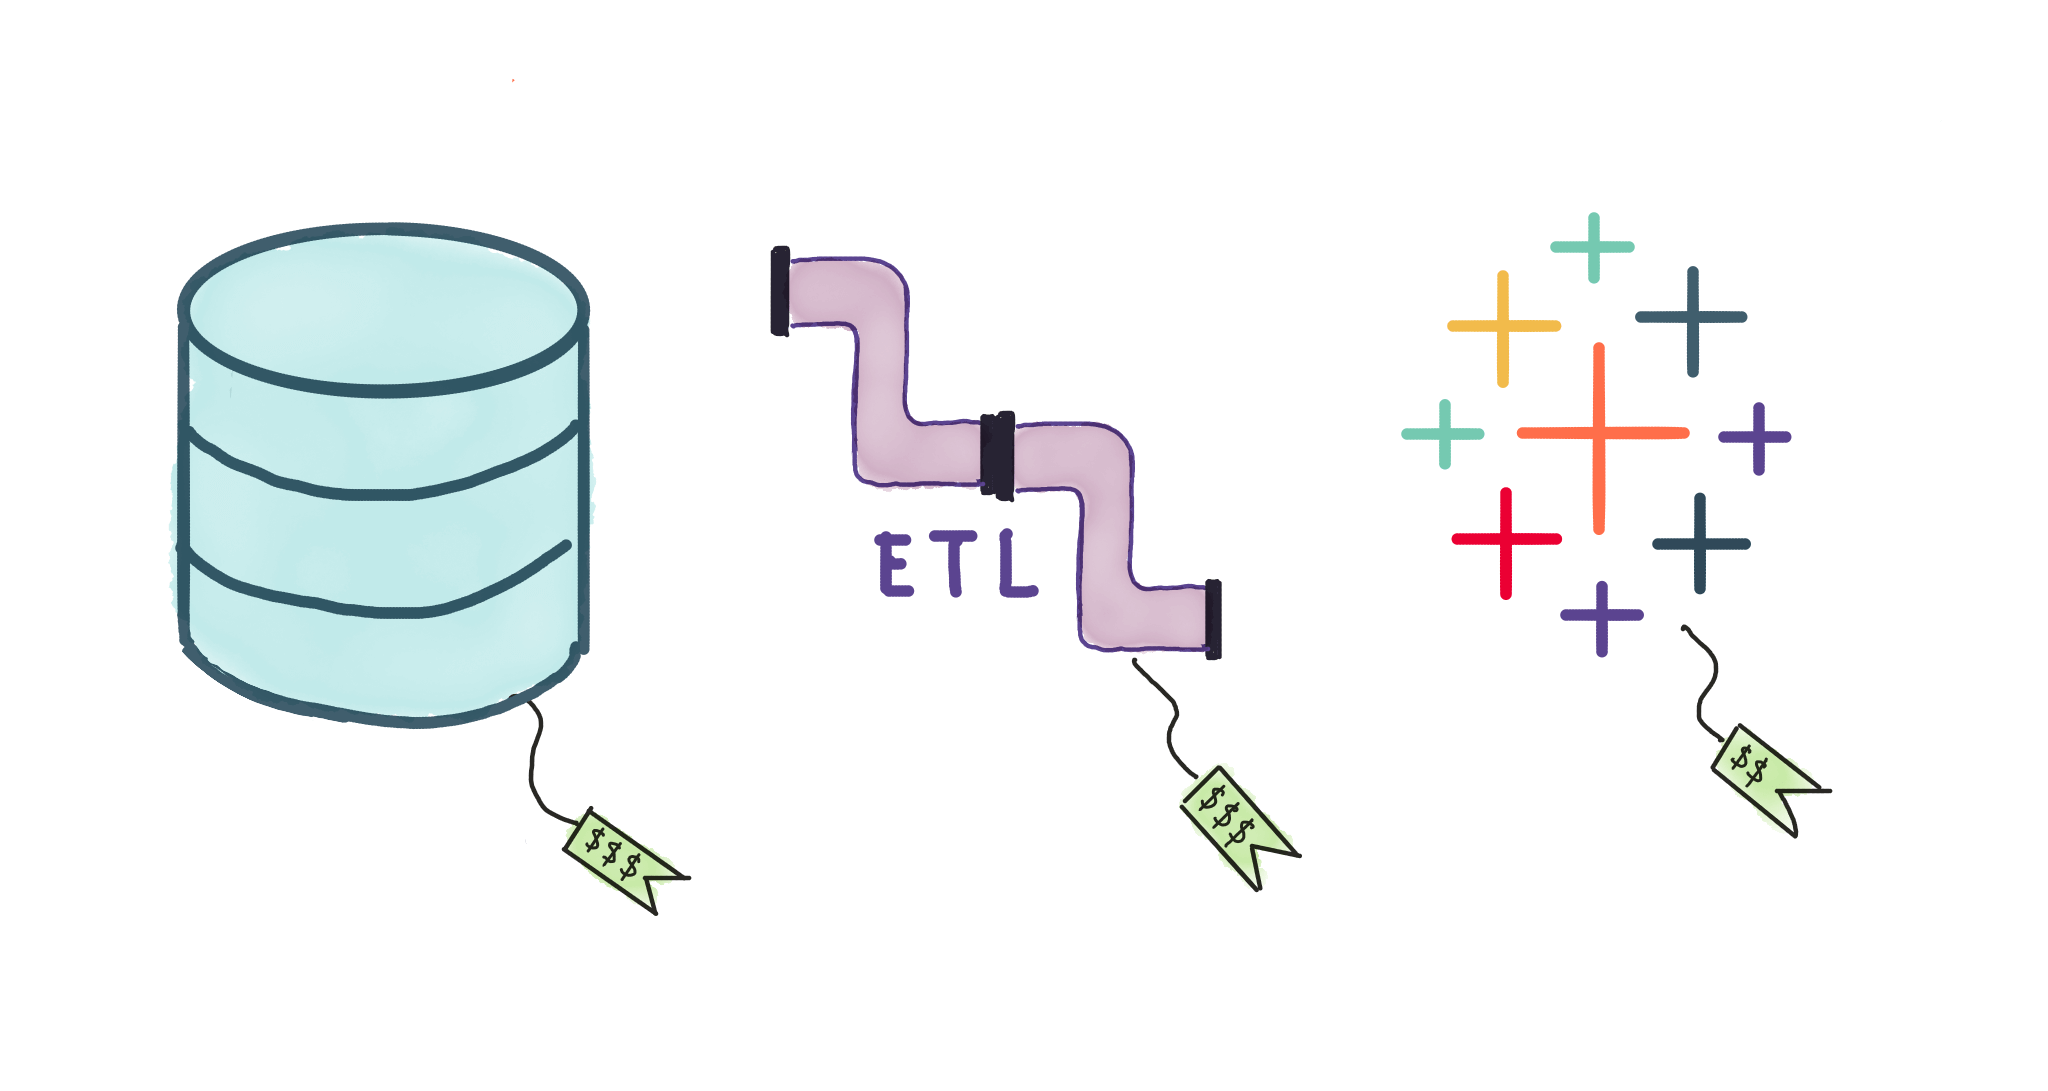 Traditional business intelligence tools. Traditional cash spend. $$$$$
They would then evaluate a few tools based on their experiences and preferences, and then make a couple of recommendations based on your budget and their confidence working with such tools.
After you've decided on procurement, your data engineers will then spend a few weeks setting up the pipelines for your analytics, writing code to ingest data into your warehouse, and crafting perfectly tuned OLAP cubes so that your analysts can write sweet, performant reports in your chosen reporting software.
If this story sounds like you, and if you're about to embark on this journey today, then this article is right up your alley.
Because you shouldn't do this. Seriously, just don't.
Here's why.
The Problems With The Traditional Approach to Business Intelligence
The problem with the old approach to business intelligence is that it is incredibly expensive and incredibly slow.
Why is this the case? Well, for starters, you're going to have to pay for all those tools and all those data engineers. Infrastructure and labour costs are rarely cheap.
But the deeper problem is this: you're spending so much time and money integrating a hodgepodge of expensive tools because you believe that your future data analysis will require all the engineering work you're doing today.
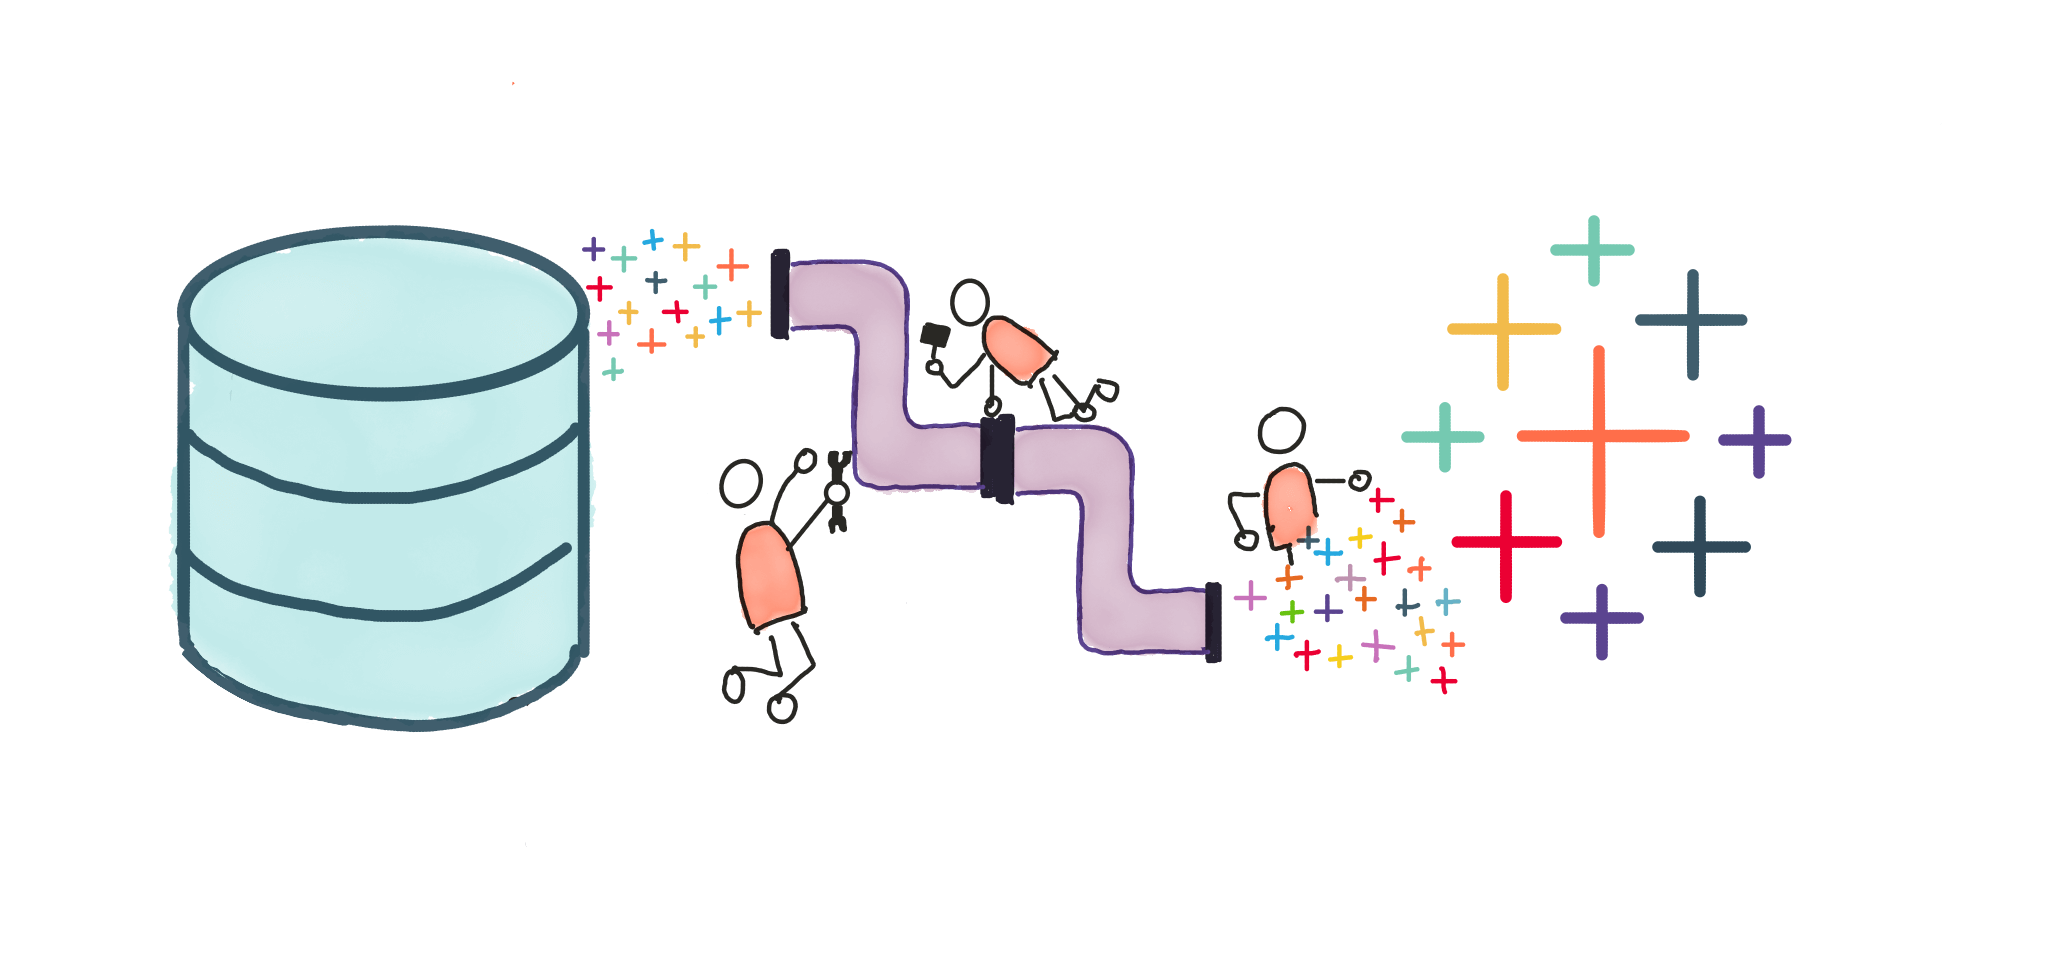 Waiting for your data engineers to build everything first is basically setting fire to a pile of money
This is nearly never the case. If there's one thing that we've learnt from the past three decades of software engineering and digital transformation, it is that expected usage always differs from actual usage.
Perhaps it turns out that your company wants to analyse marketing data more than it does financials (which means you've wasted time writing the code to connect to your financial software). Or you realise that the two weeks you spent building perfectly designed OLAP cubes for operations was wasted, because your ops people now want reports that draw from a different subset of data.
These stories are a dime a dozen in the BI space. And they've been accepted as 'the way things are' for about as long as BI has existed.
In the past five years, however, things have changed.
The Modern Approach to Business Intelligence
We know that there's a better way forward because software engineering got there first.
After a decade or so of inefficient effort, the software community began adopting 'lean', or 'agile' methods of development, drawn from the principles of production in manufacturing.
Agile teams start by building a small, initial version of software for internal use. Then, guided by actual usage, these teams would quickly iterate and build out the rest of the software offering. Digital transformation done this way turned out to be a lot cheaper and a lot more effective, as developers would only build software in response to actual business use.
Work backwards from actual usage, instead of forwards from upfront development.
In business intelligence, an equivalent approach means working backwards from actual usage, instead of forwards from upfront development.
Concretely, this means that you should hire your data analysts first. They are the end-user of your data stack. Don't start with building out your infrastructure: instead, seek to use small, reasonably-priced, off-the-shelf tools to empower analysts to extract answers from your data.
Actual usage from analysts makes your infrastructure requirements crispier. As business people in your company get used to data informing their decisions, their questions and report needs will drive the evolution of your stack. You will see certain workflows take shape — which is what you need to know to go out and look for other tools in order to augment your offering.
This approach is faster, more efficient, and perfectly adapted to the cloud-first computing world that we live in.
What does this stack look like in practice?
To give you a better idea of what this stack looks like, here are three examples, drawn from real-world business intelligence use cases.
Holistics with a Cloud Data Warehouse
The first example is biased (given our background ;-), but is used by hundreds of real-world customers. Want a data department? Purchase Holistics with a cloud data warehouse like BigQuery, Redshift, or Snowflake.
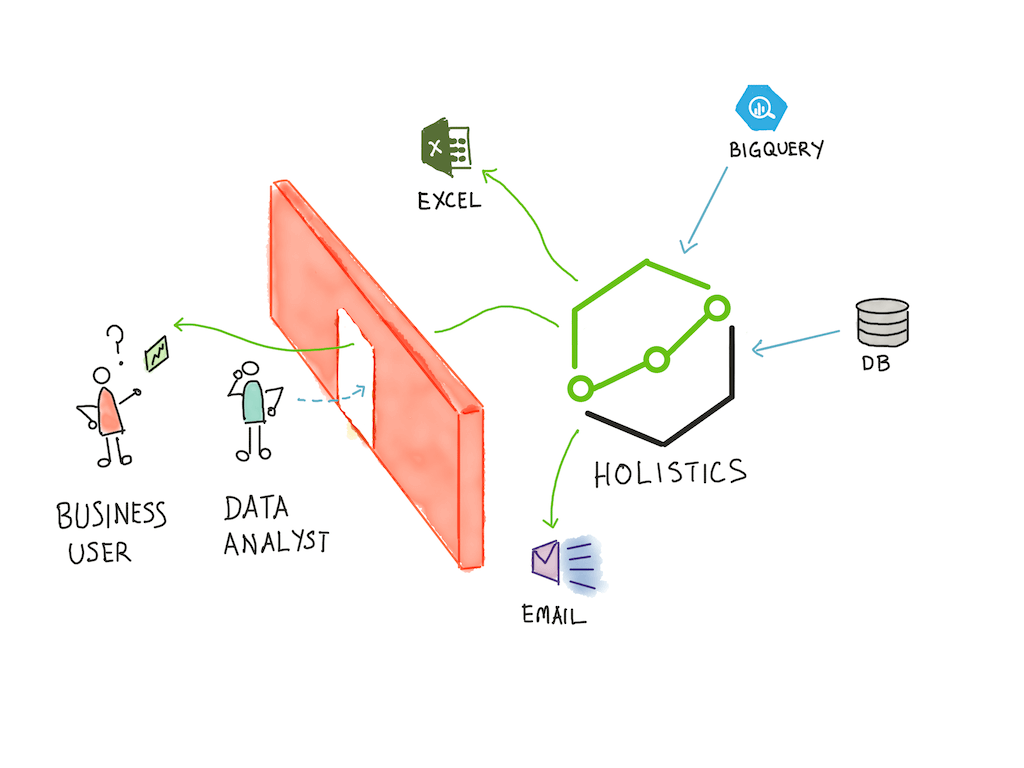
Holistics comes batteries included: it's able to do ETL, modeling, reporting, access control and delivery, all in one tool. You connect Holistics to your data warehouse, and then use our data connectors to ingest data for analysis ... from Google Ads and Facebook Ads and a few other sources besides.
Later, as it becomes clearer what your data analytics use cases are, you may augment your stack with additional tools like Tableau or Fivetran — whatever your team decides is necessary to deliver business answers quickly and accurately.
BigQuery with Fivetran and Google Data Studio
Here's an alternative setup: use a data warehouse like Google's BigQuery, ingest data into it with Fivetran, and then use a free tool like Google Data Studio to empower your data analyst to explore, pivot, visualise and export tabular data for your business people.
This is an incredibly cost-effective way to get started with data analytics — BigQuery is pay-as-you-go, Google Data Studio is free, and Fivetran saves you the pain of hiring data engineers in order to write custom pipelines for data ingestion.
Unfortunately, this setup requires you to manually transform or aggregate data through queries written and run in GDS, which means it isn't particularly scalable. But it remains a fundamentally analyst-oriented setup.
Cloud Data Warehouse, dbt, Fivetran, and chartio
A more complex but complete setup is to pair a cloud data warehouse (Snowflake, BigQuery, or Redshift) with dbt (a transformation and modeling tool) along with Fivetran for data pipelines and chartio for reporting.
This is more expensive — you're dealing with four different vendors, instead of two — but it is a complete solution. dbt gives you data transformation capabilities; Fivetran saves you engineering time, and chartio gives you great data reporting.
This is still an analyst-first setup, though you might need to borrow a software engineer from within your company just to set everything up once (which, in our experience, takes about a week).
(Biased comment: ... or you could, you know, replace dbt and chartio with Holistics.)
The Conclusion
We're obviously biased here, because we believe buying an all-in-one tool is a better approach for most companies. But the truth is that the principles we've expressed in this post are more important than the actual tools that you eventually choose to implement.
The core idea is this: don't build ahead of actual usage. Instead, hire data analysts first, and work backwards from their workflows in response to real business requirements.
The time you spend and the dollars you pay for cloud offerings is far cheaper compared to the thousands you'll burn and the months you'll give in order to have data engineers glue tools together, ahead of usage, within your stack.
The new cloud-first approach might not have been possible five to ten years ago, but it's certainly doable today.