Composable Metrics: Rethinking Self-Service Analytics

Contents
“Without self-service, your analyst is the service.”
The biggest problem we're trying to solve at Holistics is self-service. That means empowering business users to answer their own data questions without constantly needing to ping data teams. We think this problem deserves a thoughtful solution, one built into the core of our tooling.
Let’s walk through why this matters.
The Analysts Are The Bottleneck
Imagine you're Bob, a data analyst. One day, a business stakeholder—let’s call him Adam—asks for a sales breakdown by product.

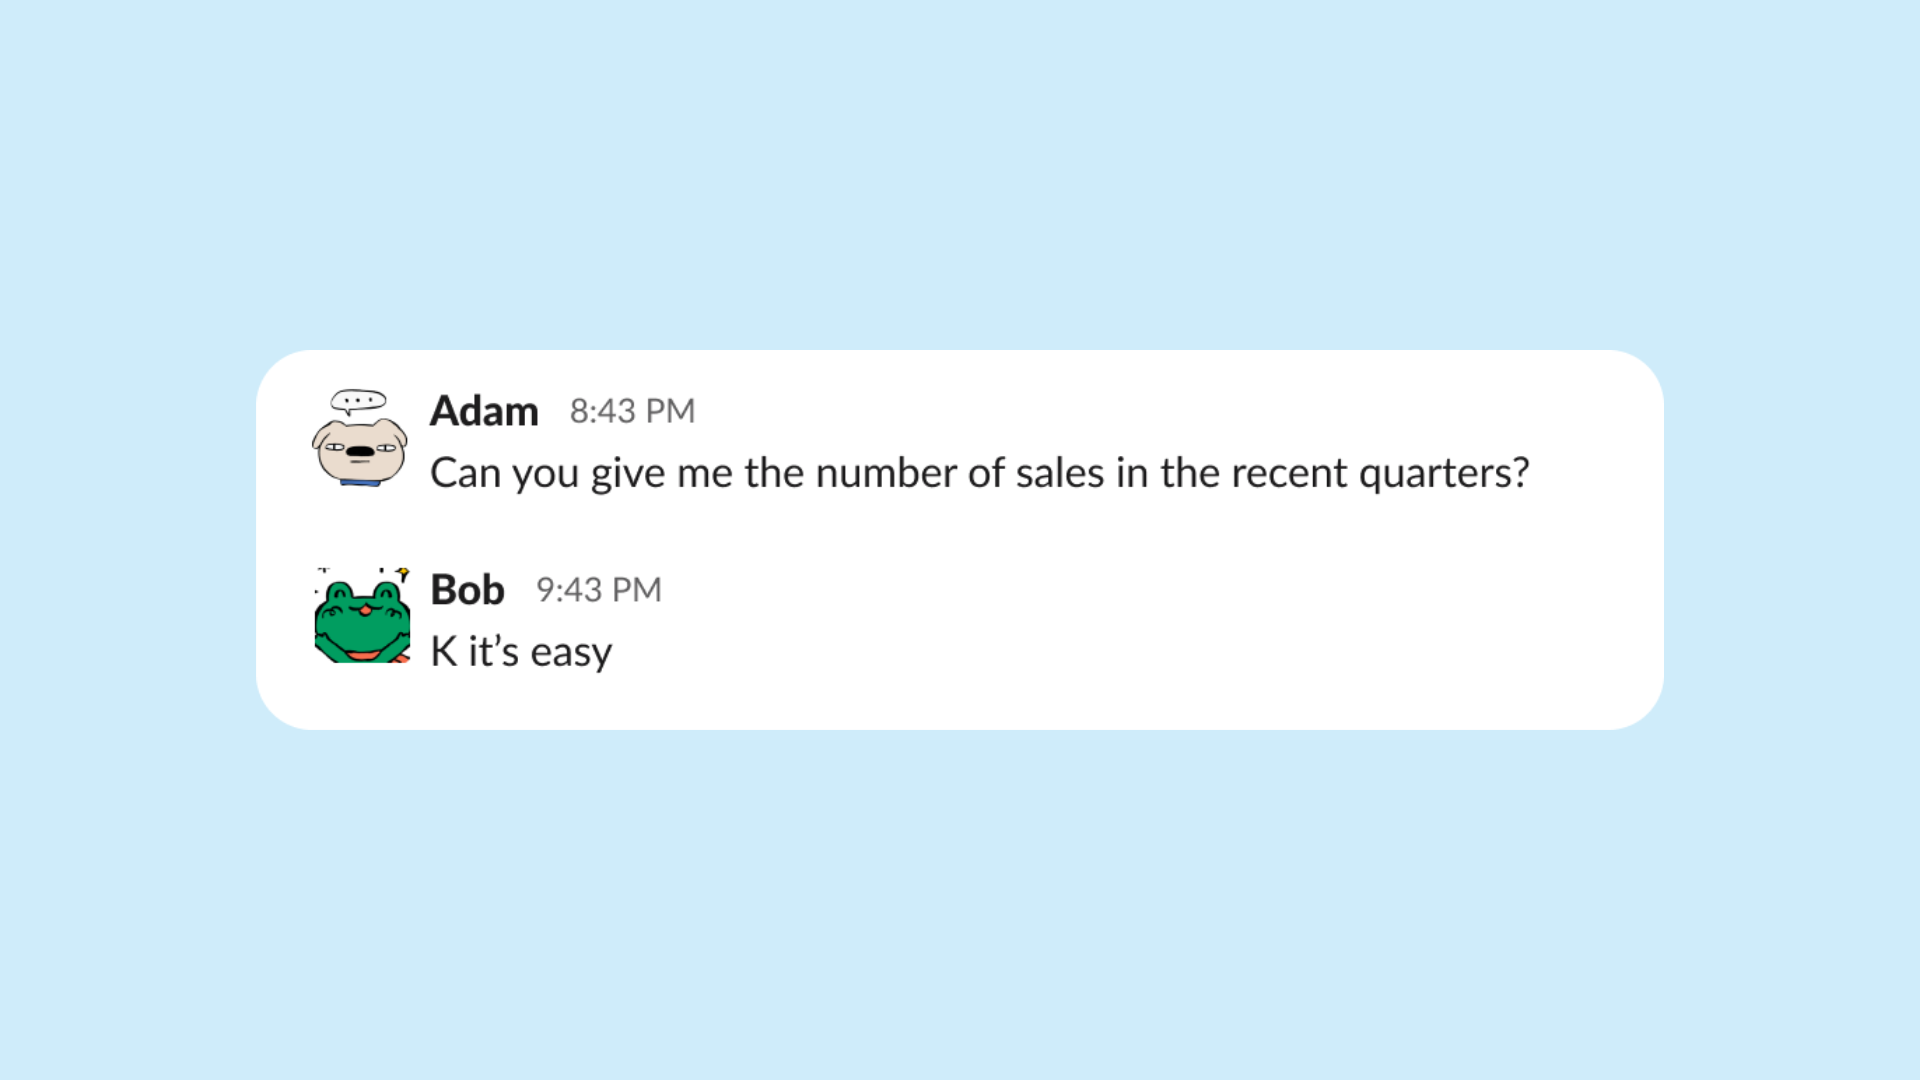
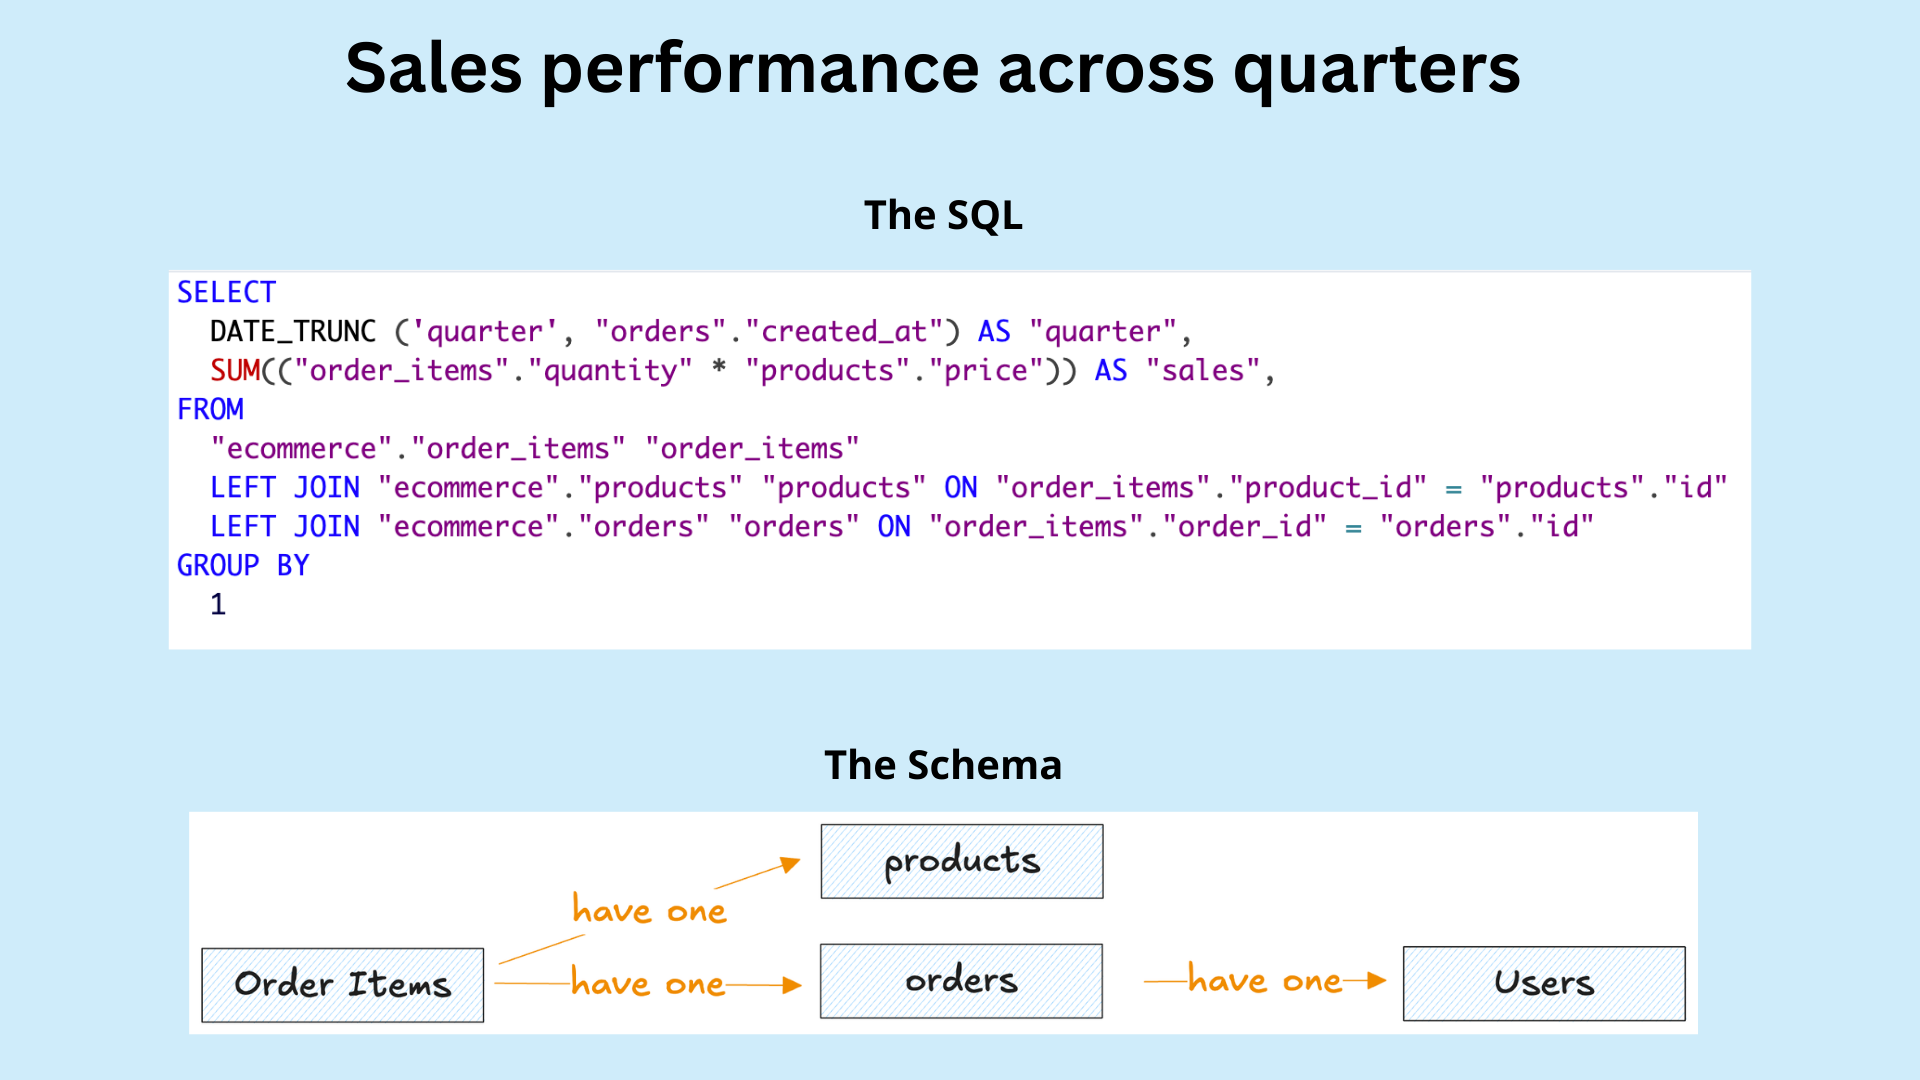
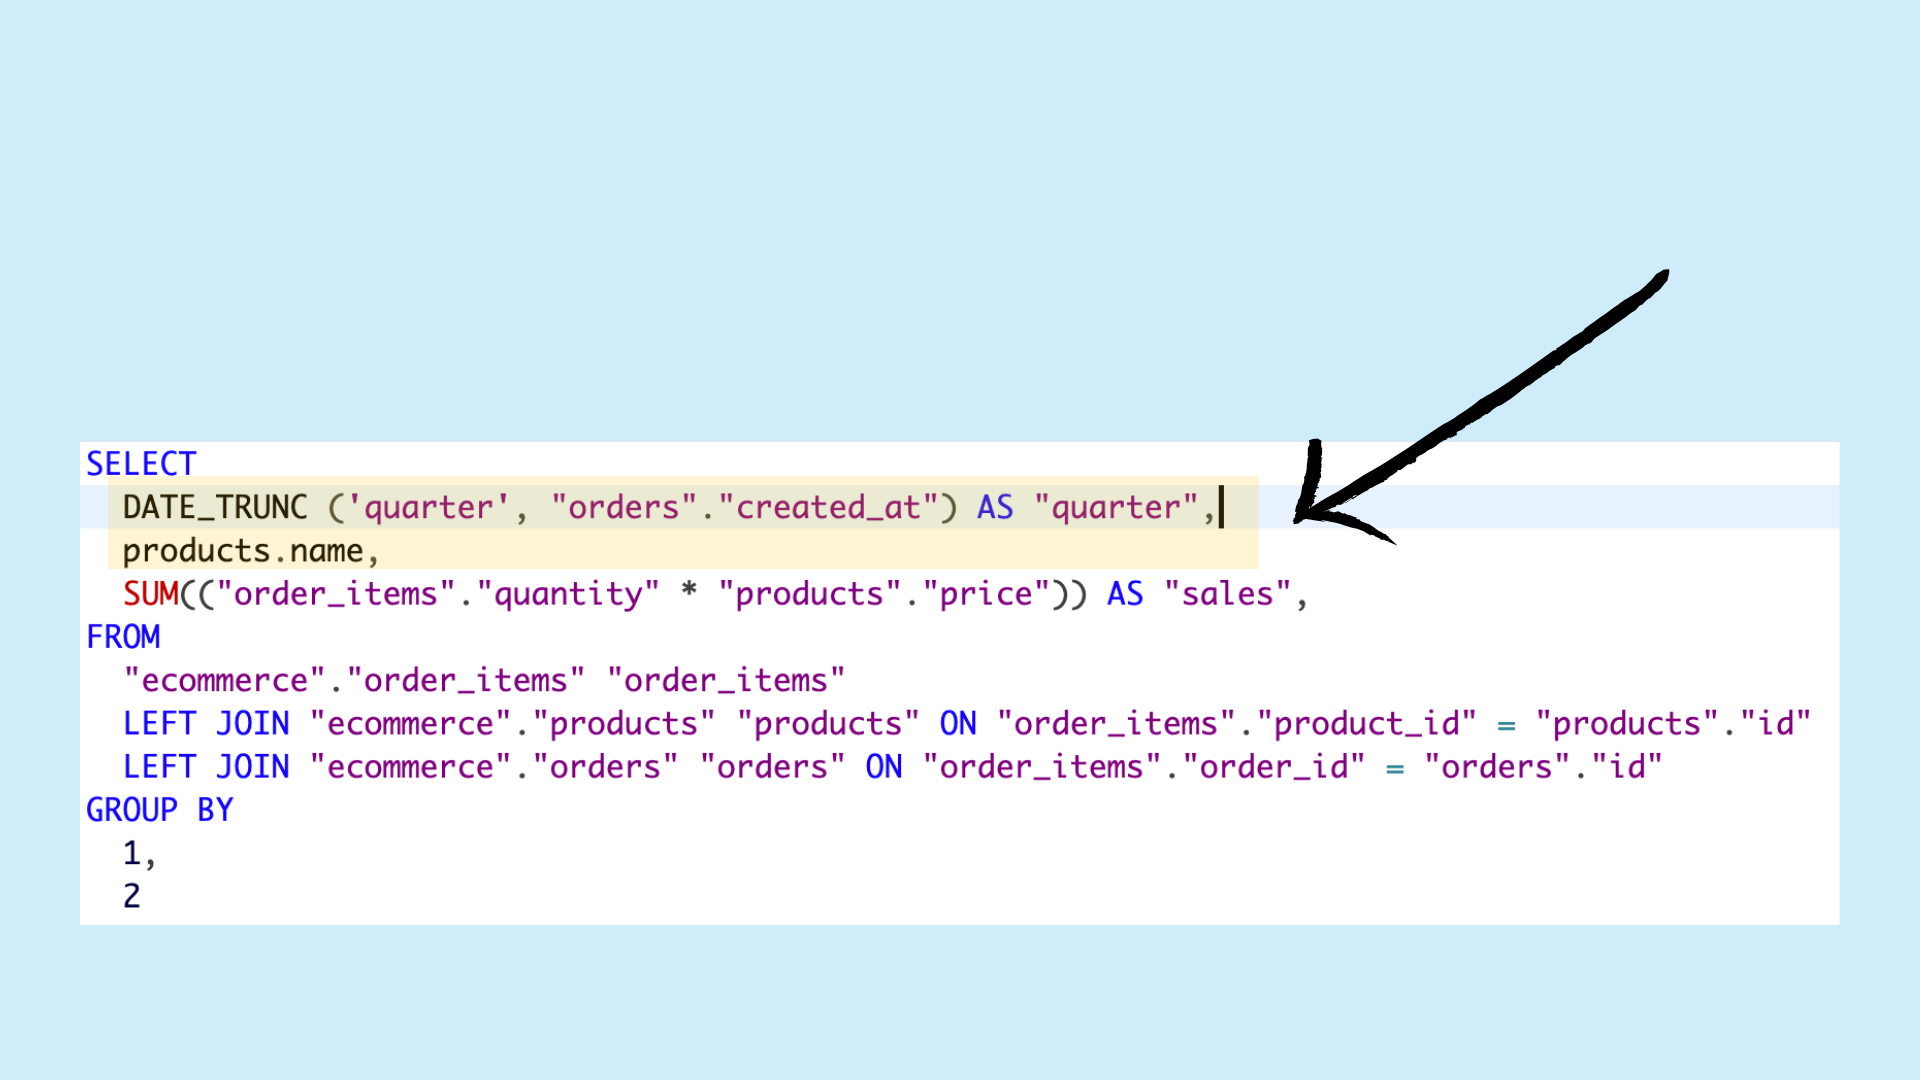
Easy, right? You write a quick SQL query joining order items with product data, multiply quantities by prices, group by quarter, and done.
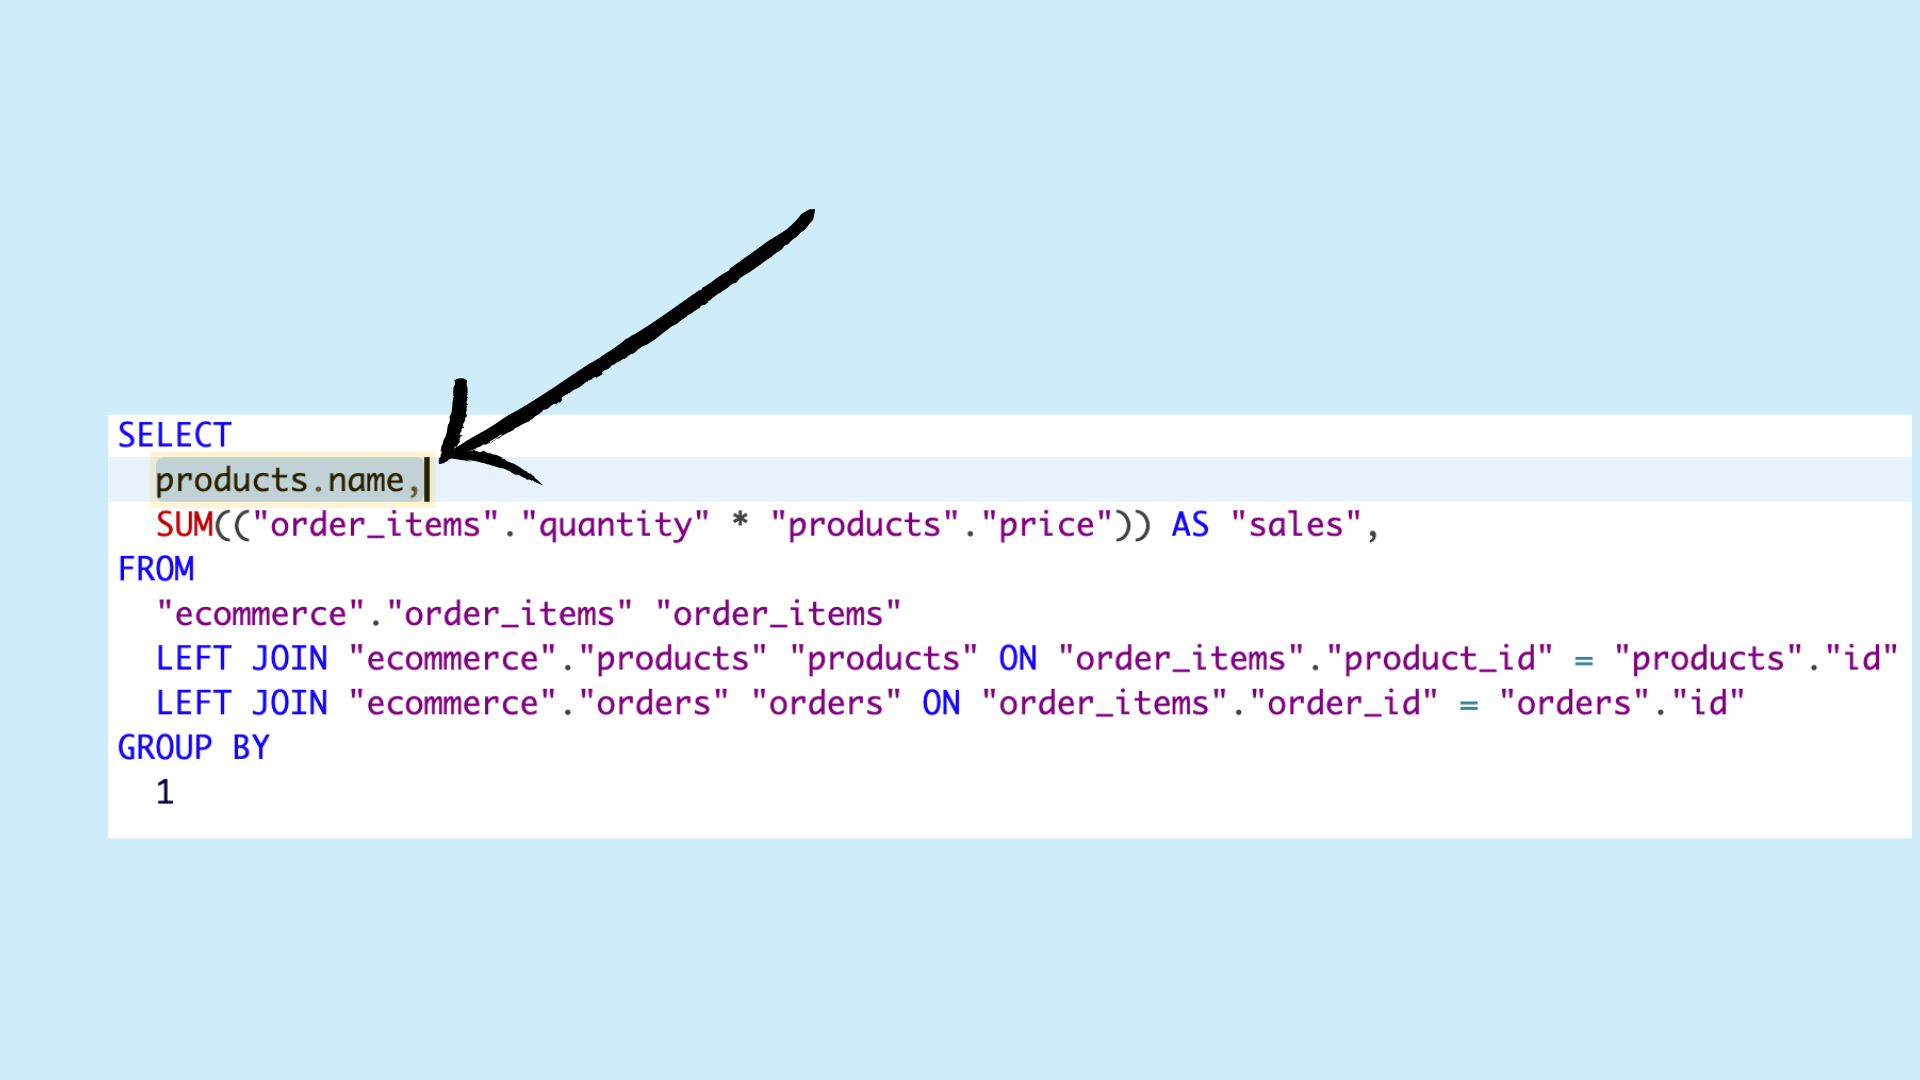
But wait, Adam actually wants sales by product name. So you write another query.
Actually, he clarifies. He wants sales by both quarter and product name. You both speak English, but now it sounds like two different languages. More SQL.
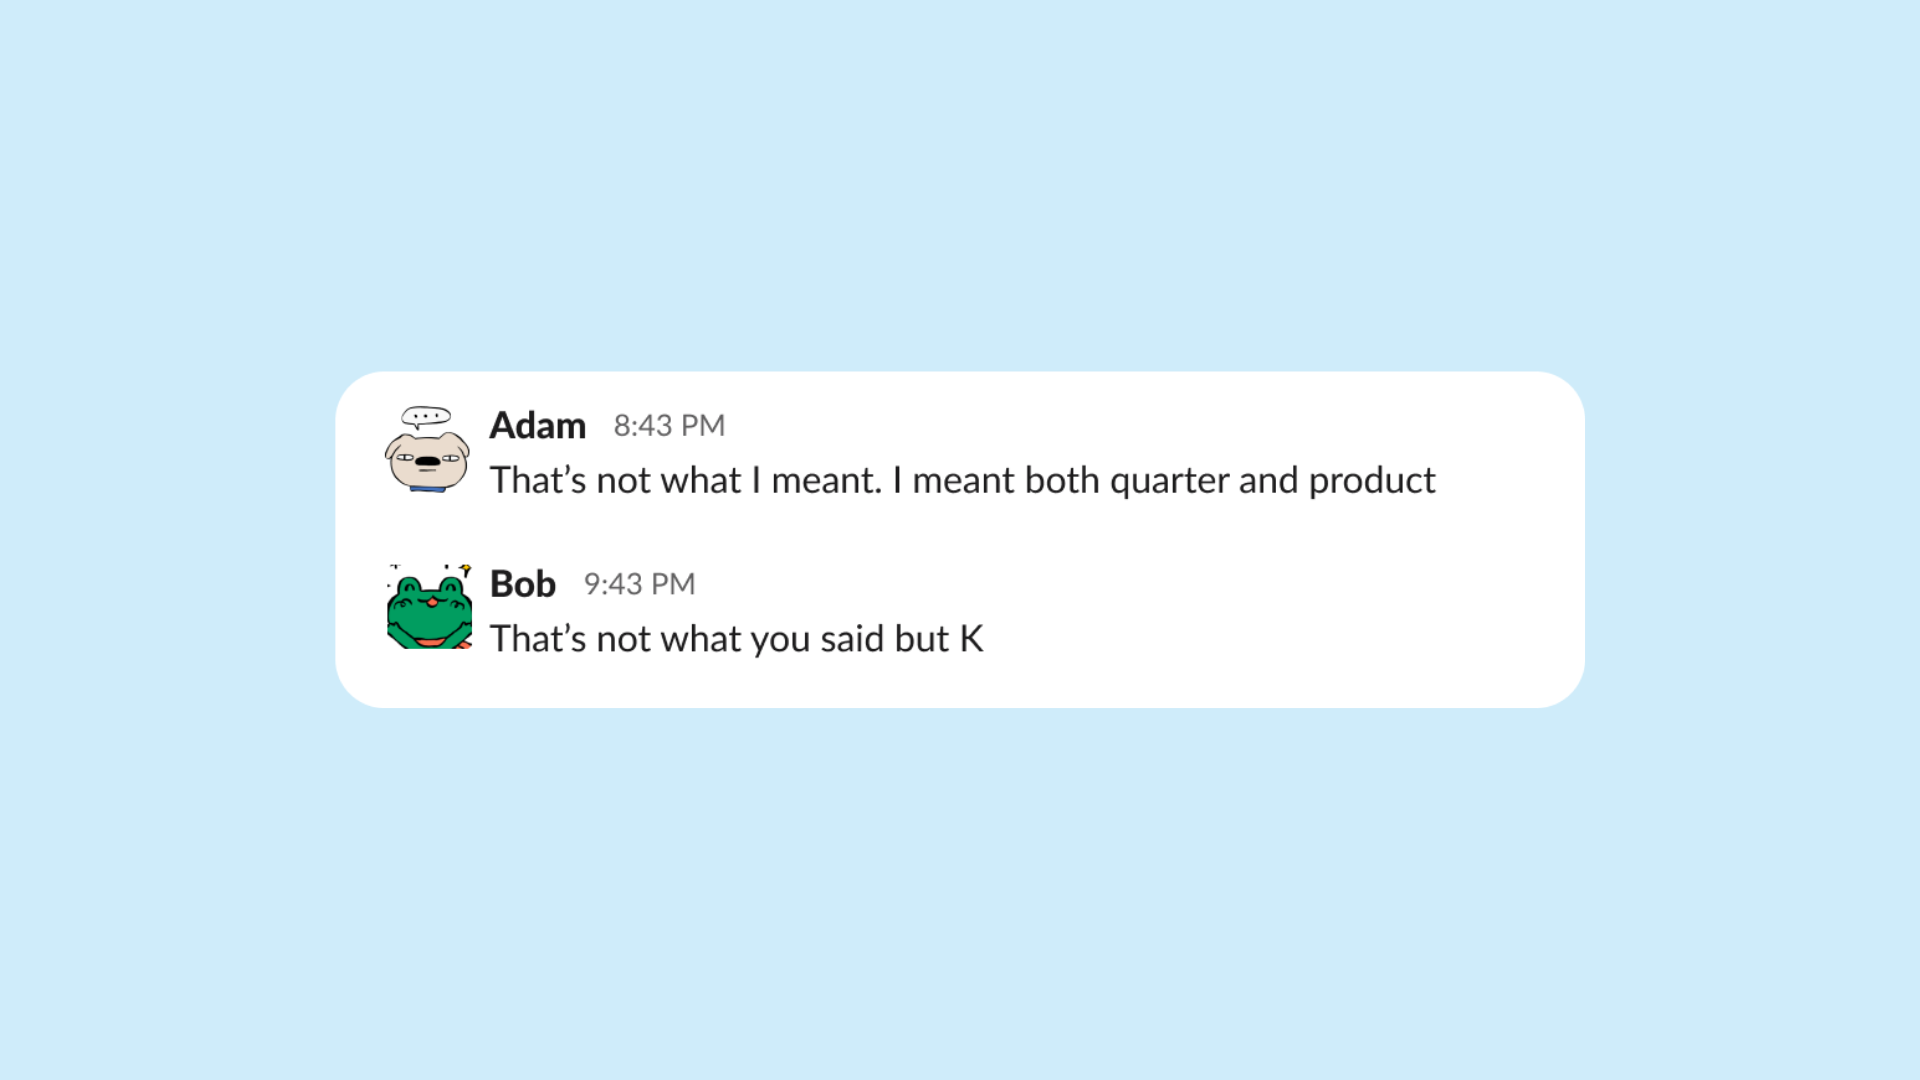
This loop repeats endlessly.
Bob becomes a human SQL generator. Not exactly fulfilling work. As a data analyst or data engineer, you want to work on more fulfilling parts of your job—optimizing pipelines, doing ML—not just being pinged to answer trivial, repetitive questions

Without Self-Service, Analysts Are the Service
This is the core problem: every question from a business user requires analyst involvement. There's no self-service. We need a way for Adam to answer his own questions. That’s where the self-service layer, or what we call the semantic layer, comes in.
What Is a Semantic Layer?
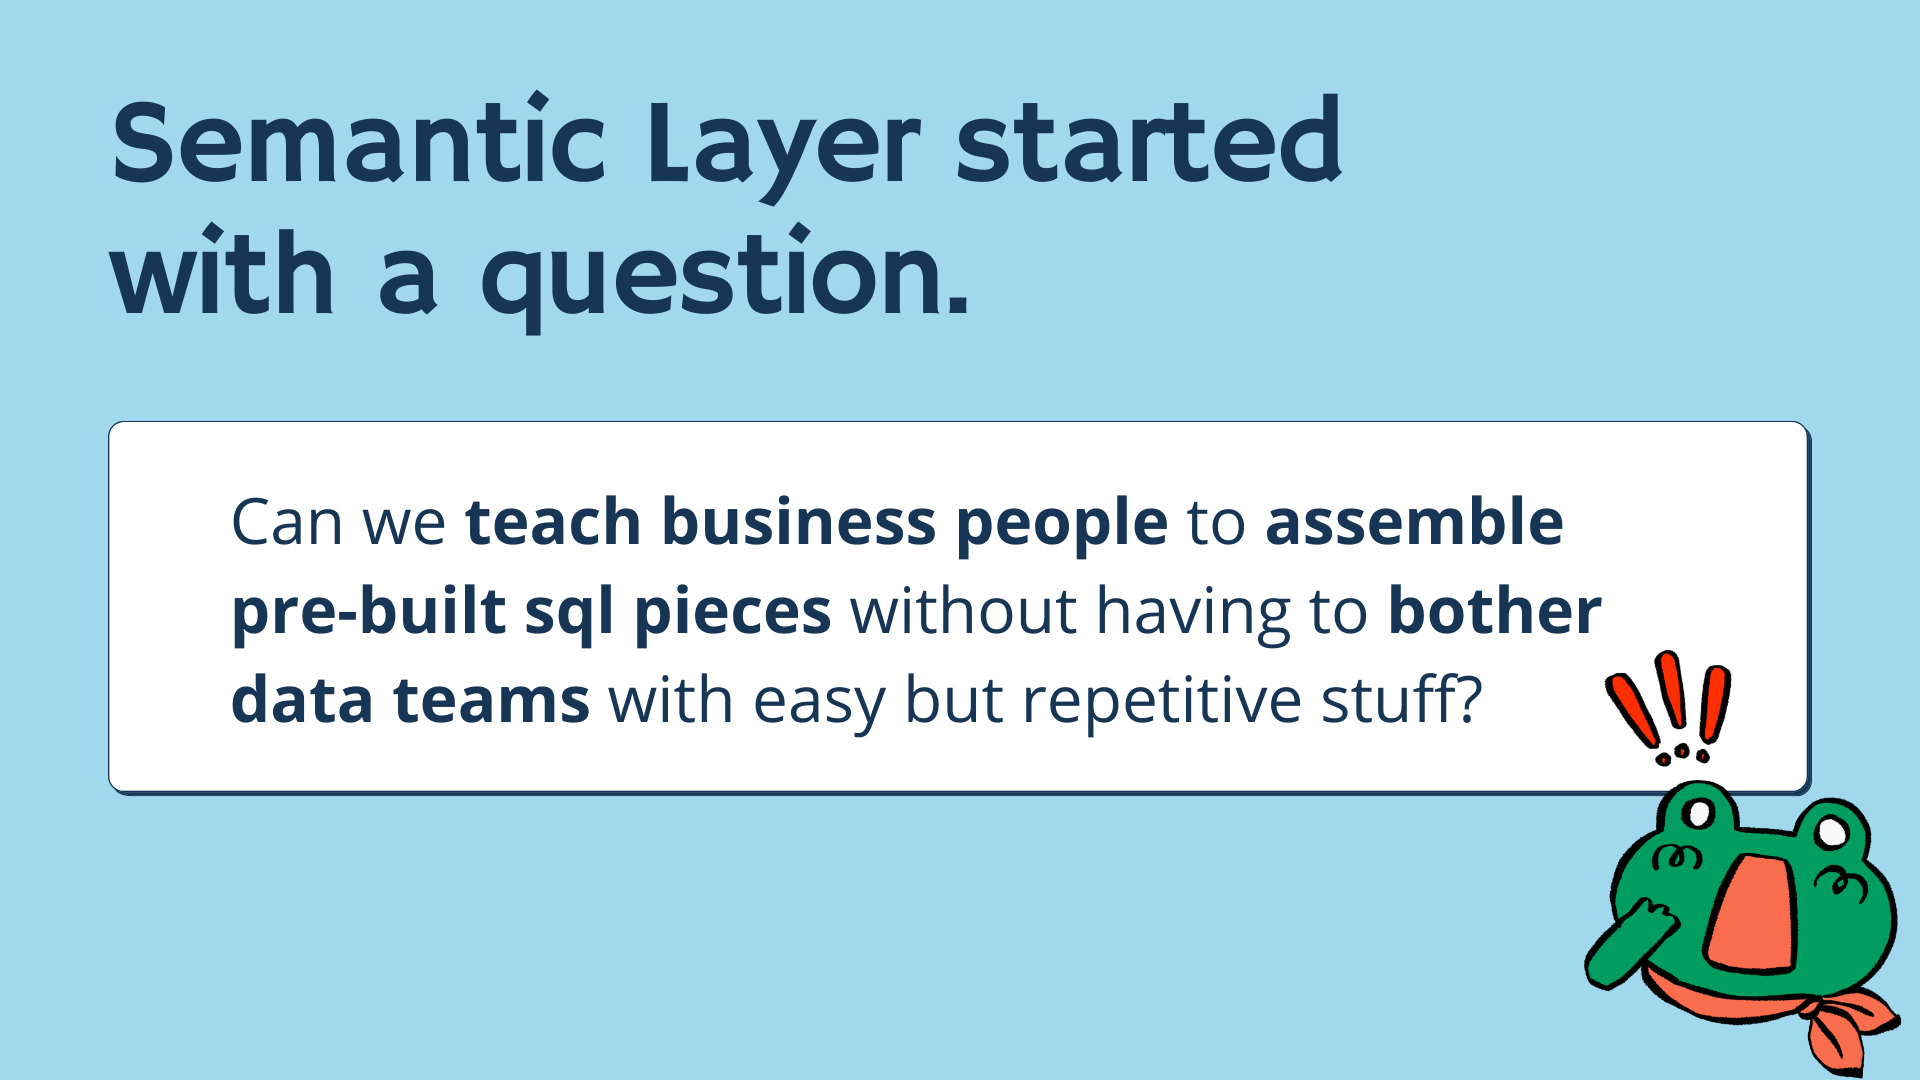
The semantic layer started with a very simple question: Can we teach business people to access previously simple pieces without having to bother the data teams with easy, repetitive stuff?
This is the crux of the problem and the question the semantic layer seeks to solve.
At a high level, the semantic layer is a business-friendly abstraction that sits between raw data and the end-user. It simplifies the experience of exploring data.
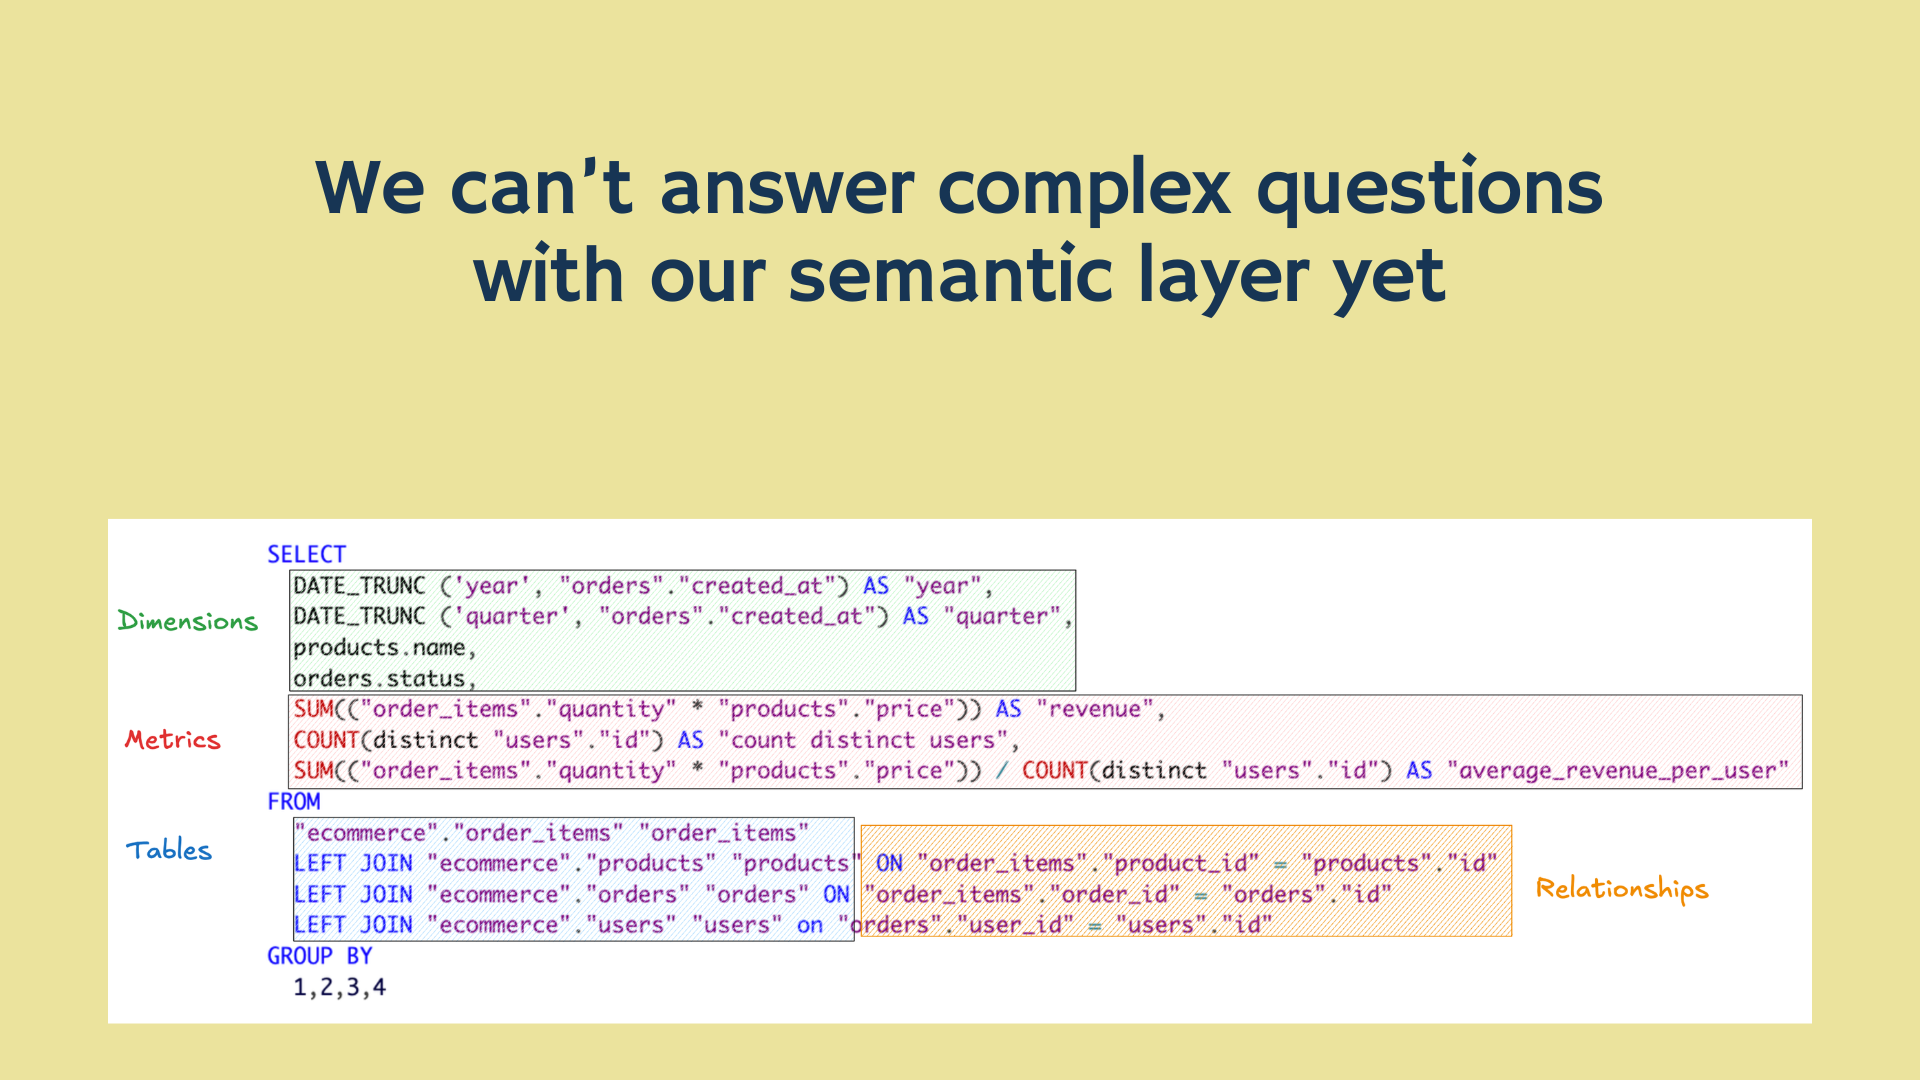
My mental model for a semantic layer is pretty straightforward:
- Tables (like
orders,products,users) - Join conditions between them
- Aggregations (aka metrics)
- Groupings (dimensions or attributes)
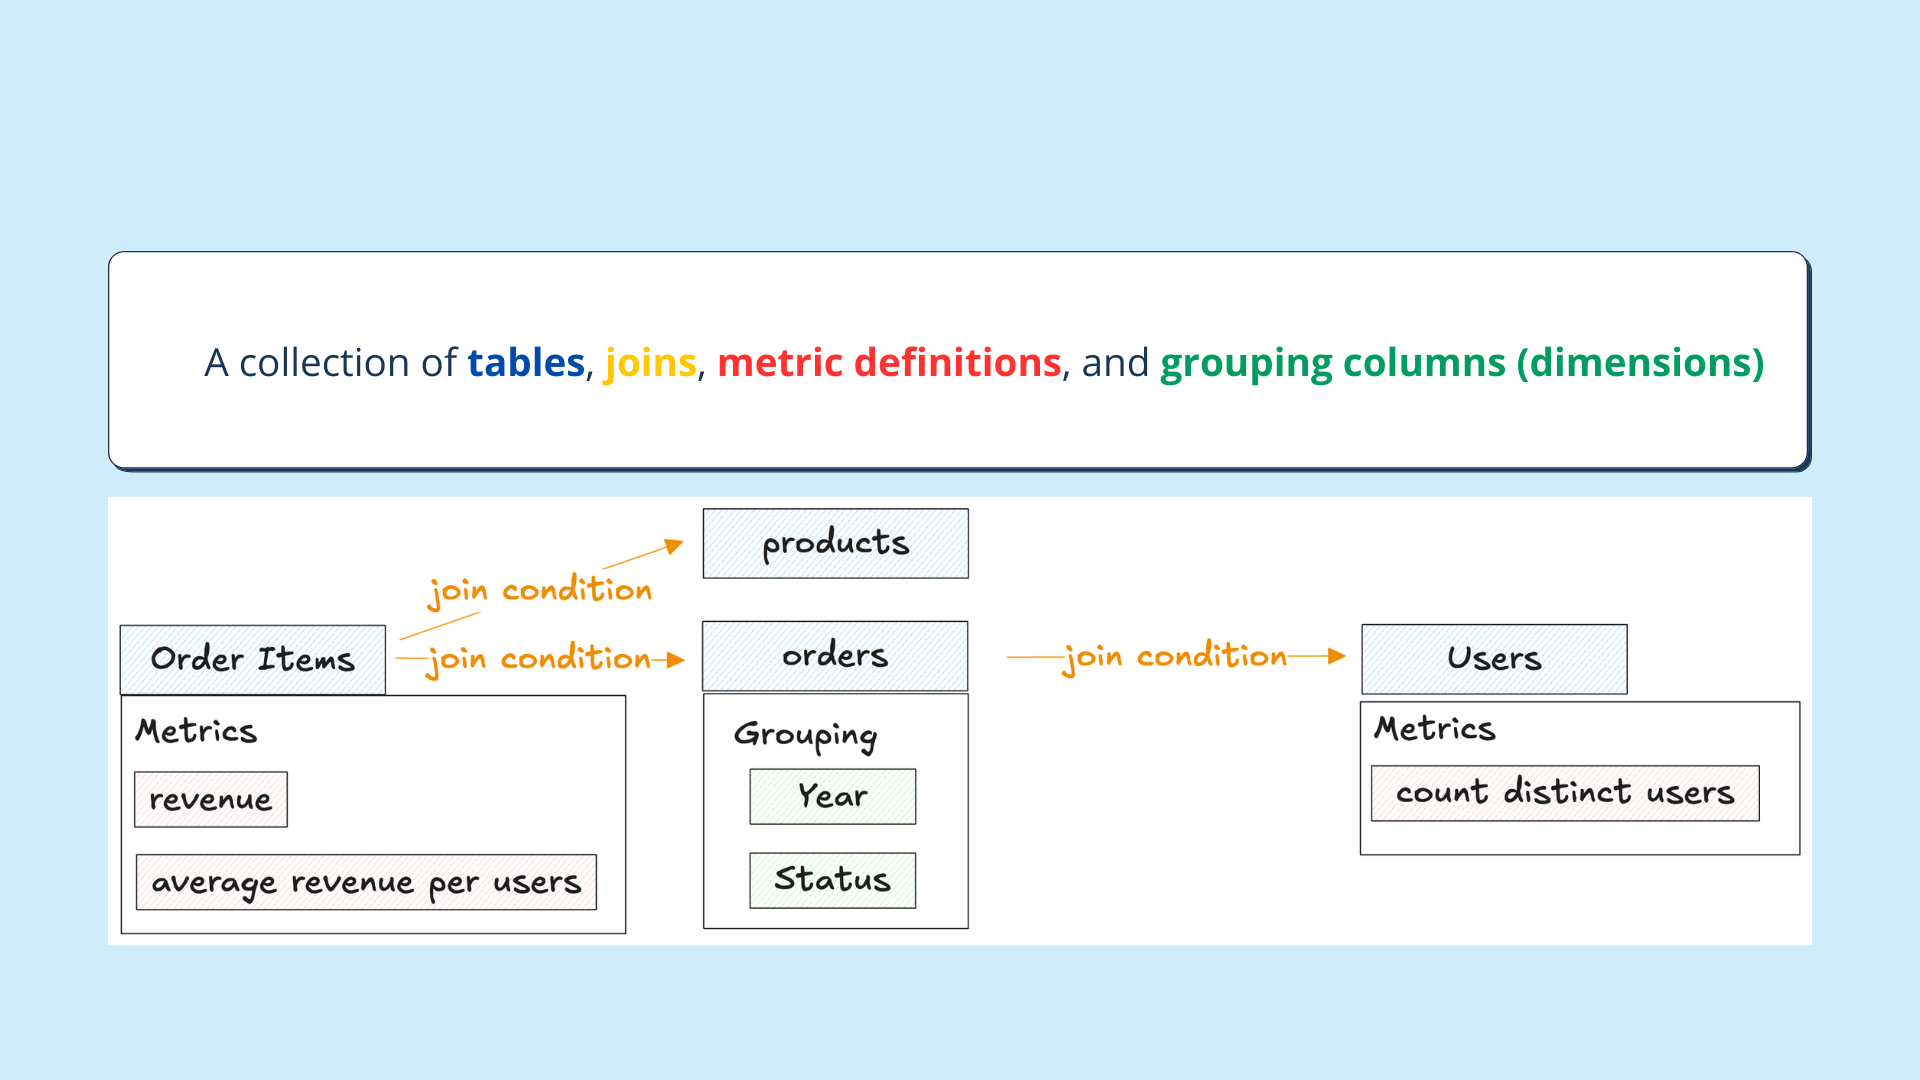
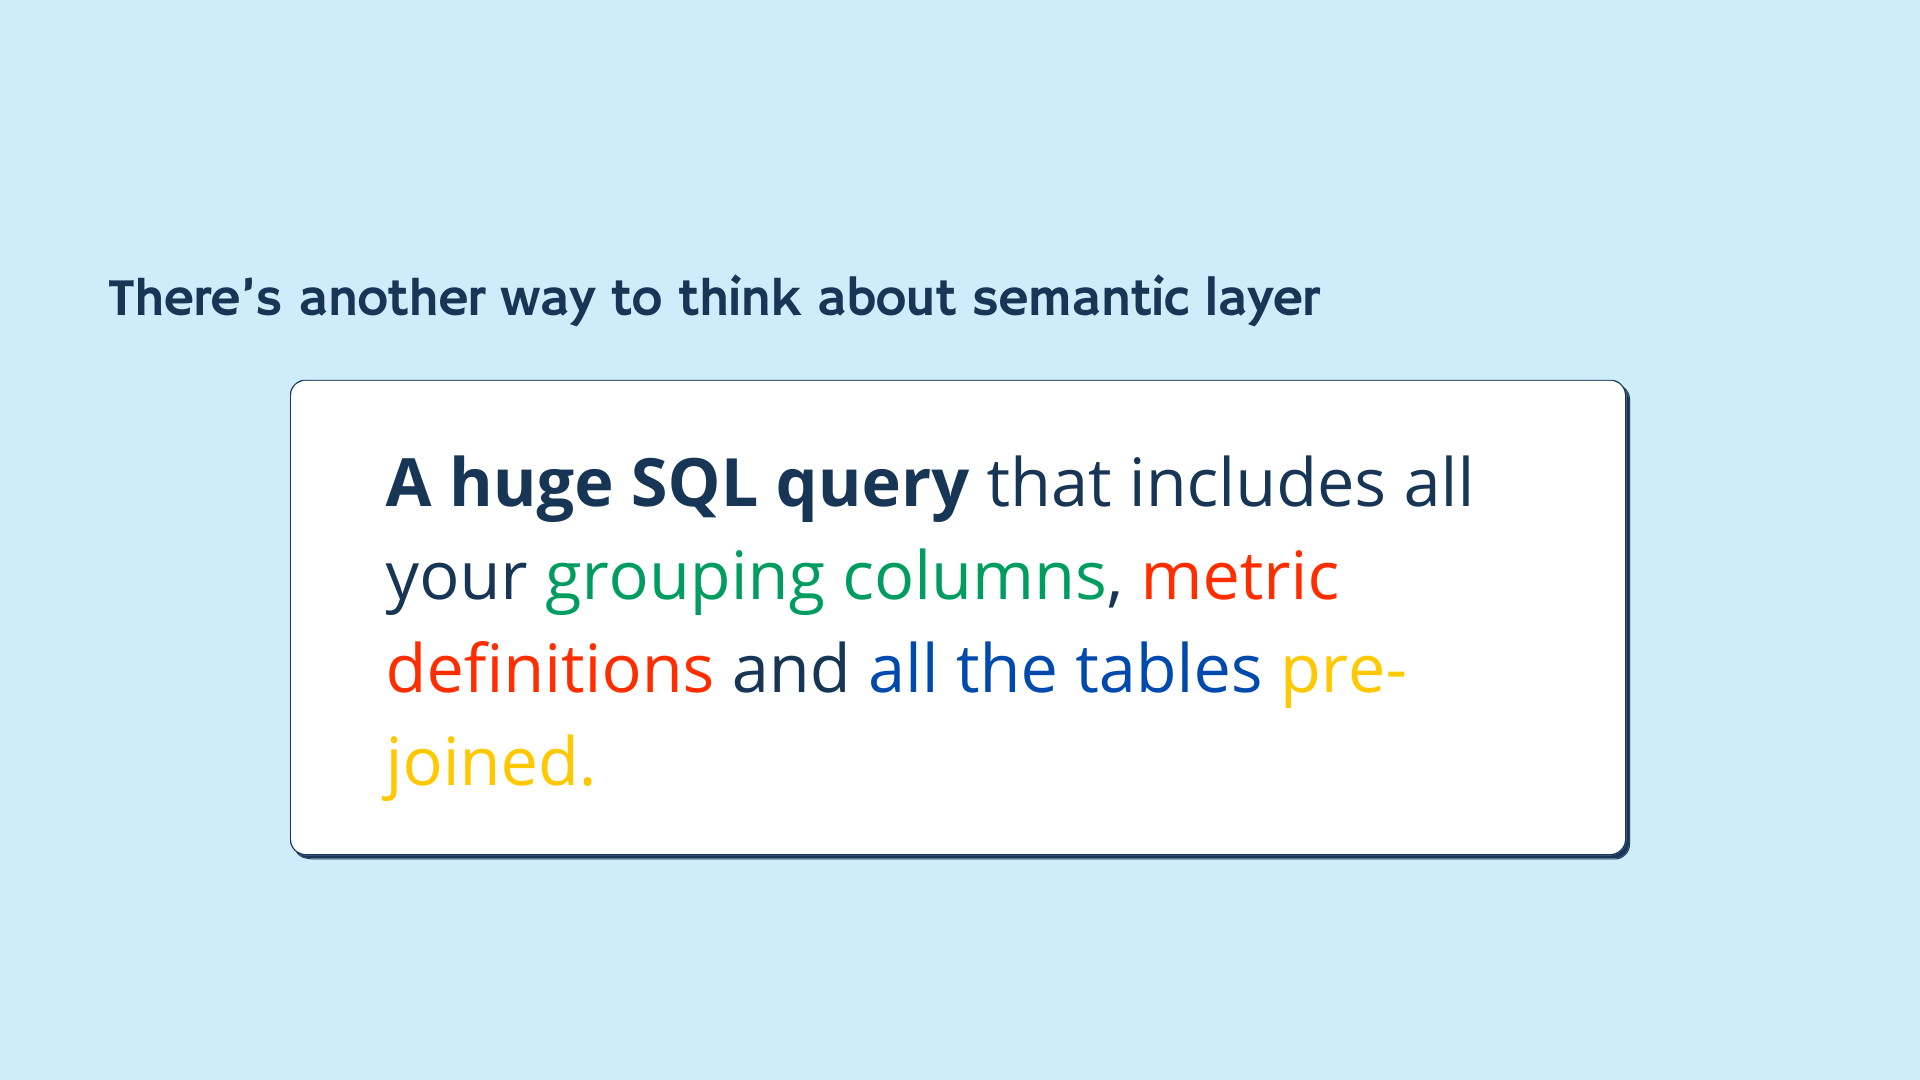
What does this look like to you? What else has tables, joins, aggregation expressions, and grouping?
It’s a query. A semantic layer, in its most simplistic form, is a query.
With basic documentation and SQL templates, business users could modify queries themselves. They could filter by date, change dimensions, and get their answers, without messing with analysts.
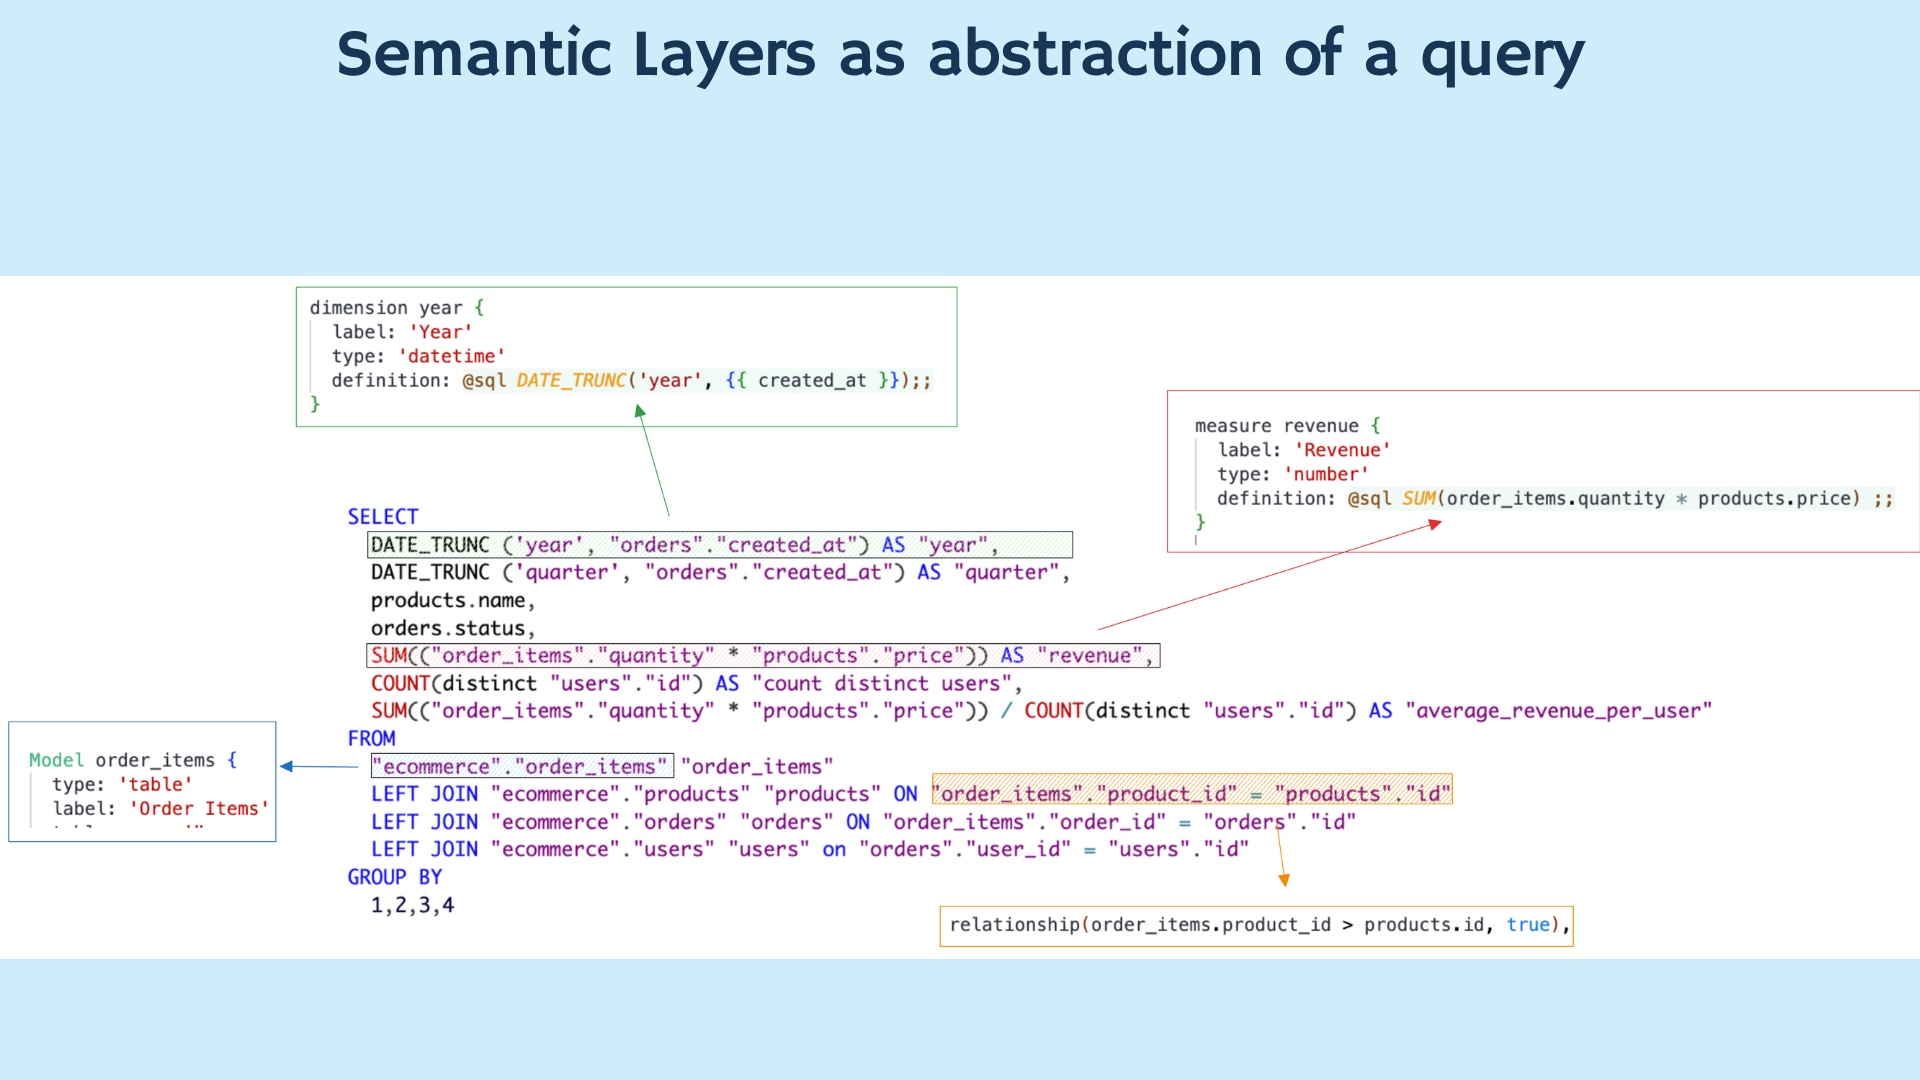
But we can do better. We wrap SQL logic in YAML definitions (like in dbt Metrics), abstracting:
- Aggregation logic -> Metrics
- Tables and relationships → Models
- Groupable columns → Dimensions
This makes the layer usable in UI-driven tools. Business users drag-and-drop dimensions and metrics, build dashboards, and explore data visually. No SQL required.
Everyone's happy: Bob gets fewer Slack pings, and Adam gets answers faster.
But Then Come the Complex Questions…
Here’s the twist: once business users taste the power of simple metrics, they want more, which is a good thing. To build a data culture, you need hungry, curious business users with a barrage of questions.
For example:
- “For each product, give the fractional increase in the sales of each month versus last month.”
- “Who are the top 5 suppliers for each product category based on total sales for last year?”
- “What is the total revenue from those top 5 suppliers?”
- “For each year, list the median total revenue by product.”
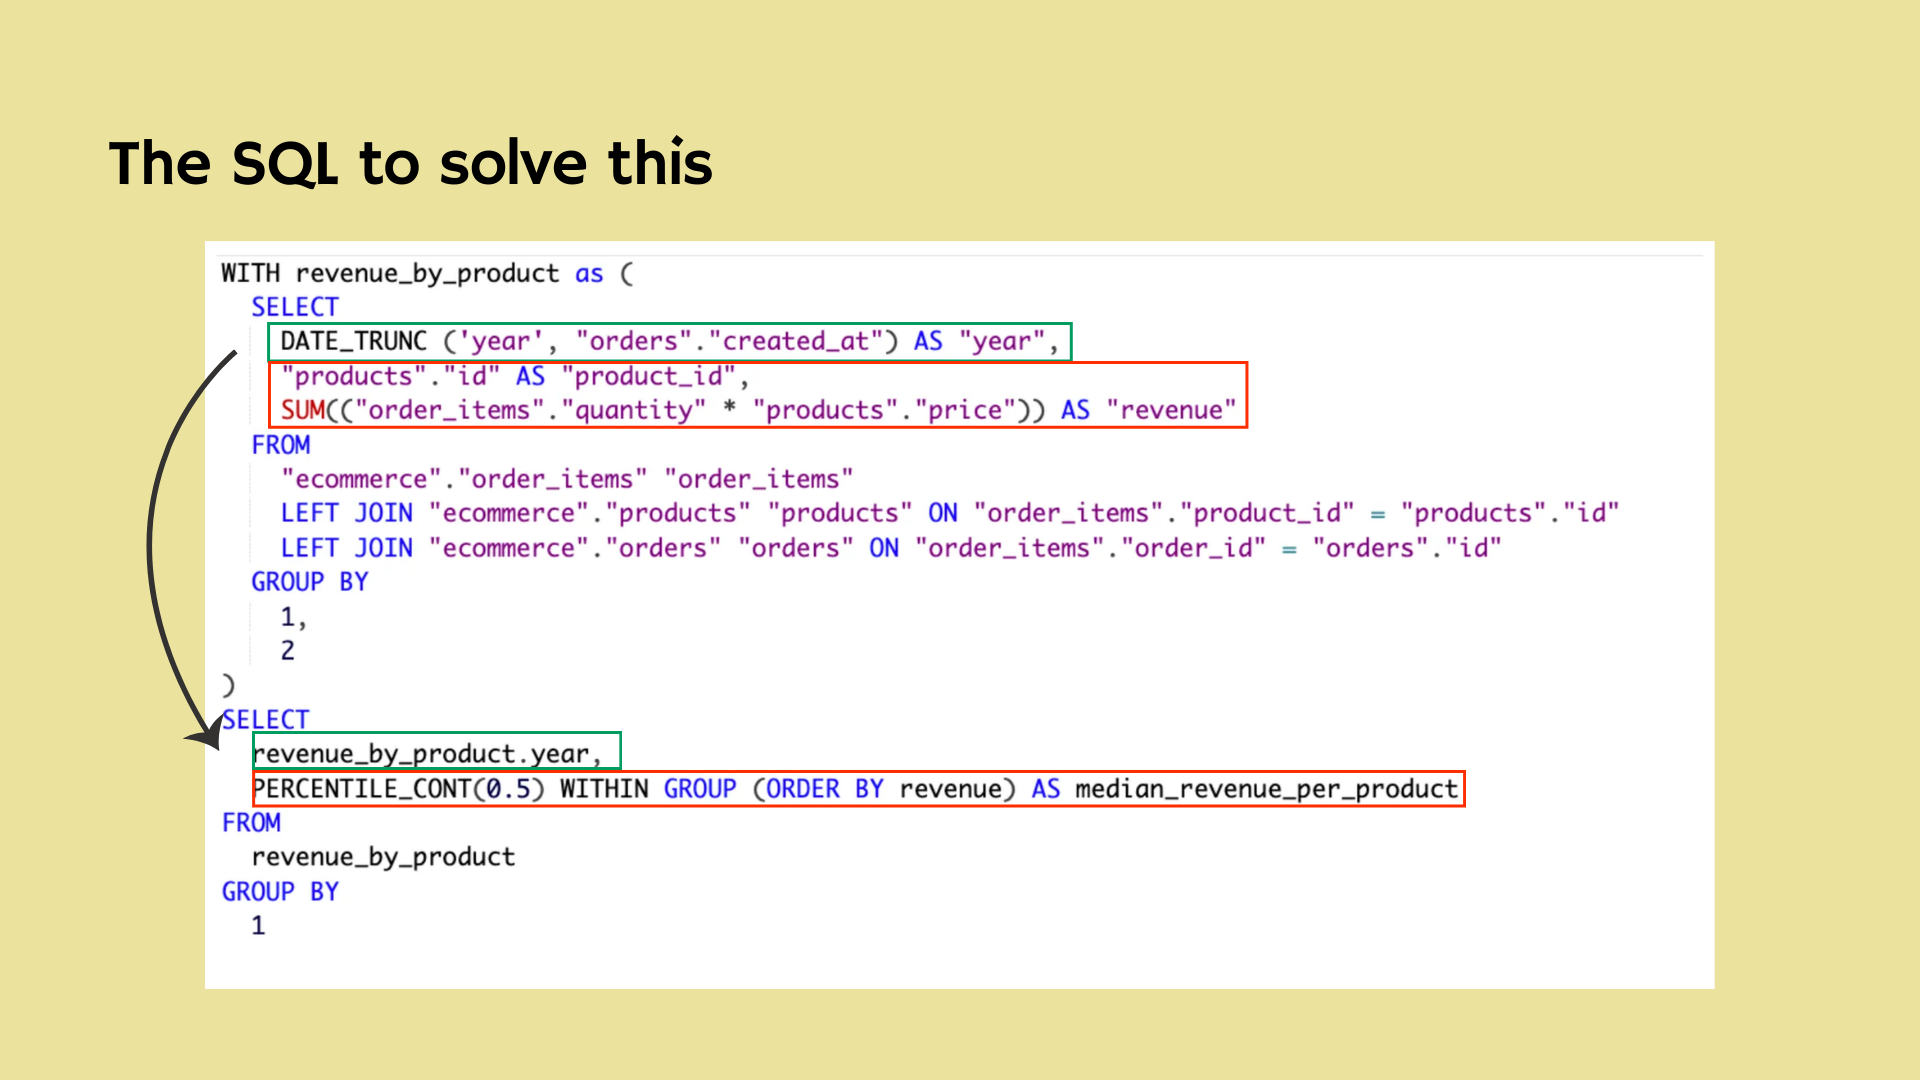
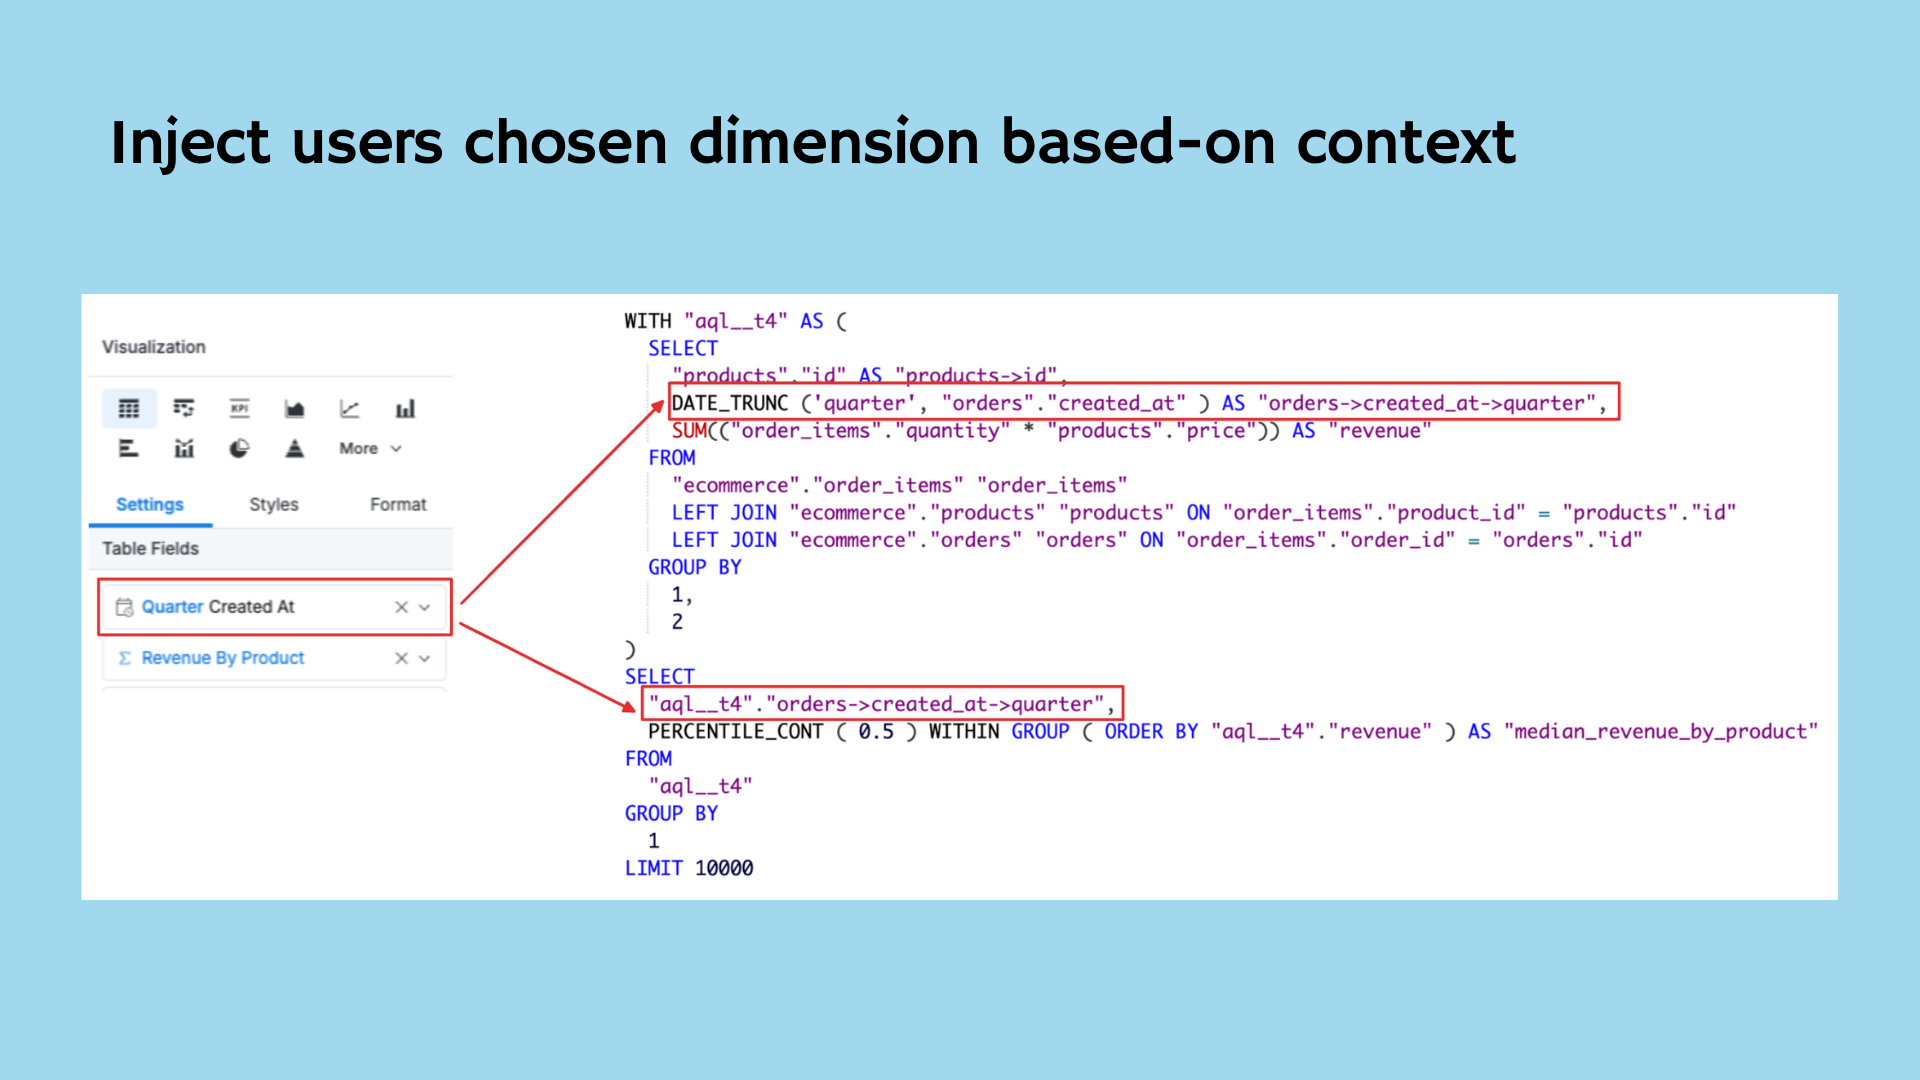
Let’s look at one more specific: For each year, list the median total revenue by product.
This is not hard in SQL. In fact, I asked ChatGPT, and it gave me a good answer! As a one-off query, that’s fine.
But the problem is, we lose all the benefits of the semantic layer.
How do we fit this into the semantic layer abstraction?
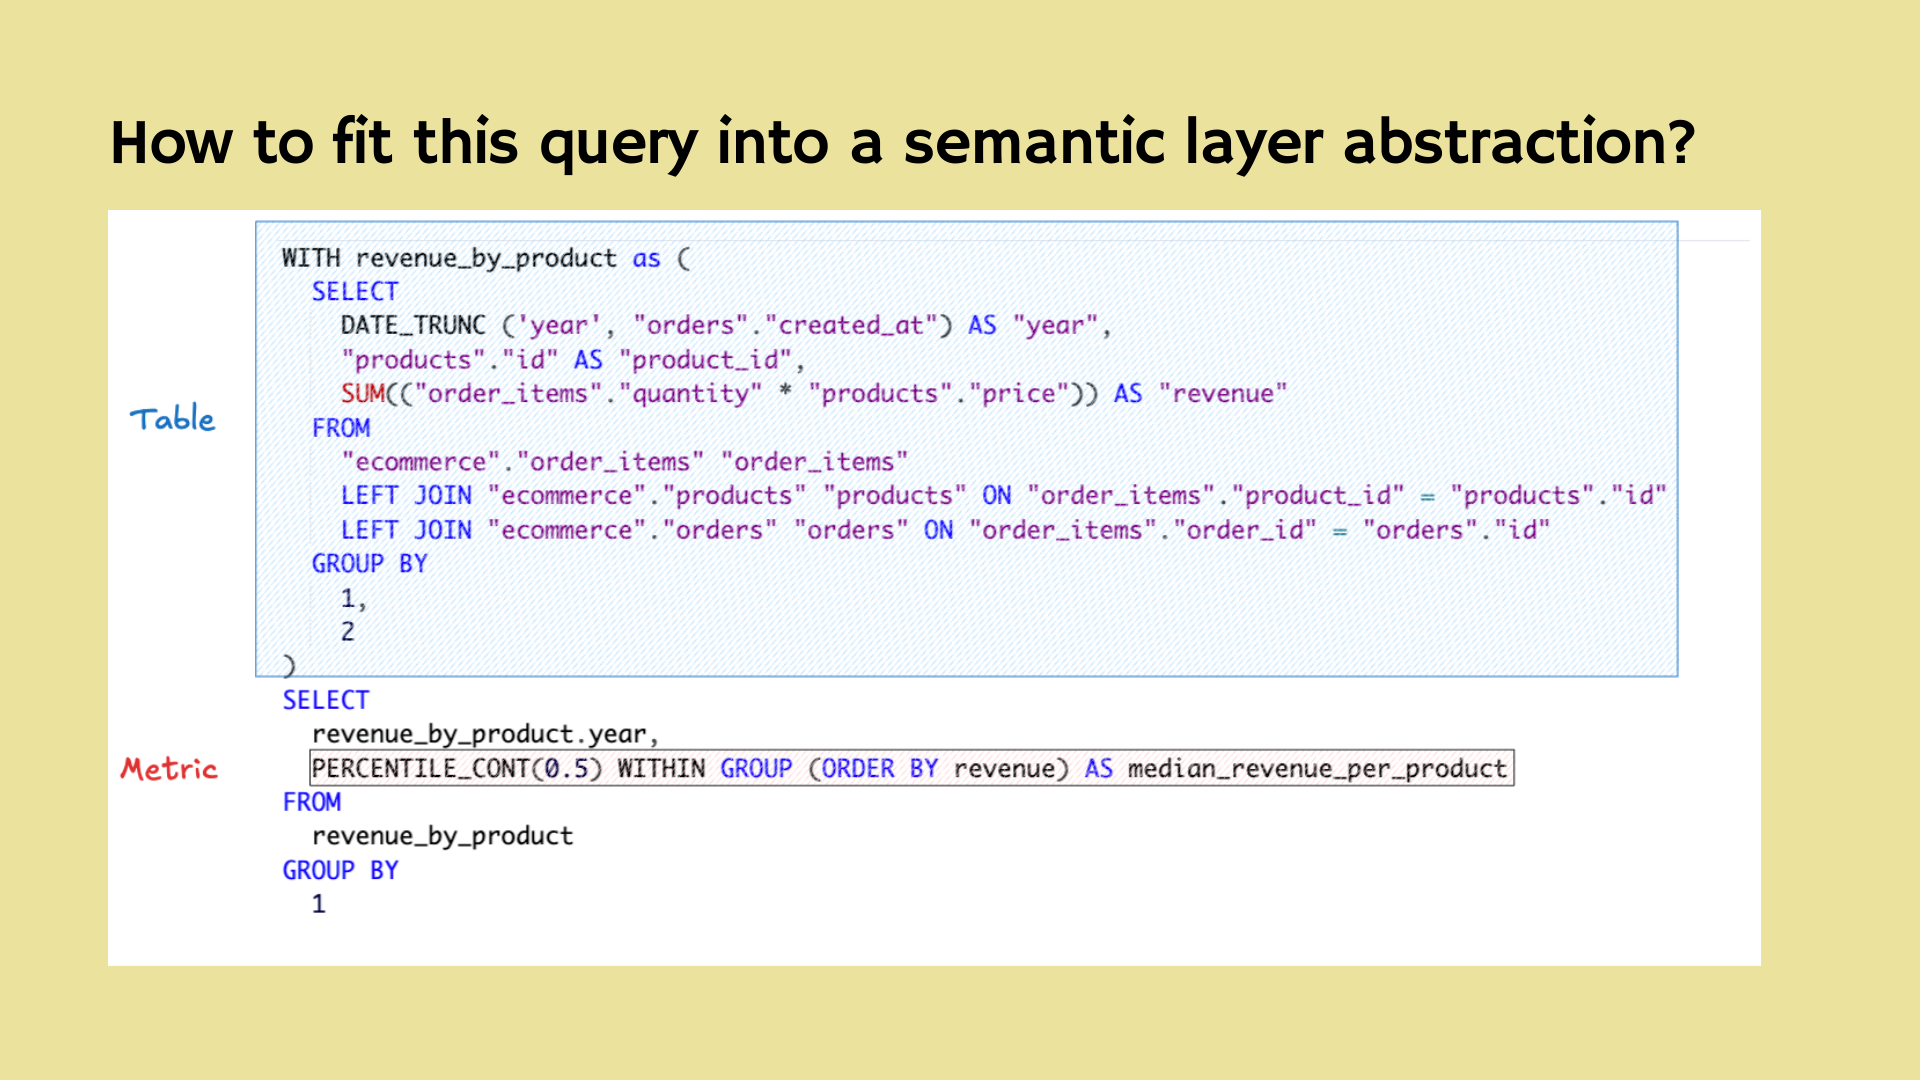
Well, most people try this:
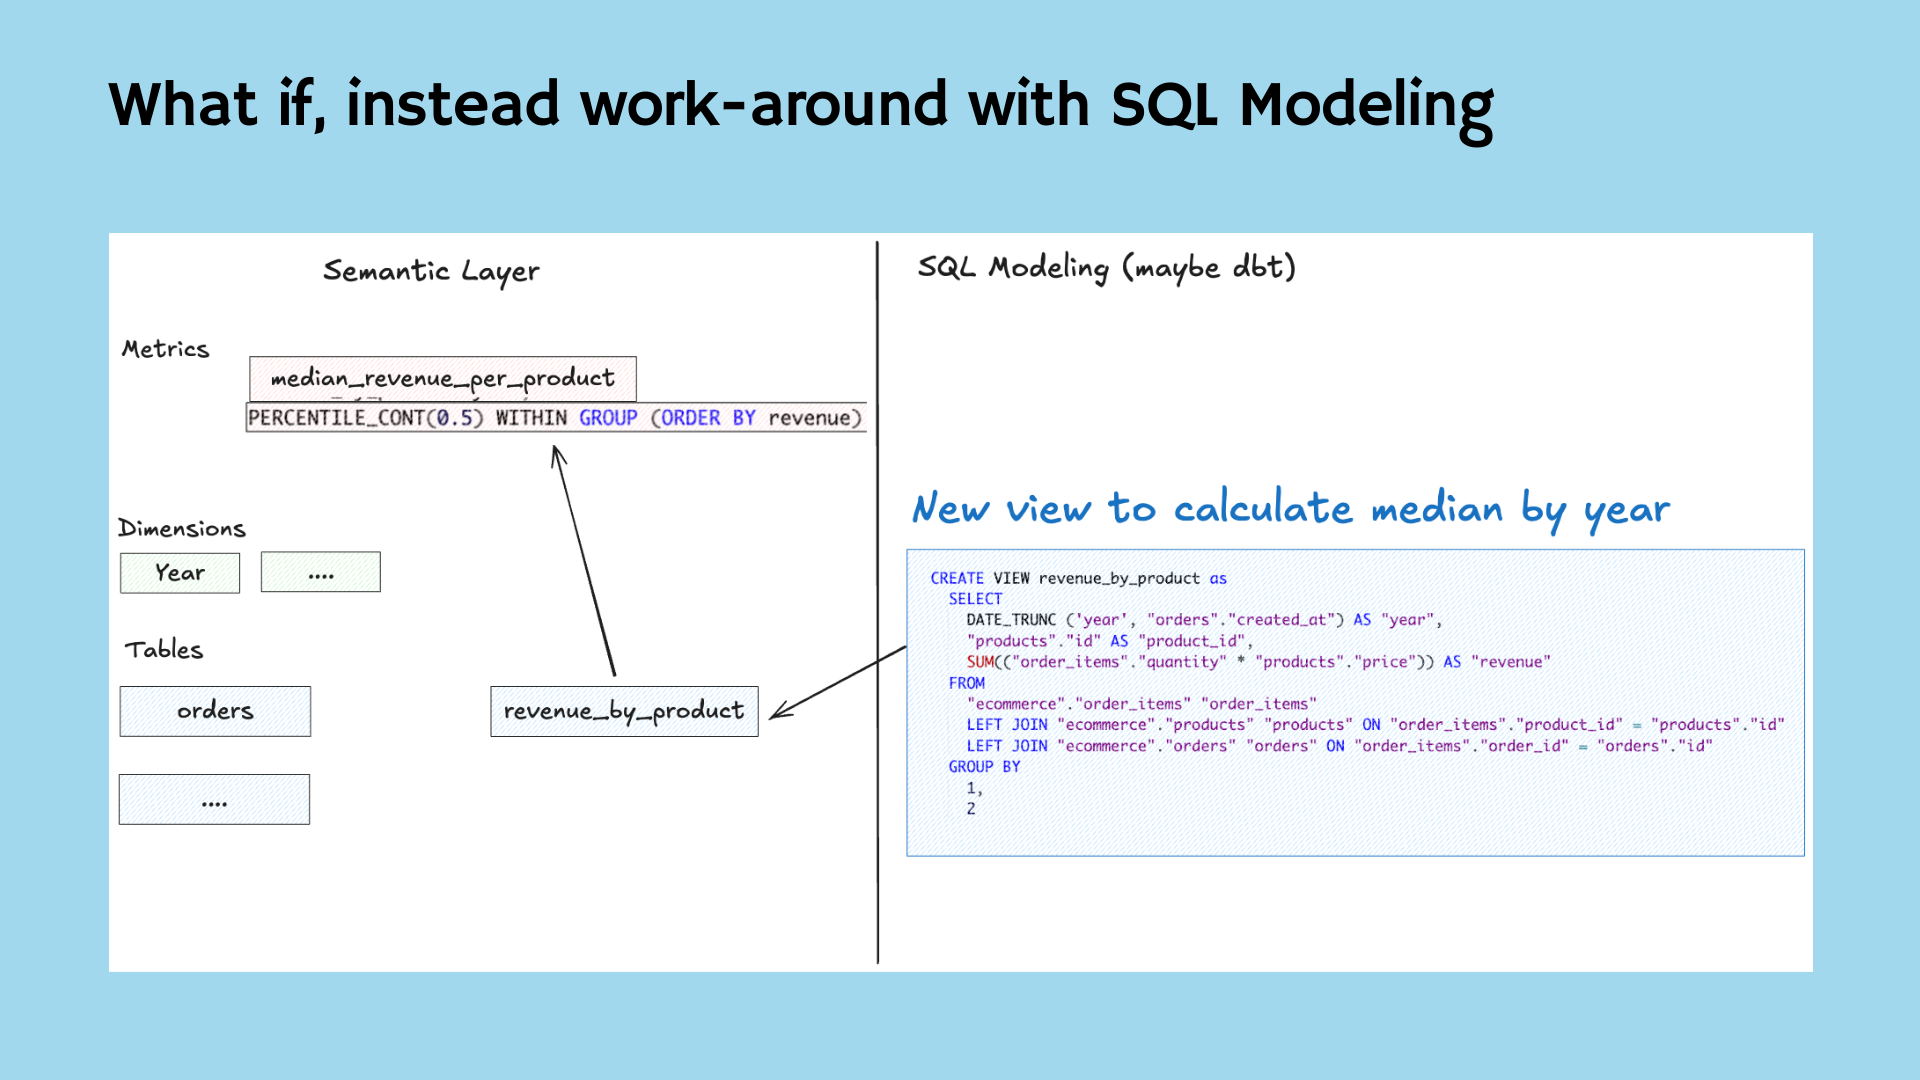
- Store the CTE (common table expression) as a view
- Create a metric using that view
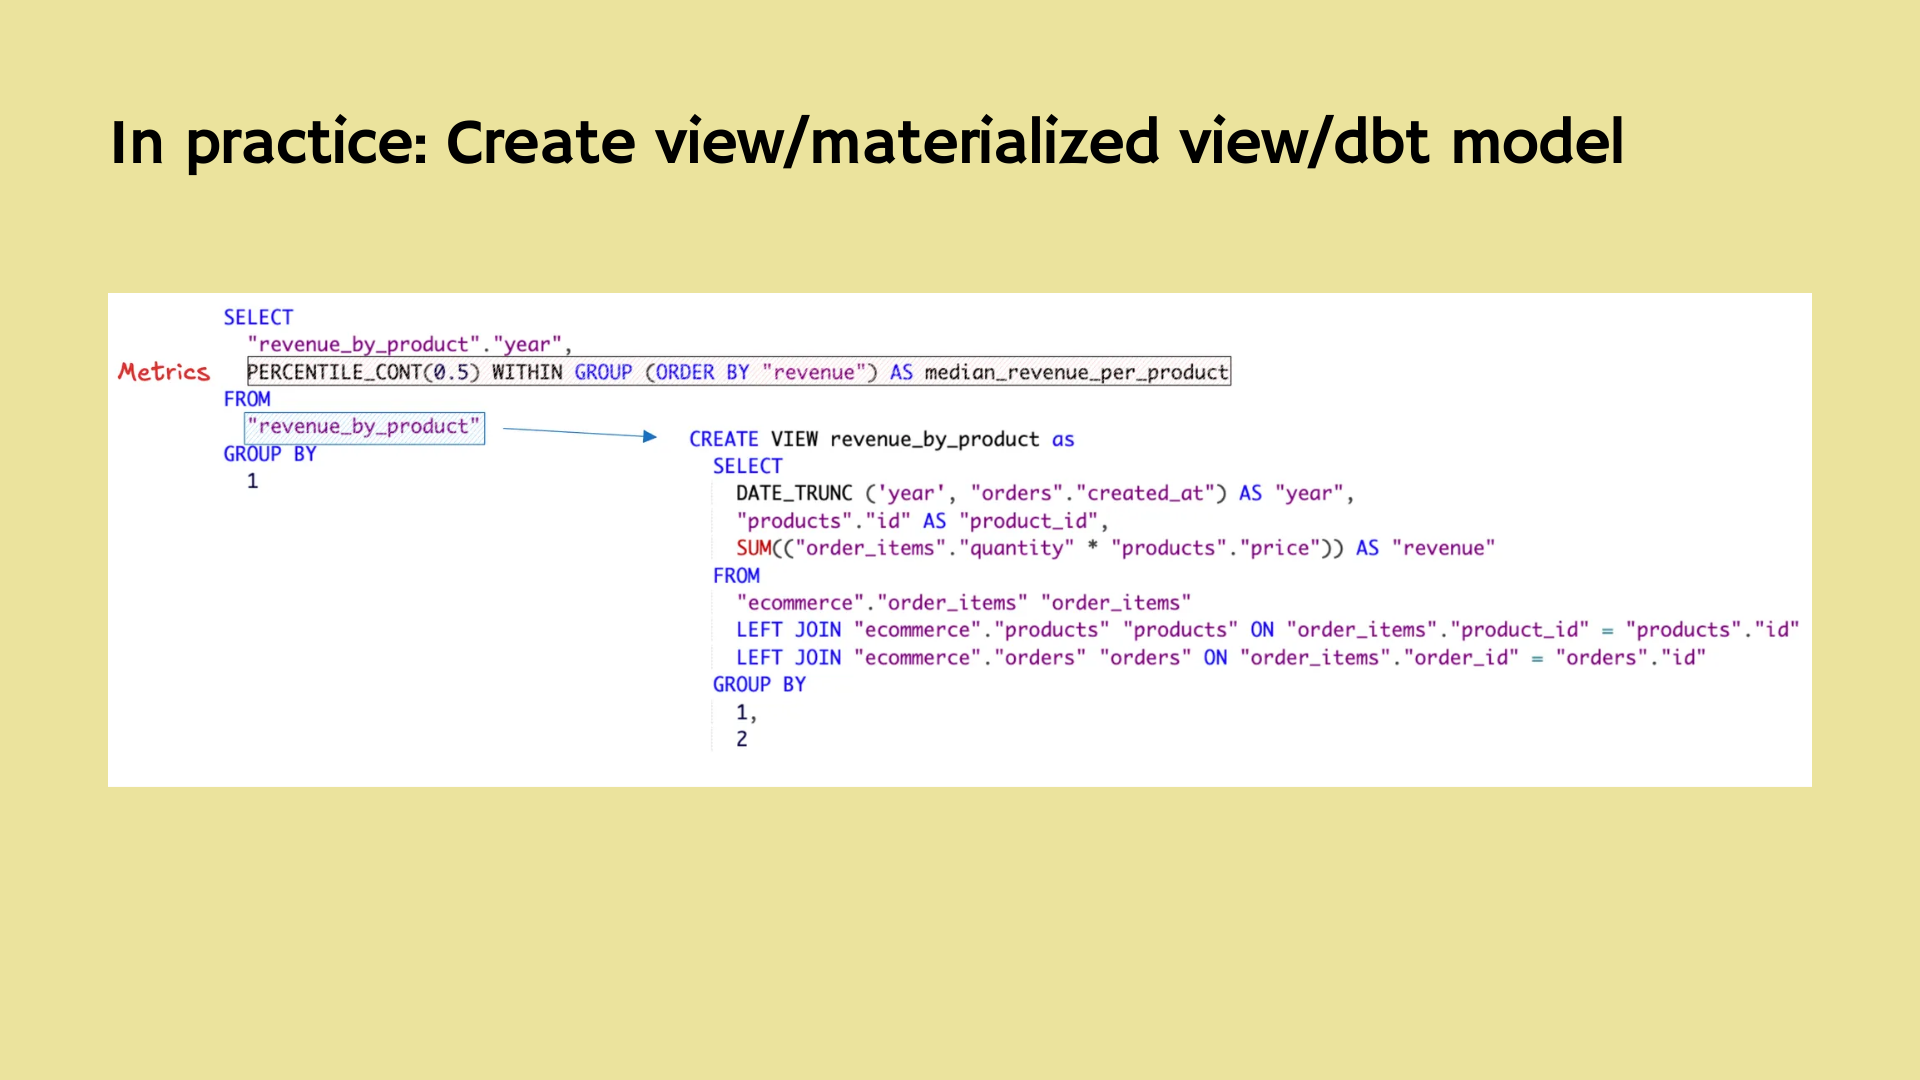
Most teams end up storing the logic in a view, and then define a metric on top of that view.
But this approach has serious drawbacks:
- You have to write the view manually — often outside the semantic layer.
- The view becomes outdated when someone changes the revenue definition.
- The model becomes bloated with one-off views for specific metrics.
- And most importantly: the resulting metric is not flexible.
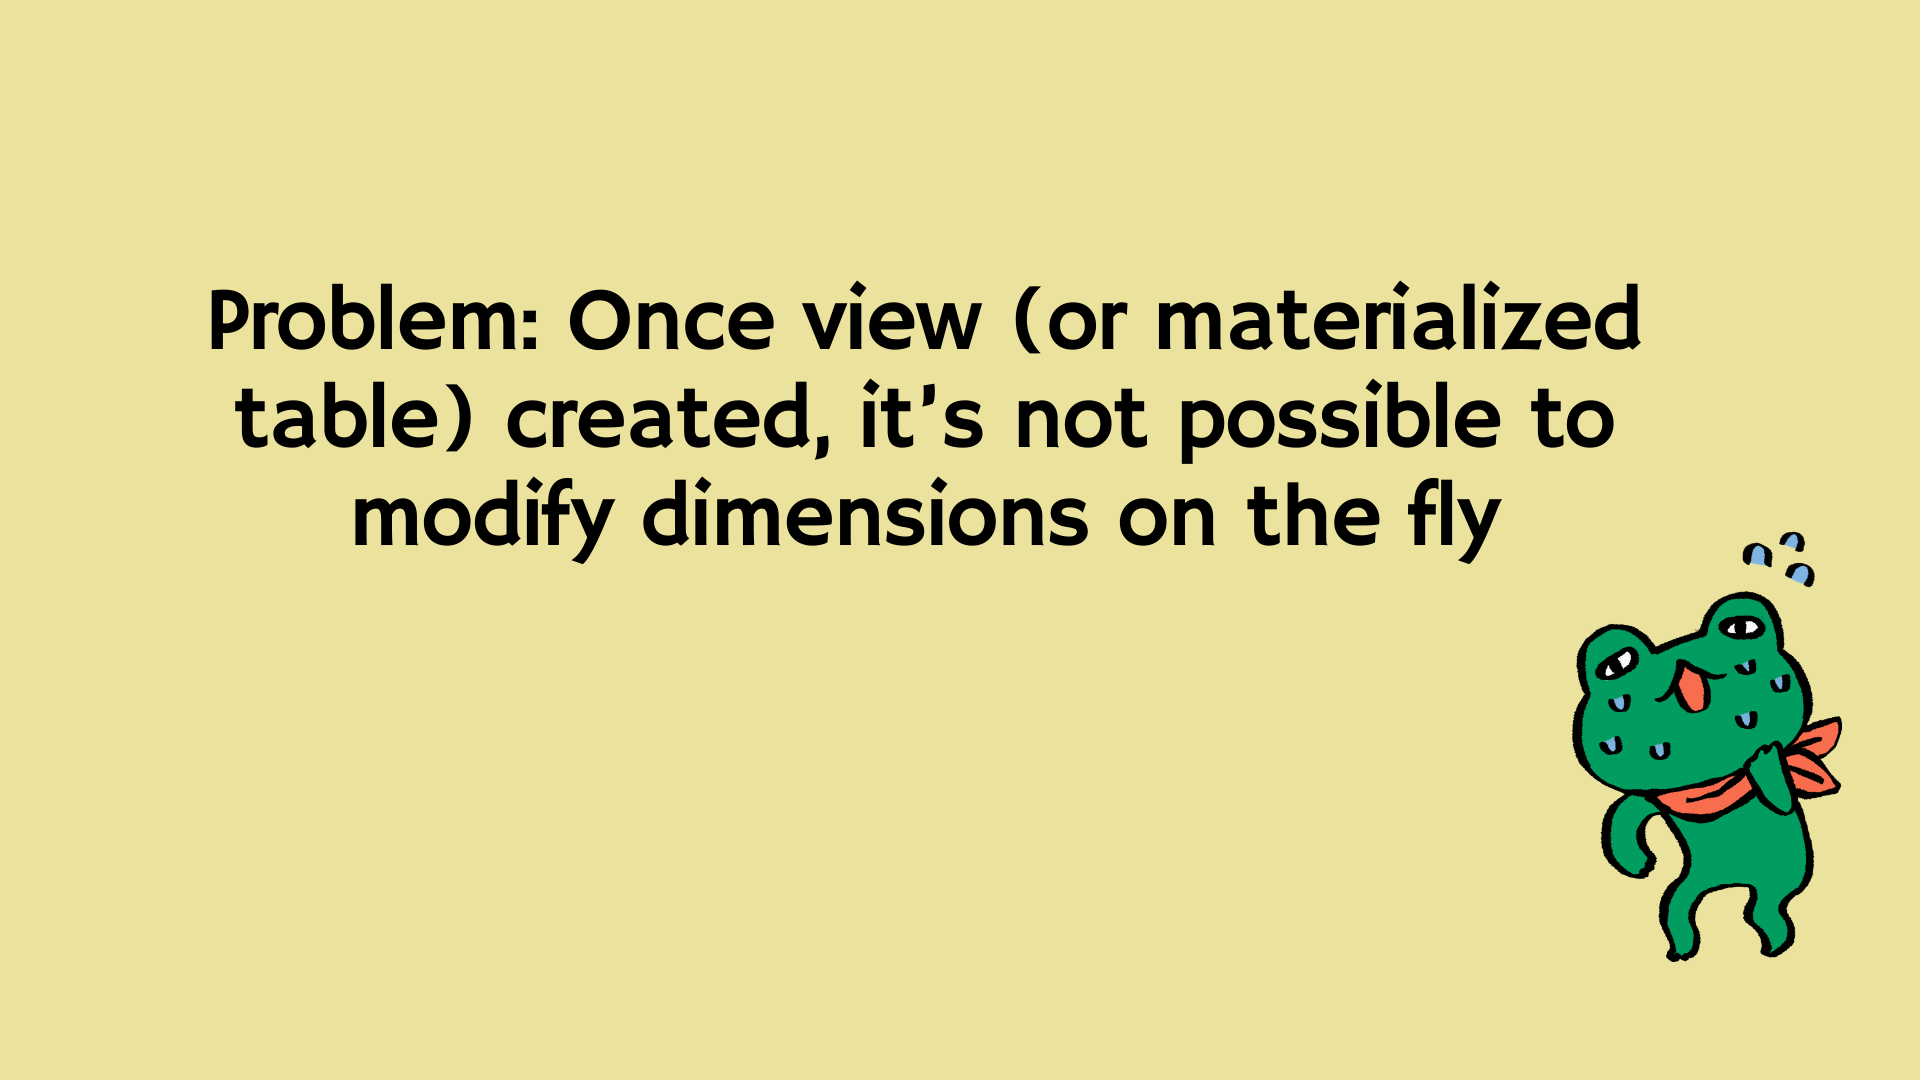
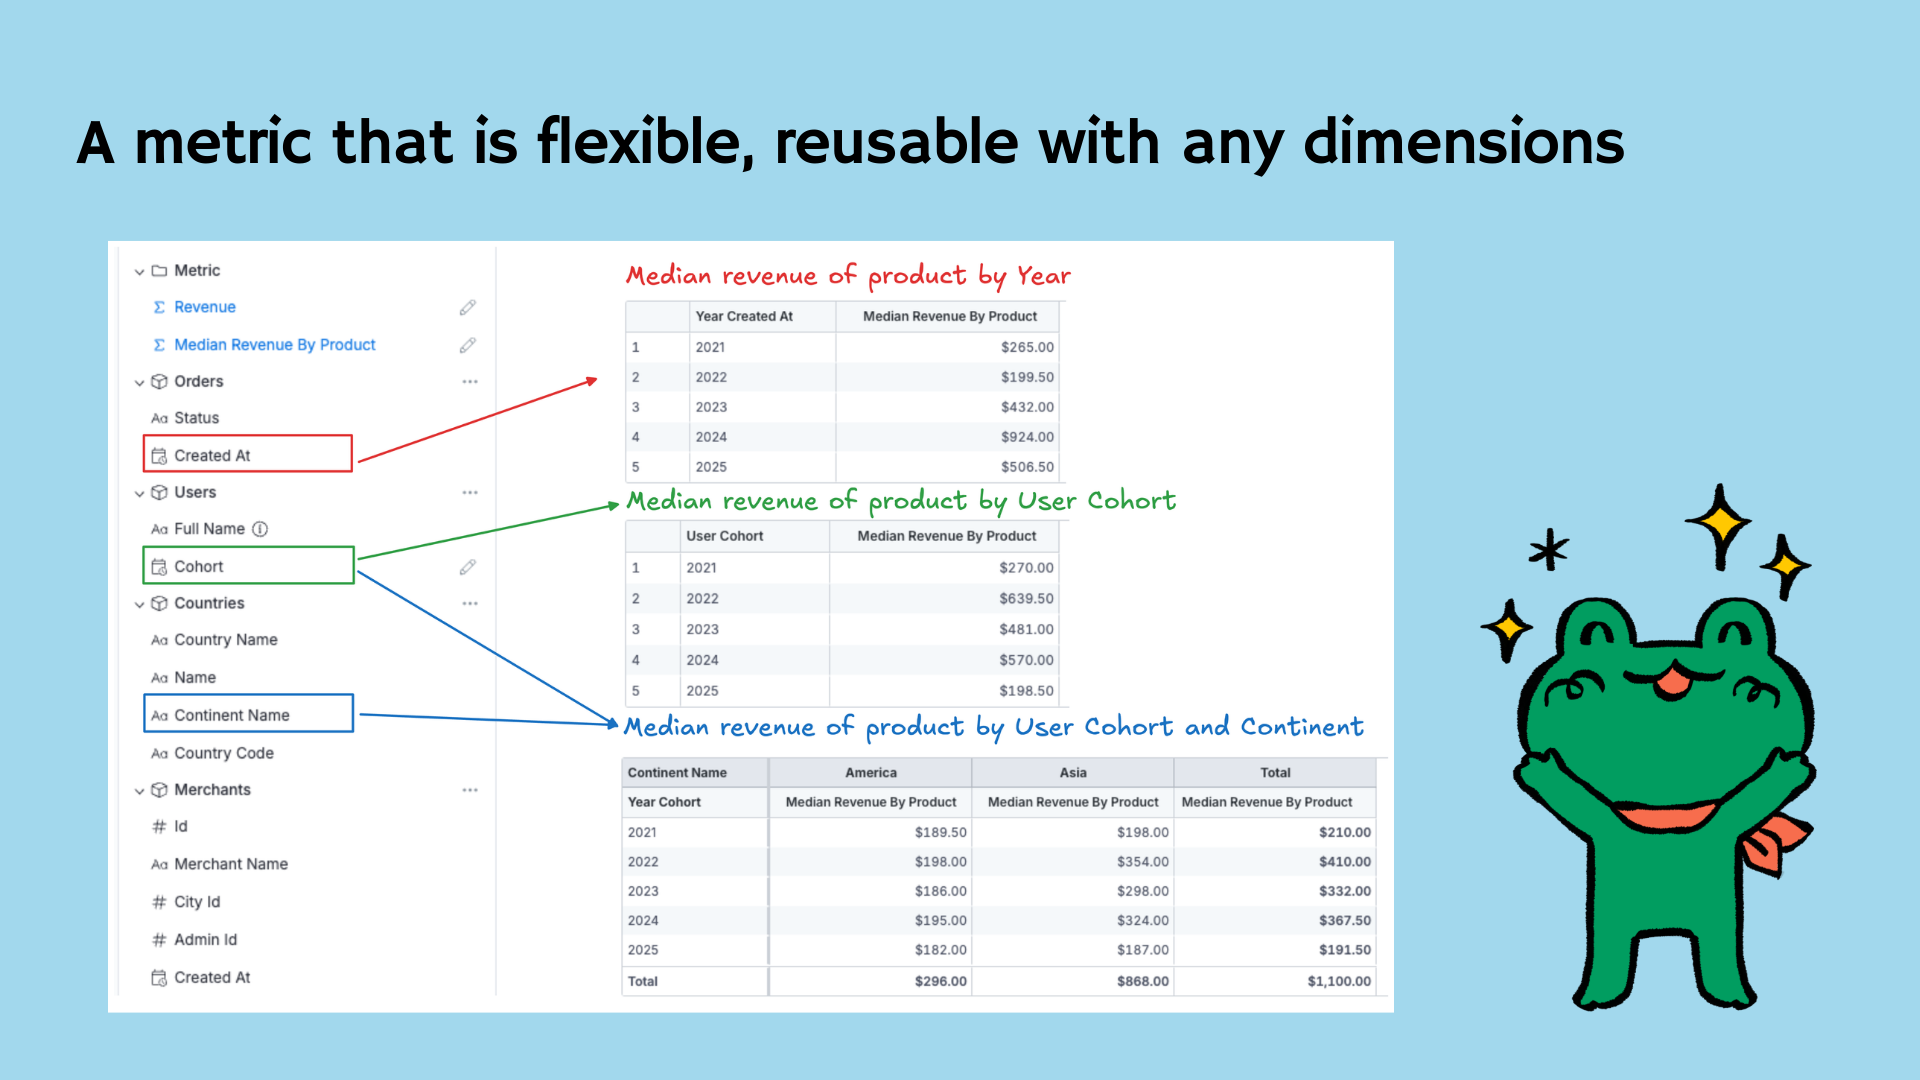
If you want to view median by month instead of year? Or by user cohort instead of time? You’re stuck. You have to rewrite the whole thing.
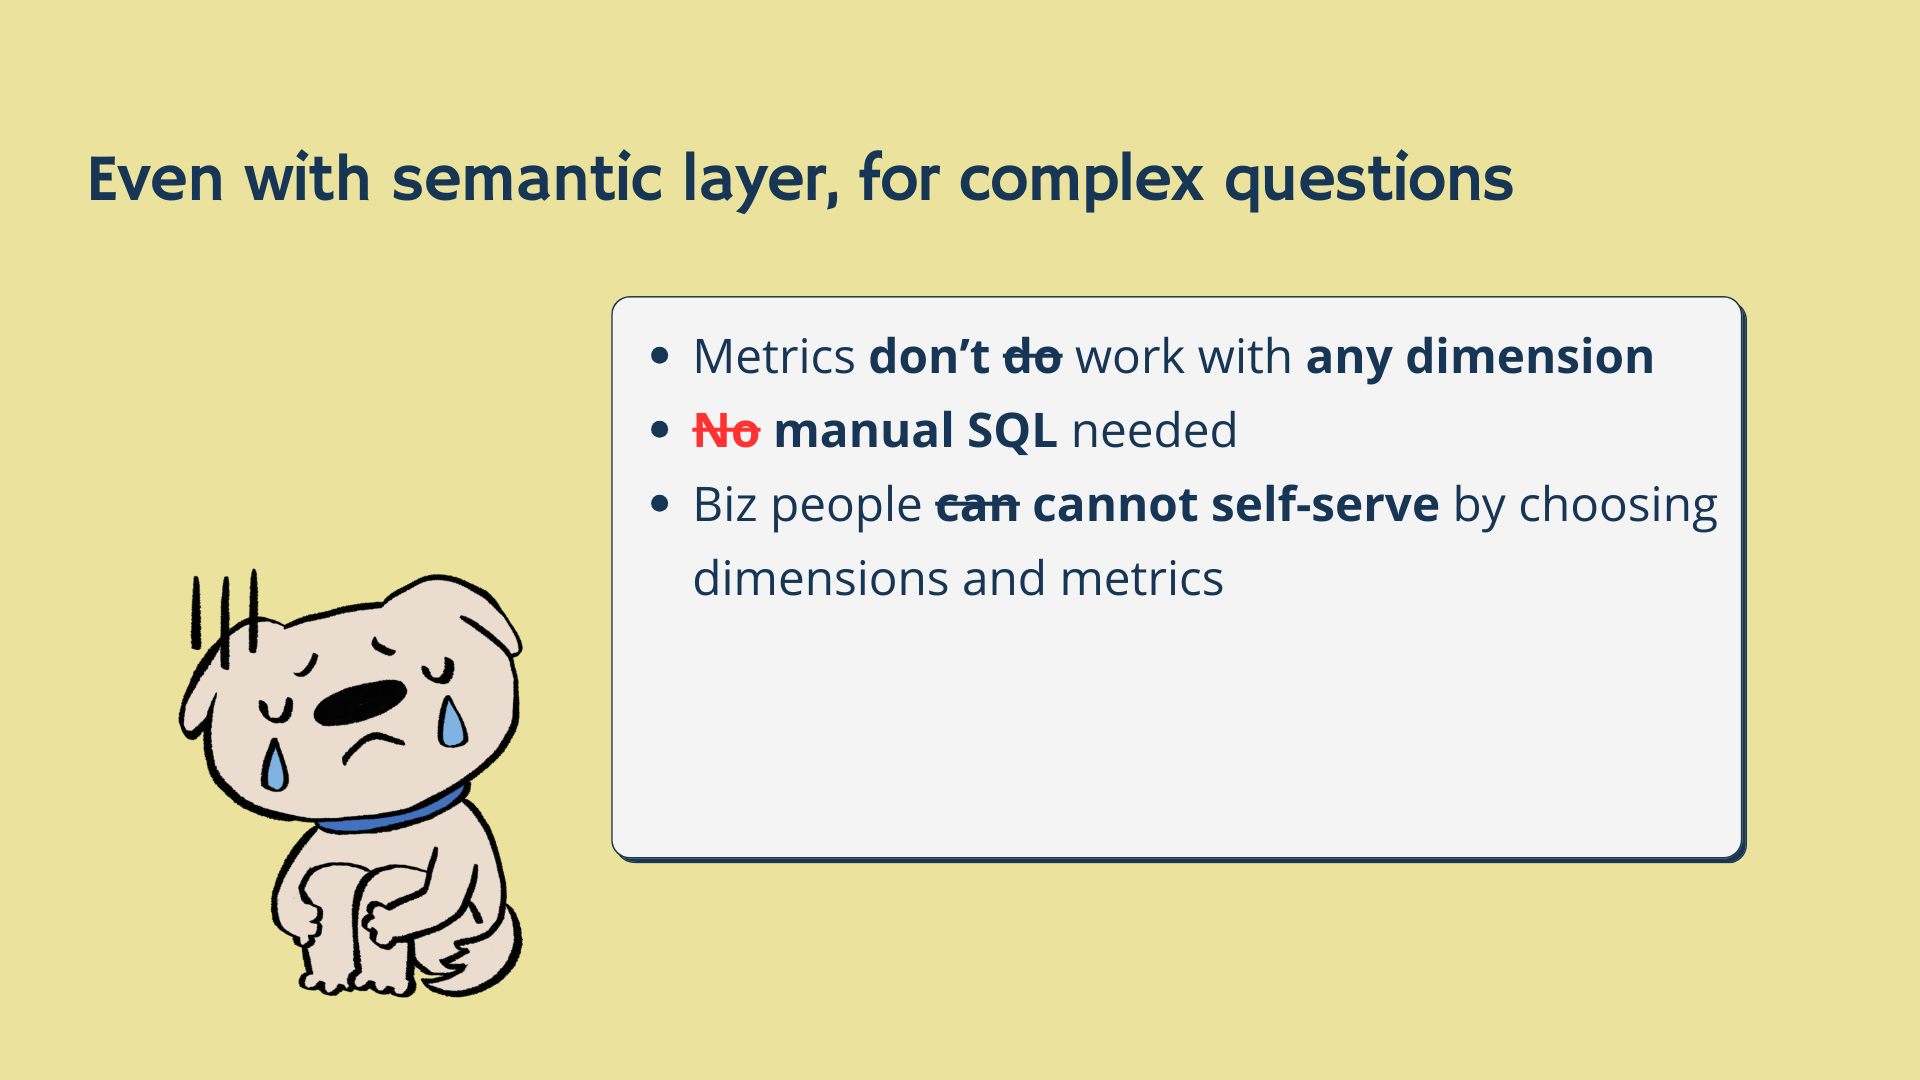
This defeats the purpose of a semantic layer, where metrics should work with any dimensions.
And worst of all:
- The final metric is not flexible.
- It doesn’t benefit from being in the semantic layer.
- If the year dimension is baked into the view, you can only see median by year.
What happens if someone asks:
- “Median by month?”
- “Quarter?”
- “User cohort?”
You're back to creating new views for every variation.
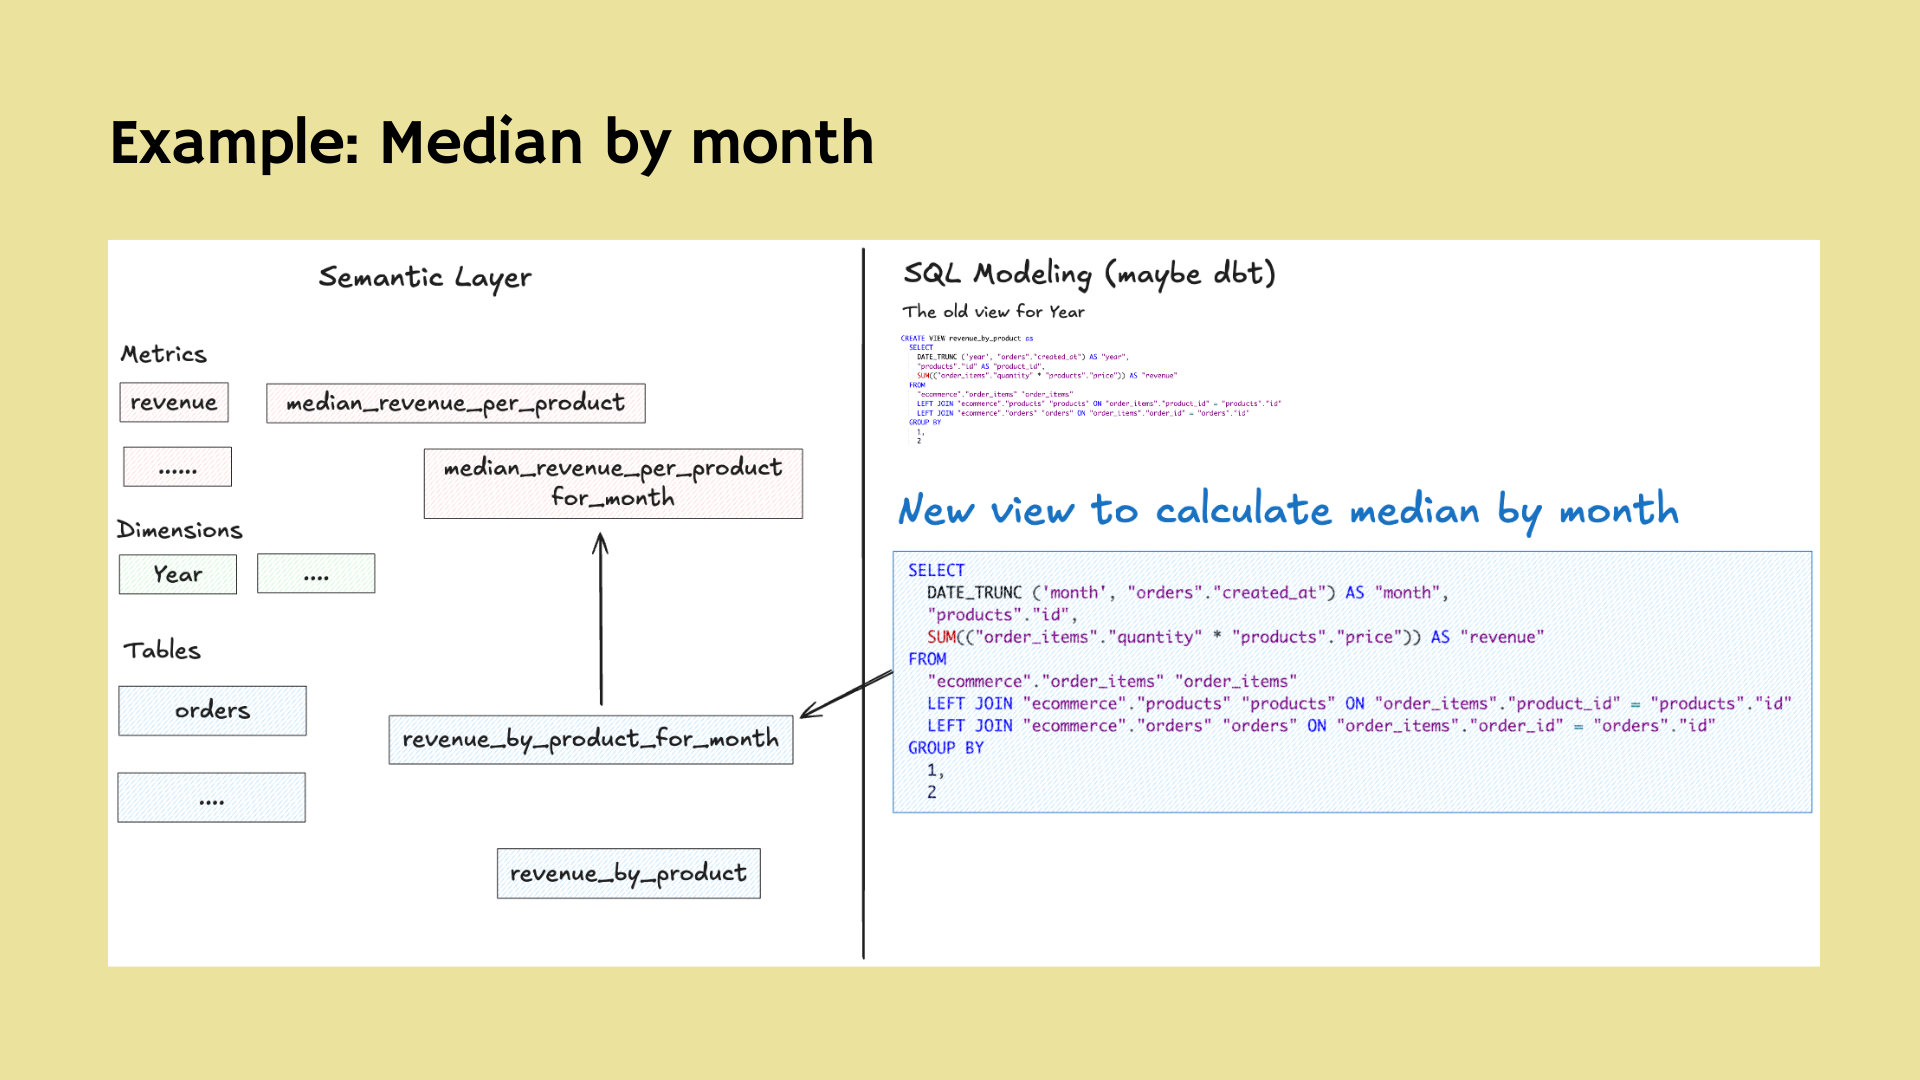
So... all the downsides of SQL, with none of the benefits of semantic modeling.
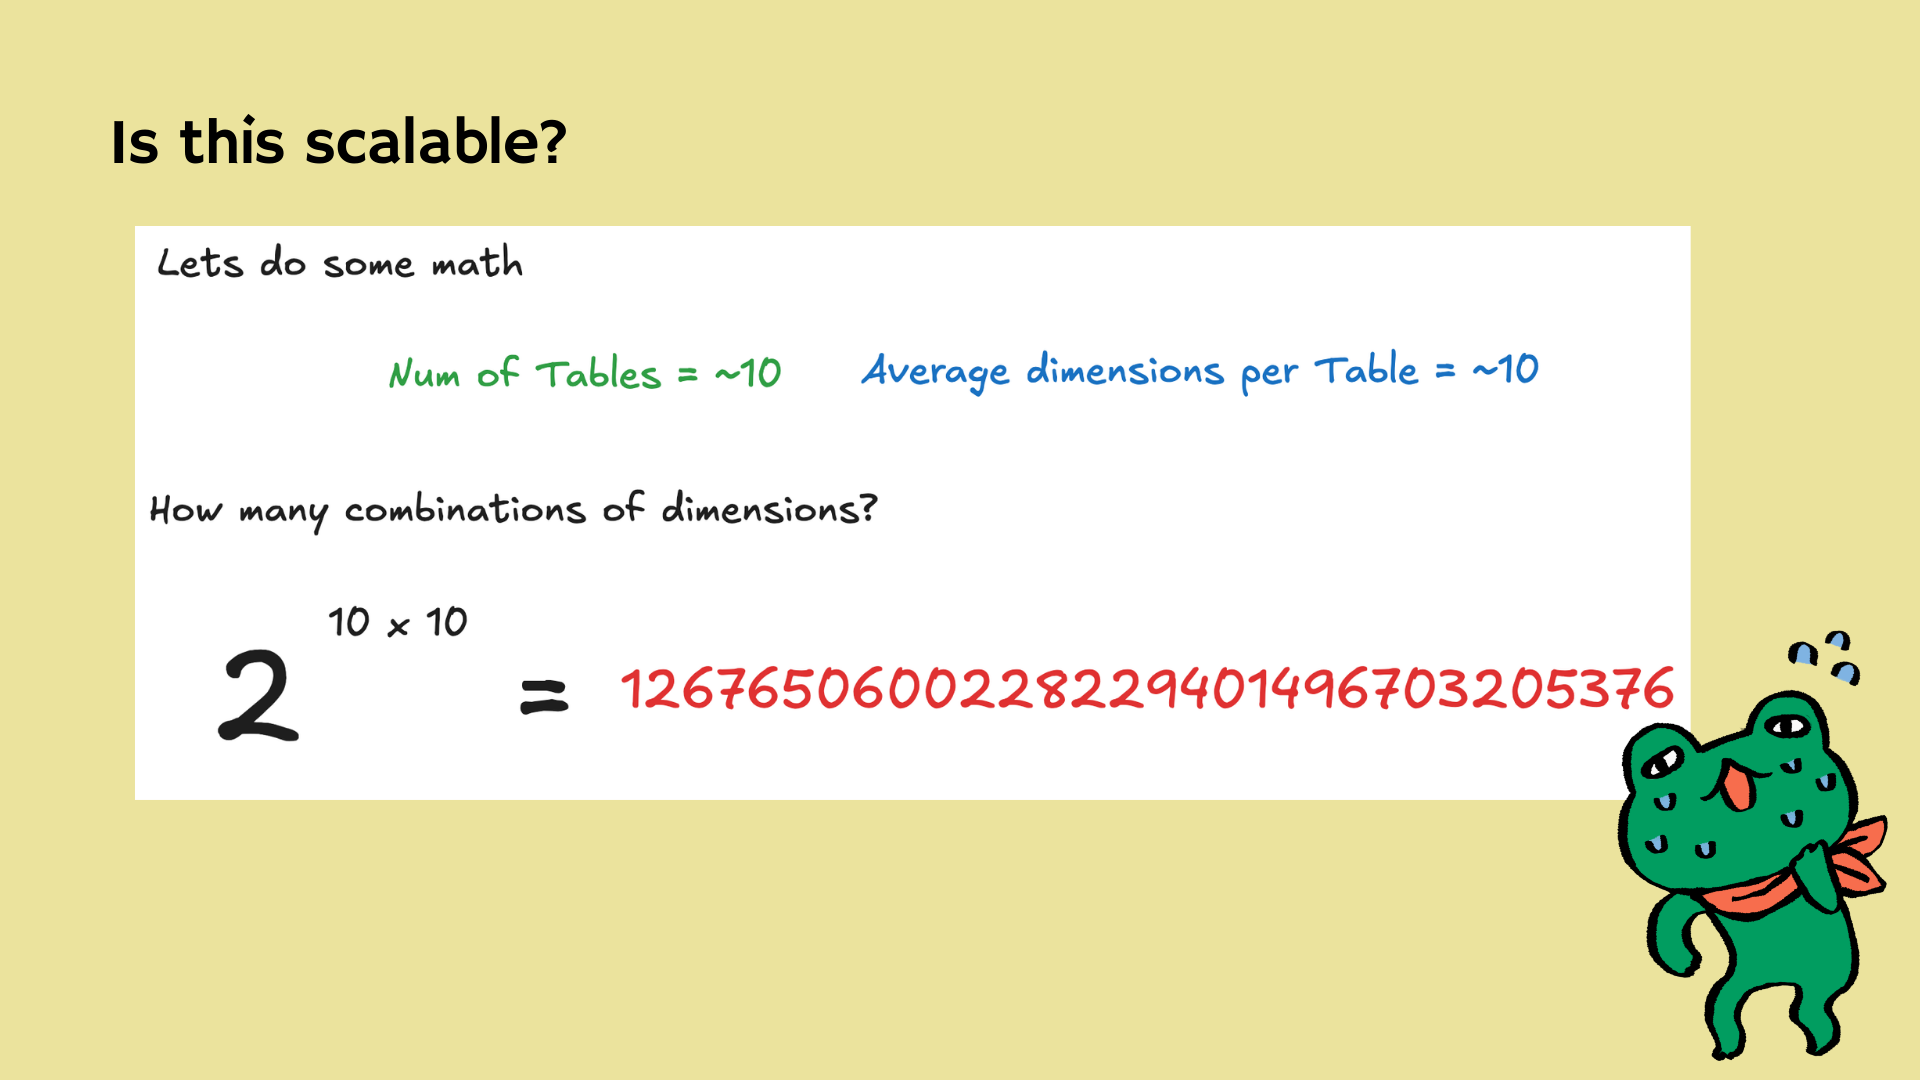
But every new question = new table. Want revenue by user cohort? New view. By product launch year? Another view. If you have 10 possible dimensions per metric, the number of combinations explodes exponentially.
It’s not scalable. And you lose flexibility—users can't dynamically slice metrics across arbitrary dimensions.
Suddenly, our simple semantic layer breaks down. Business users can’t answer this on their own. Bob is back in the loop. Self-service is dead.
I want to offer you a change in mindset. Instead of thinking of a CTE as just a table…What if we thought of it as a metric?
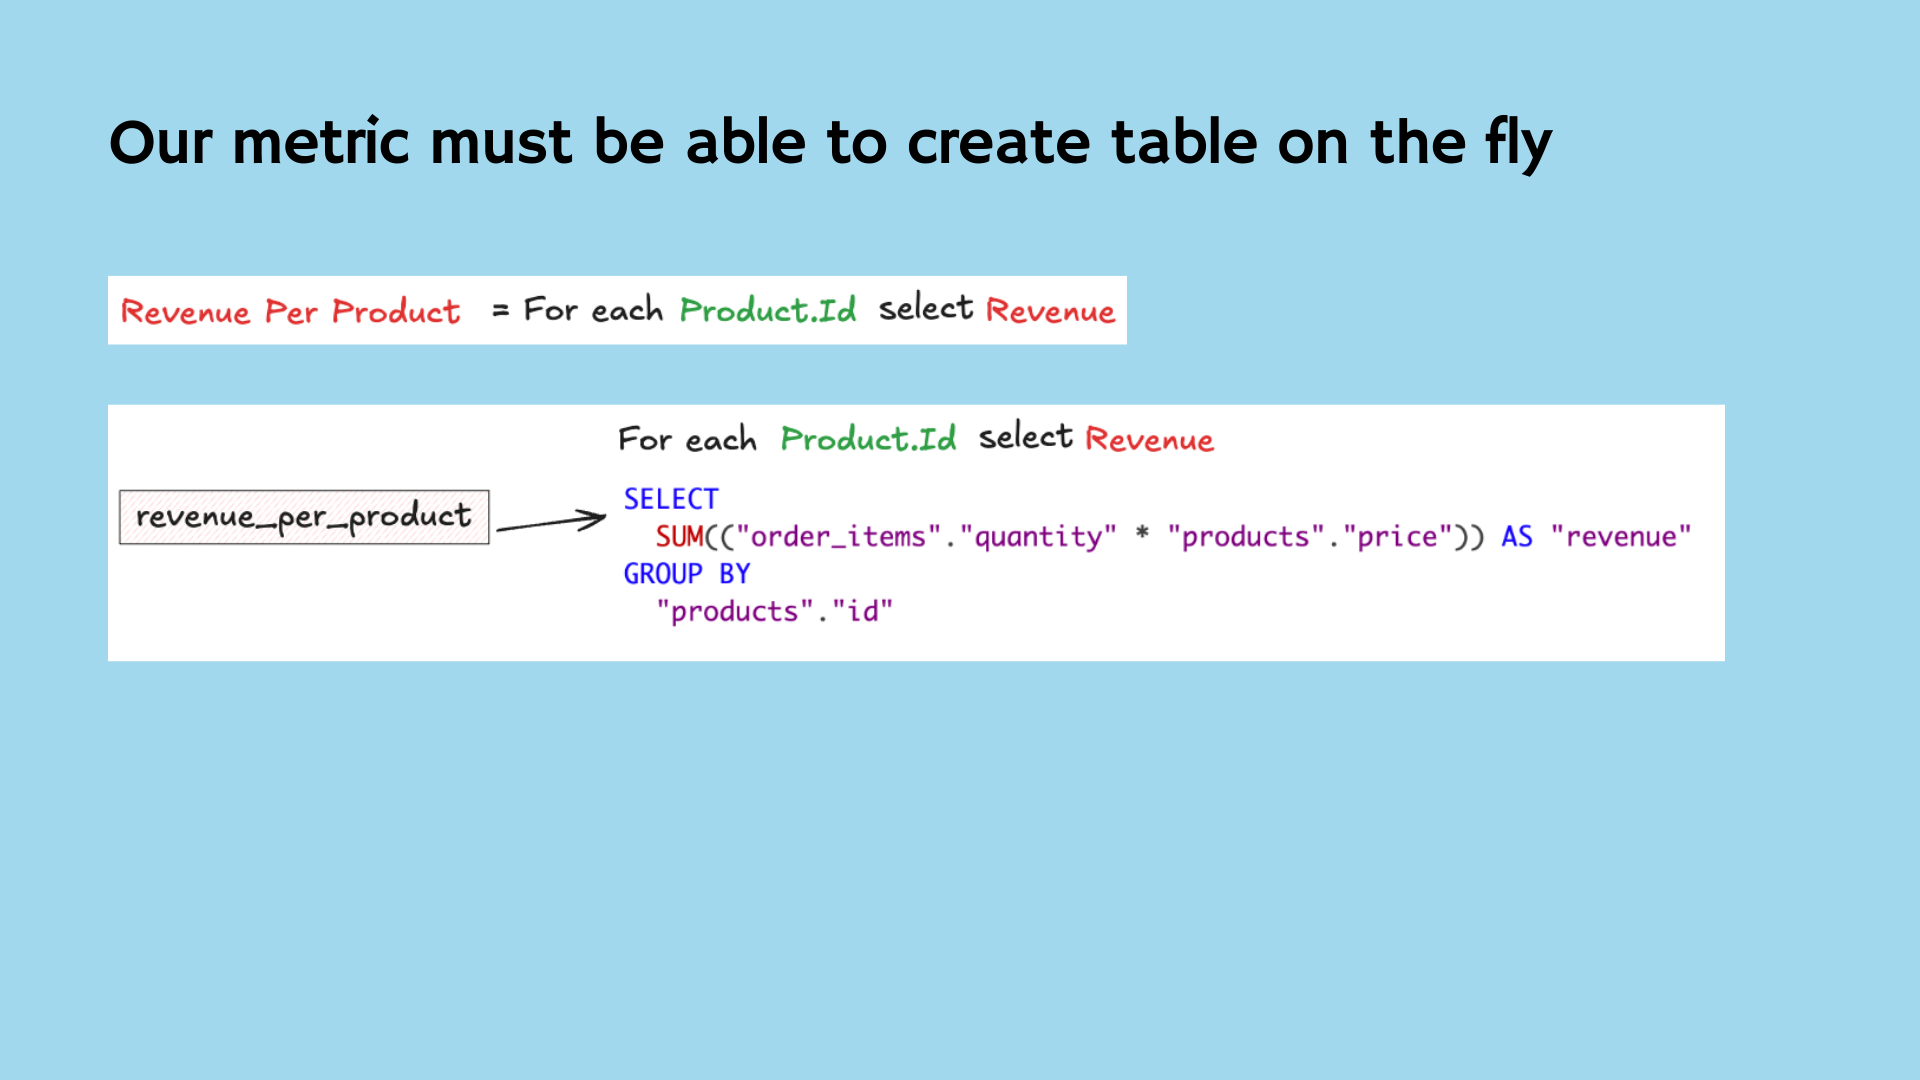
Even better: What if a metric could derive its own table from existing dimensions and metrics—then aggregate on that?
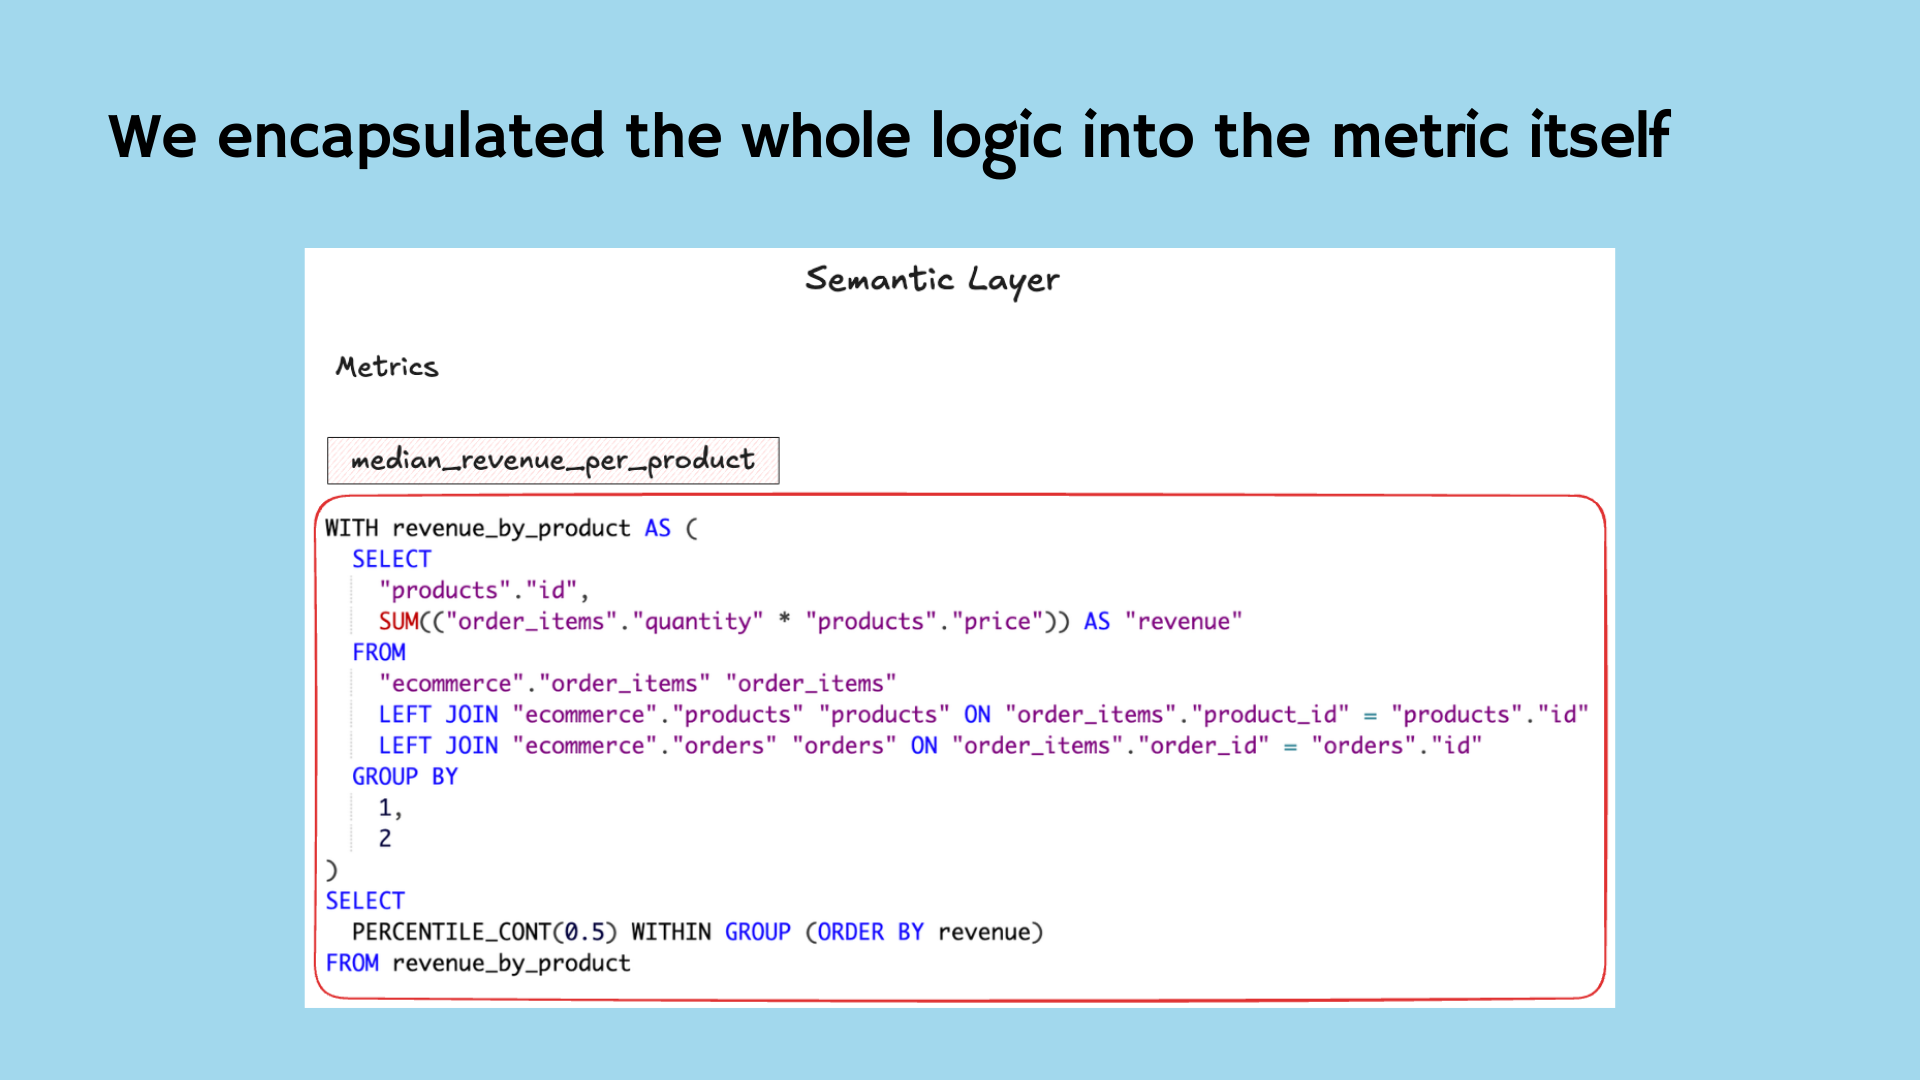
We could then express that new metric as a composable piece, encapsulating all logic in one reusable unit.
A New Language for Composable Metrics
What if instead of pushing complex logic into static tables, we let metrics encapsulate the logic themselves?
To achieve this, the metric language should be:
- Full-fledged queries (with CTEs, nesting, grouping)
- Reactive to context (inject dimensions automatically)
- Return tables as values (supporting nested table calculations)
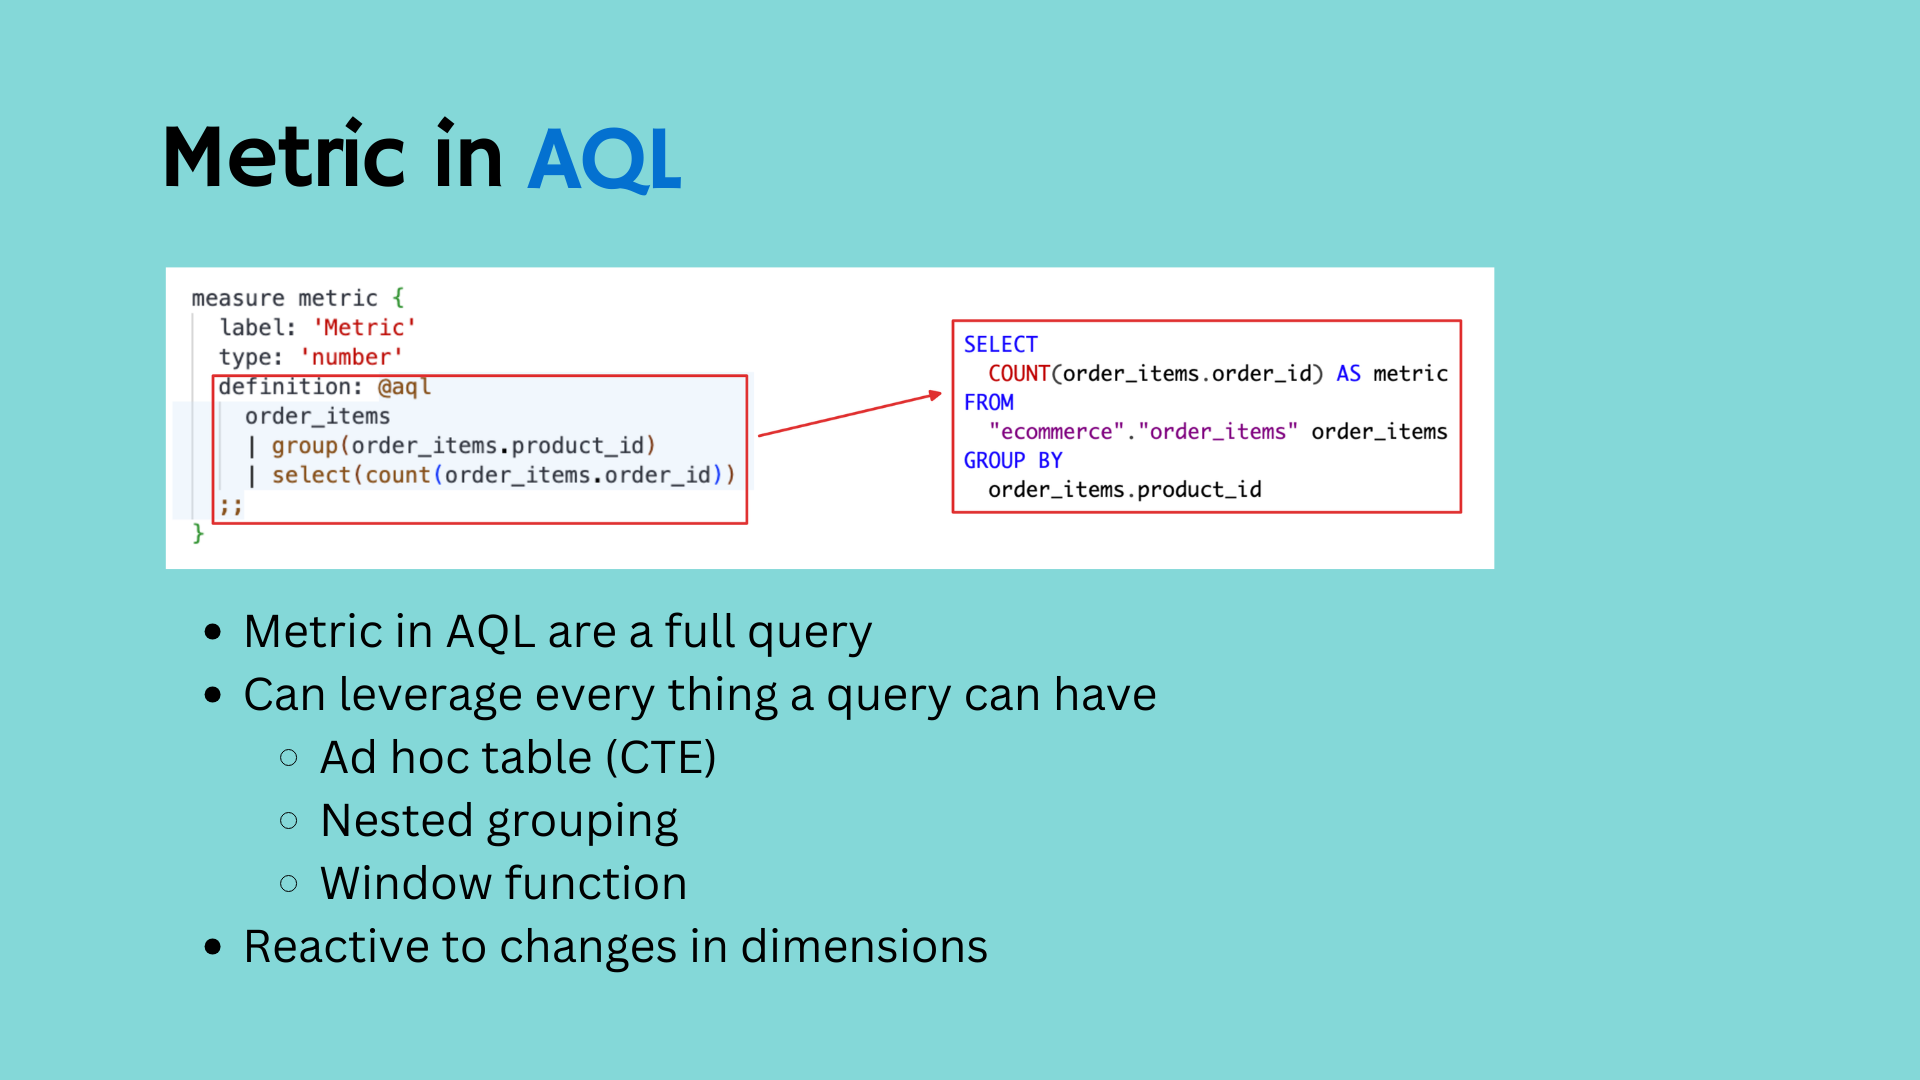
Introducing AQL
AQL (Analytical Querying Language) is both a query language and a metric definition language. It leverages the data semantic model defined with AML to allow you to query your data in a higher abstraction manner, especially composing and reusing metric-based queries.
With AQL, you can quickly implement analytics use cases that are typically complicated in SQL. Things like Percent of Total, Nested Aggregations, Level of Details, among other things.
AQL is designed based on Metrics-centric Thinking paradigm. In AQL, metrics are elevated to first-class status, which means they can be defined, manipulated and reused independently from tables and models.
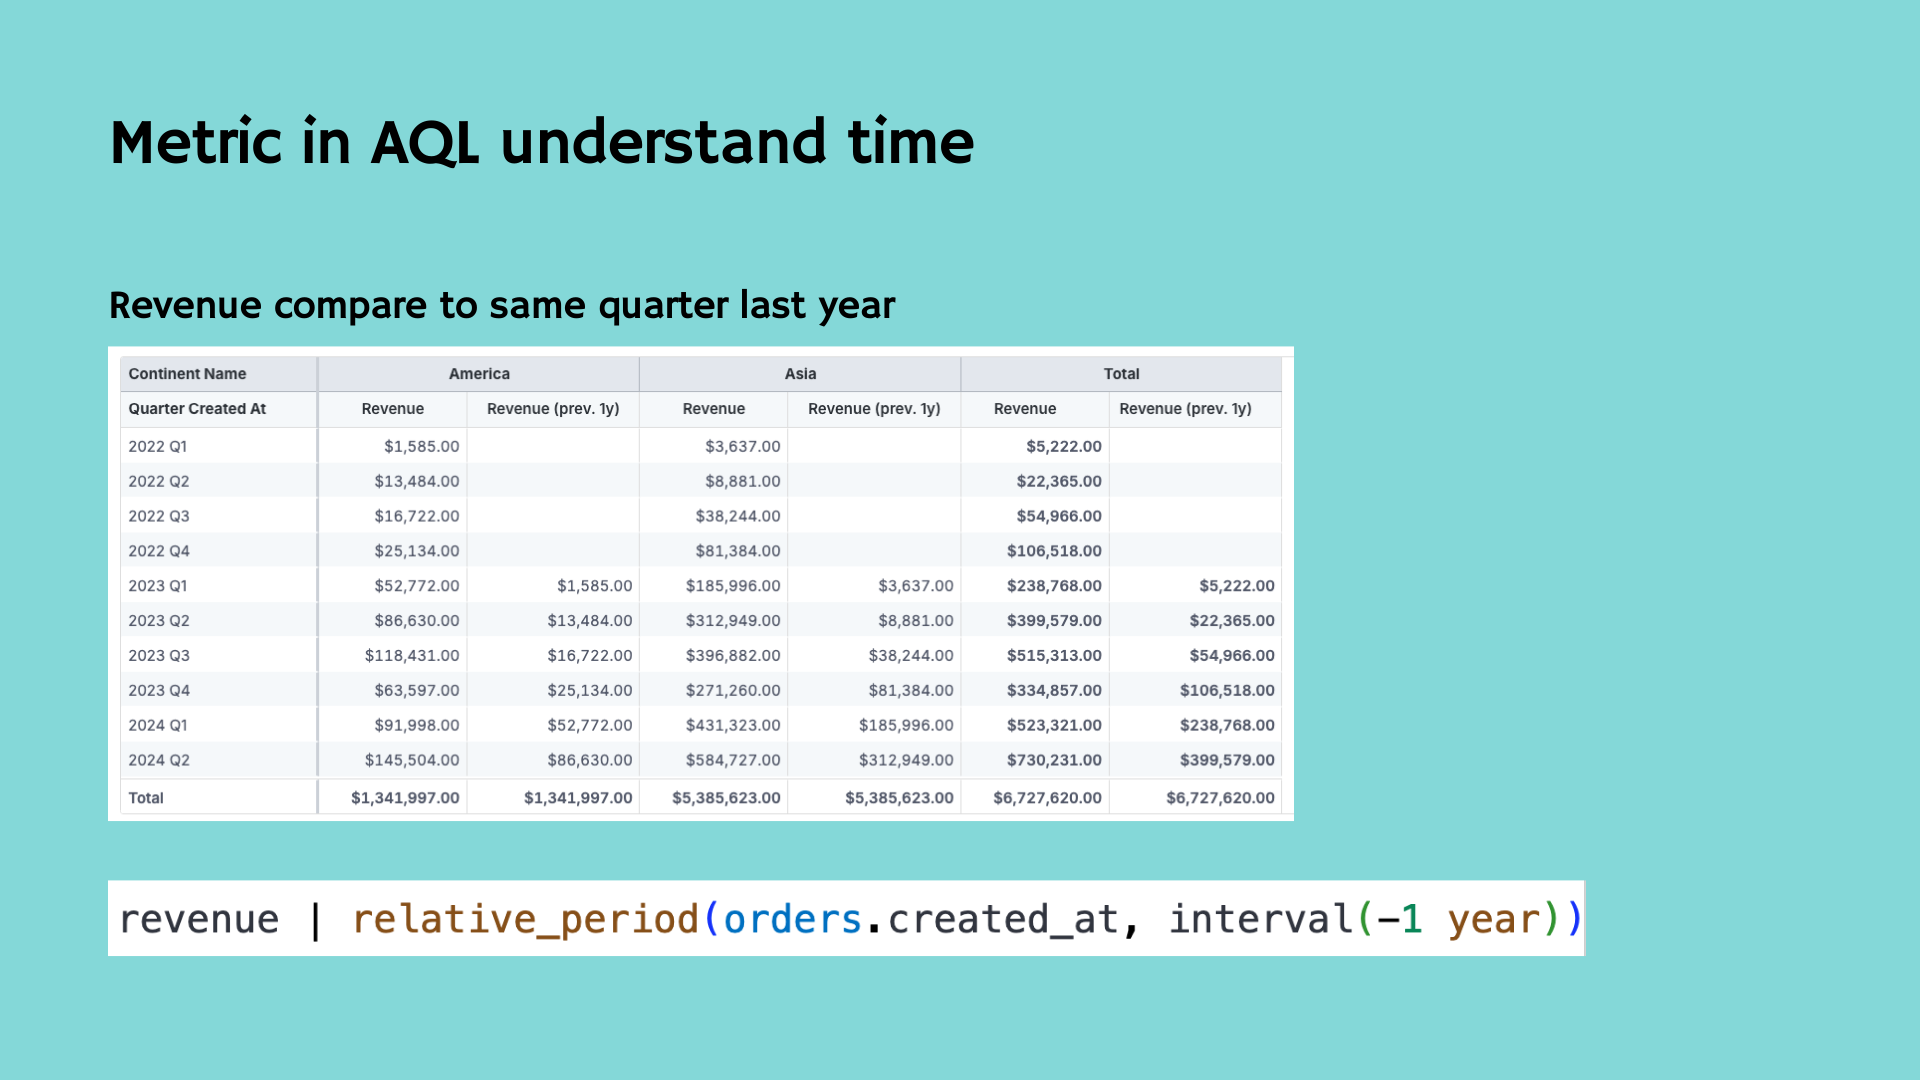
In traditional SQL or semantic layers, handling time-based comparisons—like year-over-year (YoY) or quarter-over-quarter (QoQ) changes—requires verbose joins, subqueries, or manual logic for each use case.
But in AQL, metrics understand time natively.
That means you can define a revenue metric once, and instantly reuse it to answer questions like:
- “Revenue compared to the same quarter last year”
- “Growth from previous month”
- “Trailing 12-month revenue”
AQL recognizes time-based patterns and allows you to apply temporal modifiers without rewriting the logic. This makes it dramatically easier to do period comparisons, trend analysis, and time-windowed aggregations — all without duplicating queries.
In SQL, window functions are powerful — but brittle. They require careful manual scoping, sorting, and partitioning. Even a small change in grouping can break the logic.
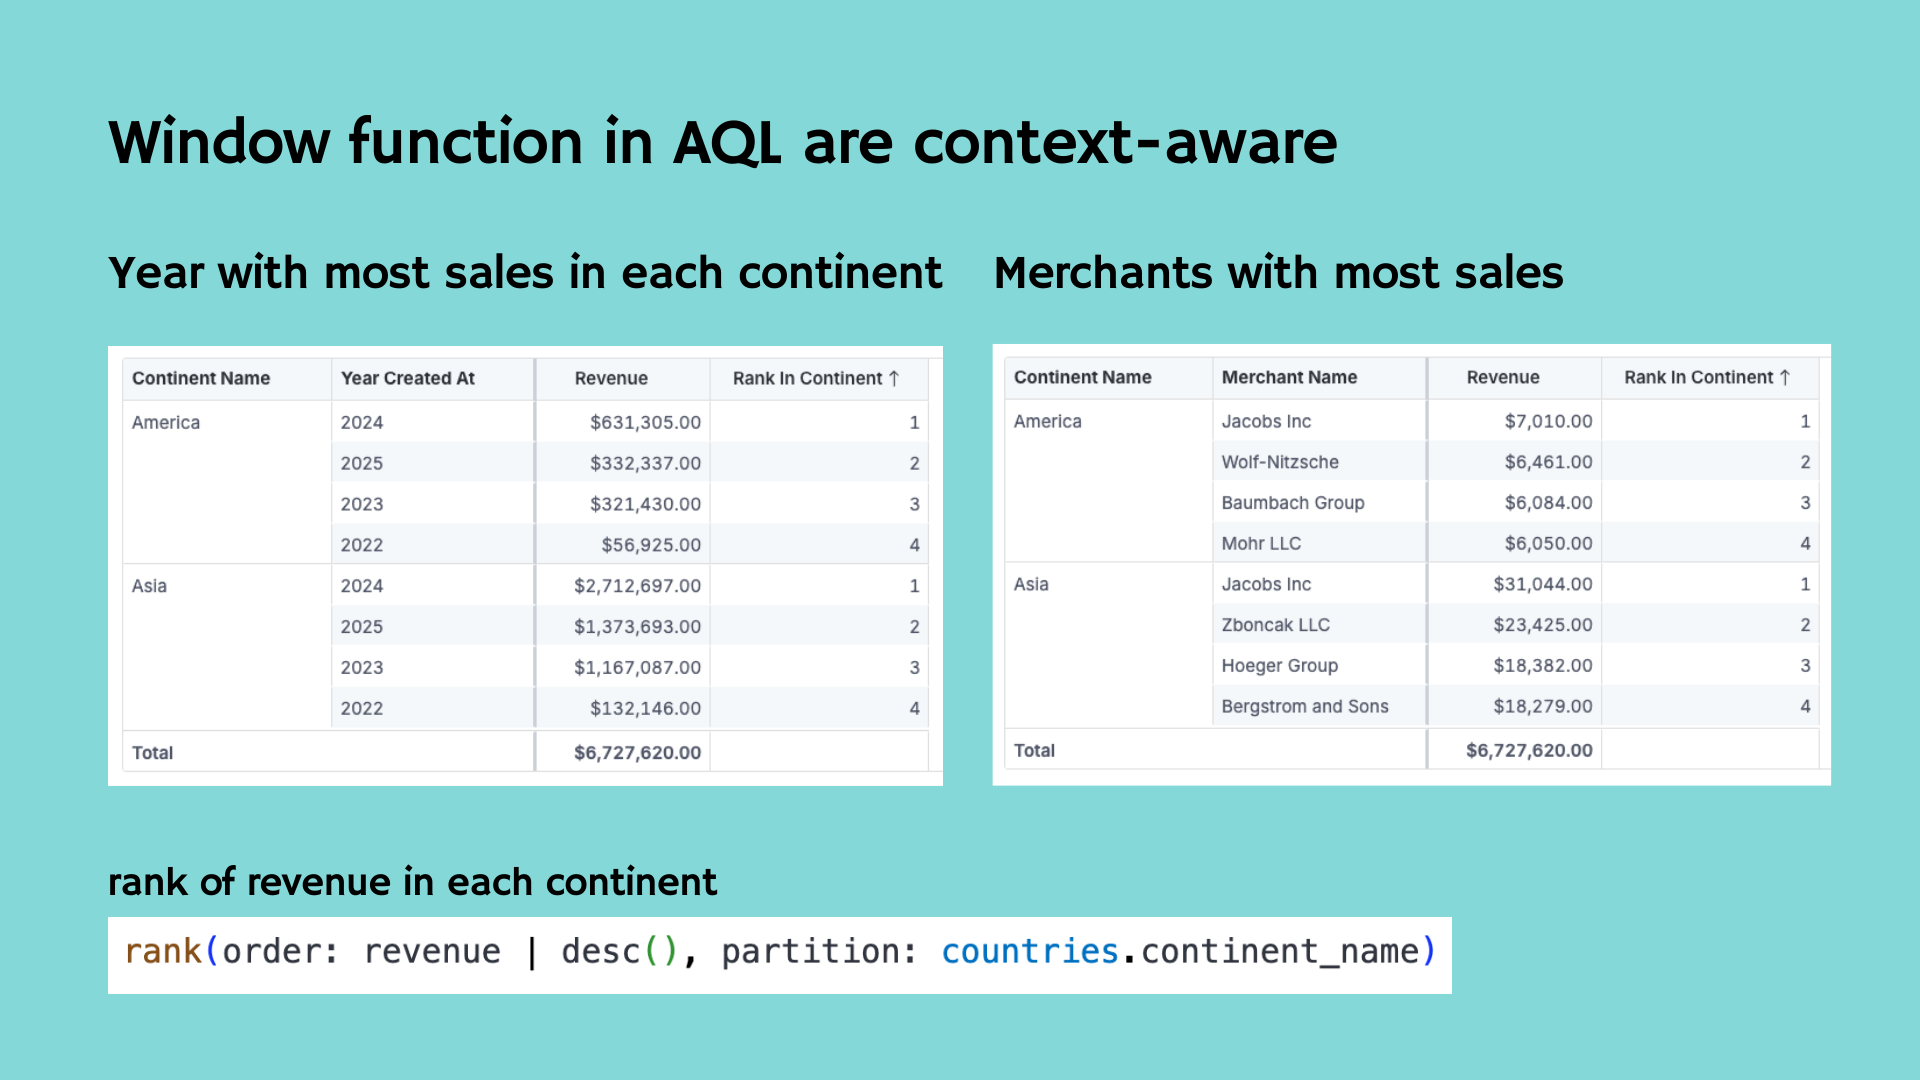
Another example, with AQL, window functions are context-aware.
This means they automatically inherit the surrounding dimensions and groupings. If you're ranking merchants by total revenue within each continent, you don’t need to manually define partitions and sorts. AQL handles it based on the context you’re working in.
As a result, complex operations like:
- Ranking top suppliers per region
- Calculating rolling averages by user cohort
- Determining percentiles by time period
…become simple, composable expressions.
You define the logic once, and AQL makes it responsive to whatever dimension the user explores.
The Outcome: True Self-Service
Traditional self-service in BI tools relies heavily on SQL or SQL-based semantic layers. While these models help reduce redundancy and enable drag-and-drop analytics, they struggle with complexity. Business users often face limitations when their questions involve nested aggregations, period comparisons, or custom cohort analyses. Each new variation typically requires manual SQL rewrites or new dataset creation, defeating the goal of self-service.
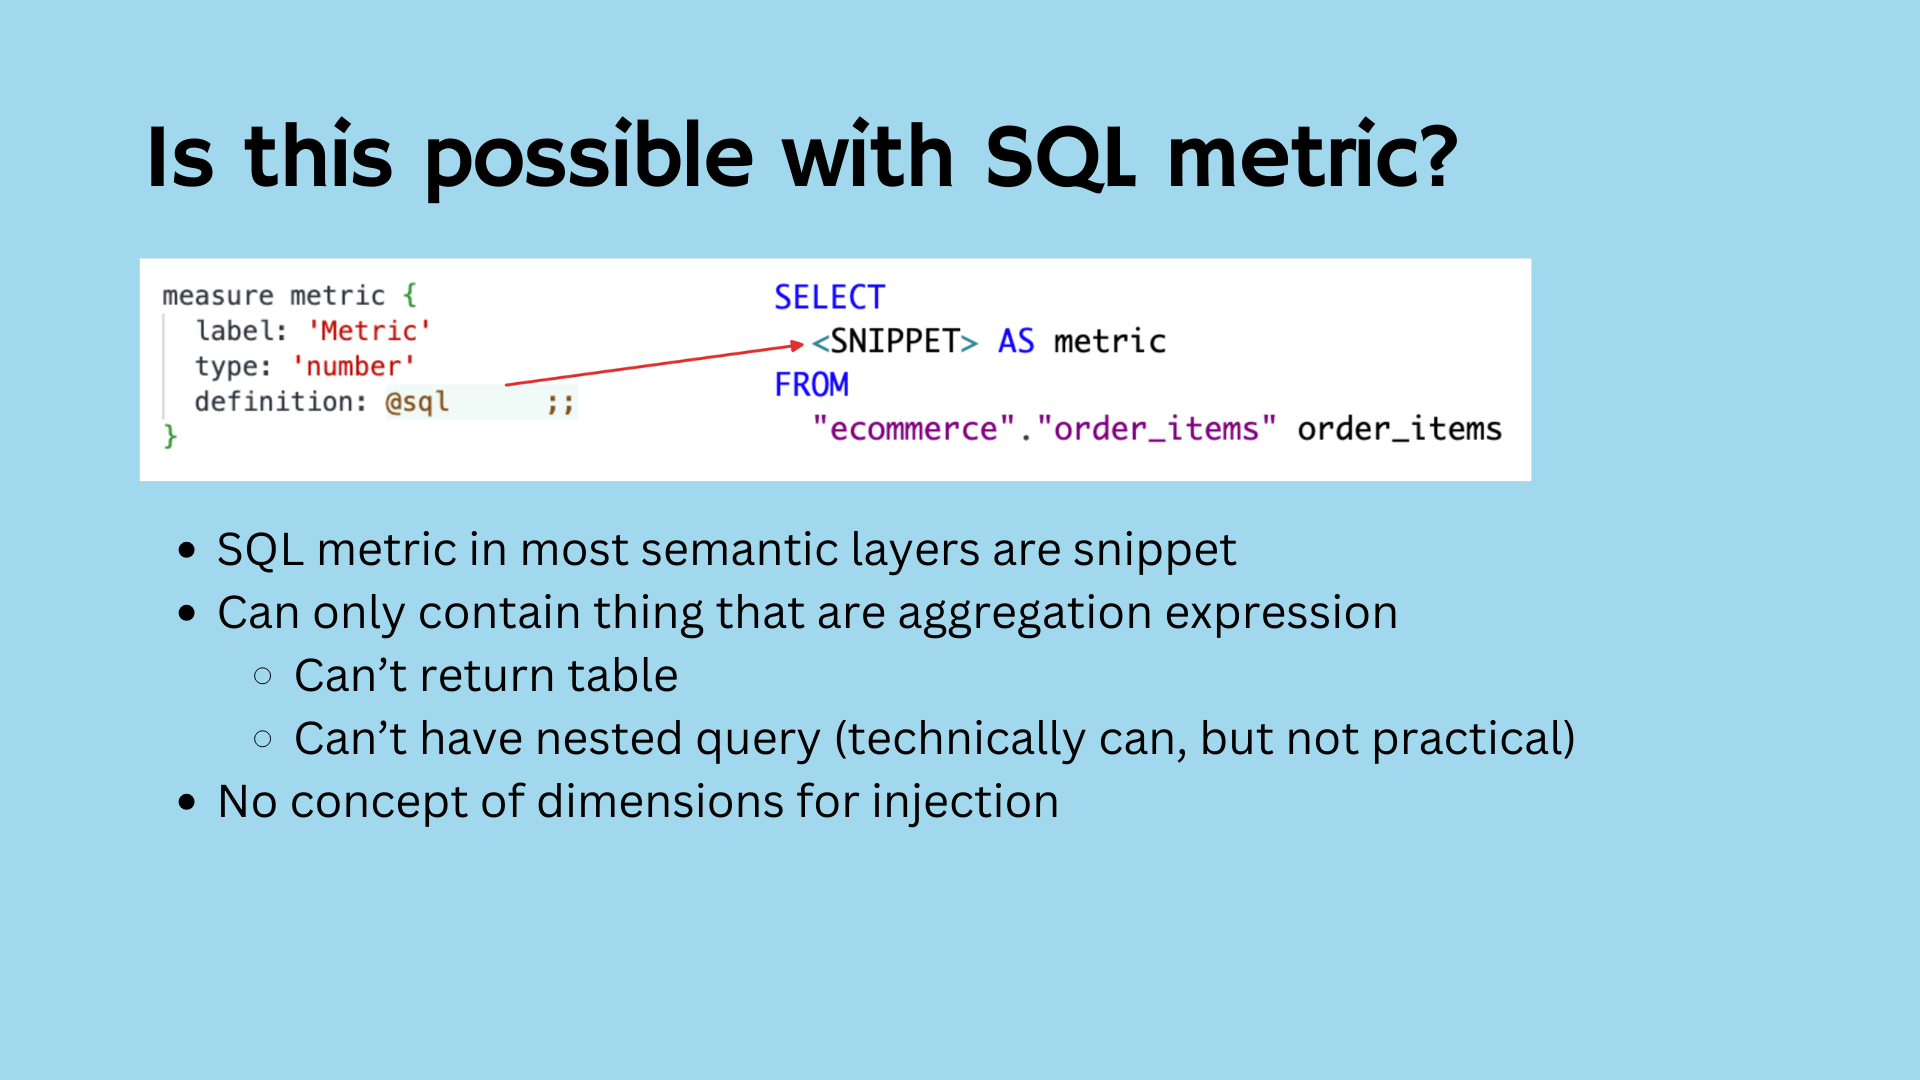
AQL (Analytics Query Language) changes that by treating metrics as full, composable queries rather than static aggregations. Unlike traditional SQL snippets that must be hardcoded into views, AQL metrics can:
- Create intermediate tables on the fly using business logic
- Inherit context dynamically, adapting to any grouping or dimension
- Support nesting, window functions, and time-aware operations
This means that once a metric is defined, it can be reused across any dimension or report without modification. Business users can explore complex questions—like “median revenue per cohort per quarter” or “year-over-year rank by supplier”, without writing or modifying SQL.
Bob gets to sleep. Adam dodges blame. Everyone wins.
Summary
- Traditional semantic layers limit metric complexity and flexibility.
- Pre-materialized tables don't scale across dimensions.
- AQL makes metrics composable, contextual, and expressive.
- Metrics become full queries—not just aggregates.
- Real self-service becomes achievable at scale.
What's happening in the BI world?
Join 30k+ people to get insights from BI practitioners around the globe. In your inbox. Every week. Learn more
No spam, ever. We respect your email privacy. Unsubscribe anytime.
