AI-Powered BI Tools: A Fact-Based Comparison (2026)
A structured evaluation of 10 AI-powered business intelligence platforms — covering natural language querying, semantic layer depth, reliability, and governance.
LAST UPDATED April 03, 2026
AUTHOR  Huy Nguyen
Most BI guides exist to game search engines. Not this one. Here's a fact-based, methodical breakdown of AI-powered BI platforms you can actually use.
Our approach:
- Facts are prioritized over opinions, no recommendations pushed
- Details are backed by official documentation
- High-level criteria are broken down into specific, measurable sub-points
- Findings are presented in clear, comparable tables
- Linking to real-world discussions from actual users
We understand we might come across as biased, since we're also a vendor selling AI-powered BI. Rather than claiming neutrality, we'll let the content below speak for itself.
Found an inaccuracy or want your tool added? Use this form.
What are AI-powered BI tools?
AI-powered BI tools are business intelligence platforms that use artificial intelligence, natural language processing, machine learning, and large language models, to help users query data, generate visualizations, surface insights, and enrich analytical models without writing SQL or building dashboards manually. The leading AI-powered BI tools in 2026 include Holistics AI, Power BI Copilot, Tableau Einstein, Looker Gemini, ThoughtSpot Spotter, Sigma Computing, Qlik AutoML, Zenlytics ZOE, Luzmo IQ, and Julius AI.
Each platform takes a different architectural approach to the same challenge: how to make AI produce reliable, governed analytical outputs rather than plausible-sounding guesses. The tools compared in this guide are: Holistics, Power BI, Looker, Sigma Computing, Tableau, Thoughtspot, Domo, Zenlytic, Hex.
Feature-by-Feature Comparison Table (Updating)
Scroll to the right to see more
| Dimension | |  Power BI Power BI | | | |  Thoughtspot Thoughtspot |  Domo Domo | | |
|---|---|---|---|---|---|---|---|---|---|
| Core Data Exploration Capabilities Natural-language support for common analytics operations, from simple totals to complex calculations. | |||||||||
| | Supports listing, filtering, breakdowns, aggregations, Top N, reference line, percent-of-total, and period comparison. source |  Users can query datasets in natural language to list, filter, and aggregate data. Copilot also supports basic summaries, time comparisons, and ranking based on natural queries. source | 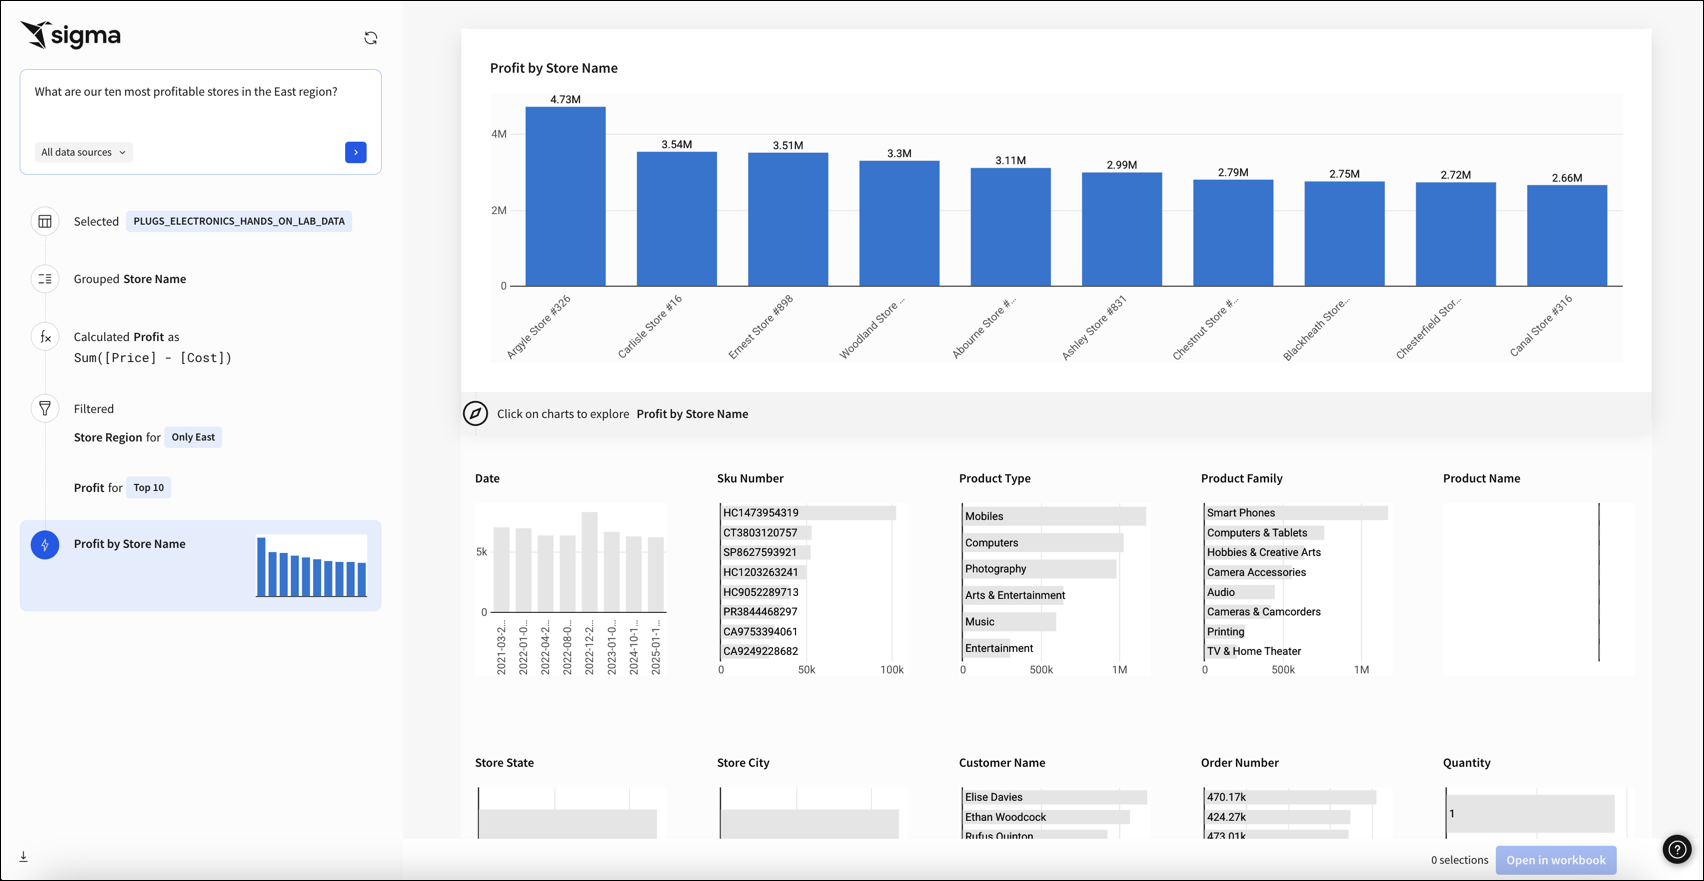 Users can ask questions in natural language using the Ask Sigma agent. All results are interactive and filterable. Period-over-period analysis is available in the platform. Ask Sigma Discovery auto-generates data collections to help users discover available data sources. source |  Enables users to query data using natural language and receive auto-generated visuals. It supports query for listing, filtering, aggregations, ranking and time series analysis source | 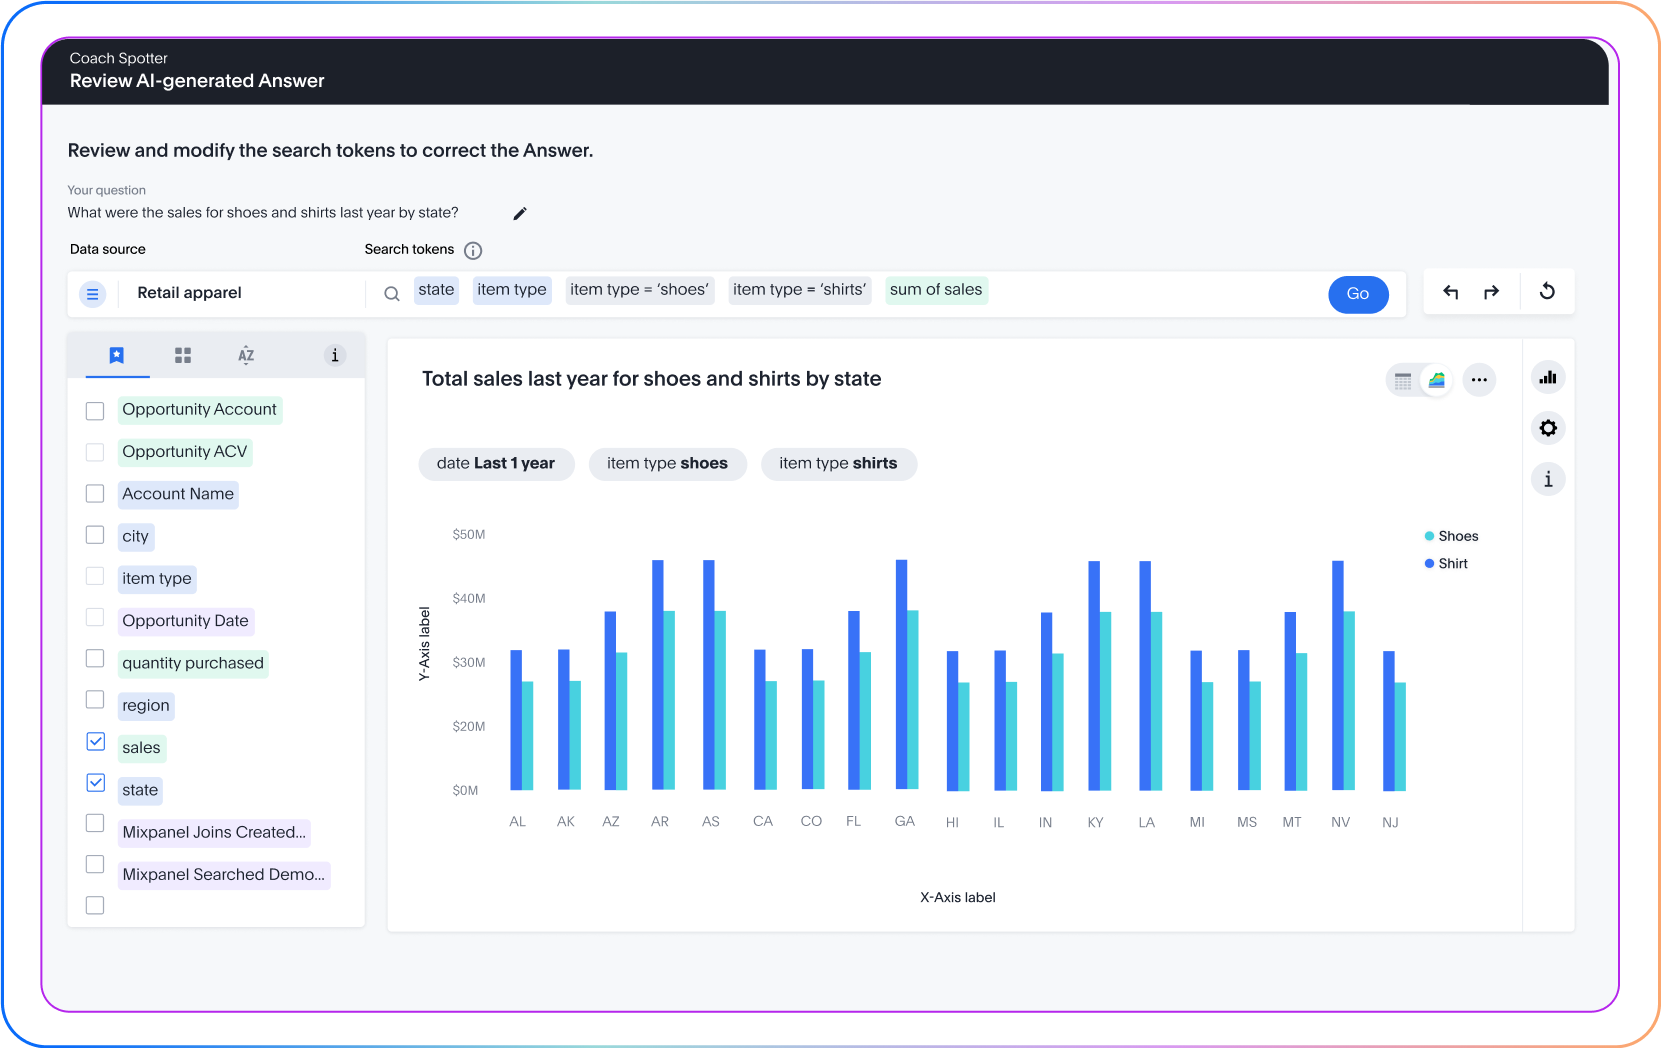 Supports natural language queries for: Listing, filtering dat, aggregations, comparisons, percent of total and ranking source |  Ask questions in natural language to generate charts, tables, and insights with follow-up clarifications. source | |||
| |  Holistics AI uses AQL, a composable query language that allows complex operations to be broken down into smaller, modular operations and combined together (like Lego blocks). source | ❌ | ❌ | ❌ | ❌ | Beast Mode AI + SQL Assistant Beast Mode AI Writer generates calculated fields from natural language. AI SQL Assistant turns words into precise queries and formulas. Prebuilt Forecasting model detects trends, seasonality, and confidence ranges automatically. source | Code Interpreter Sandboxed Python environment for complex analyses on governed query results and decision-making guidance. source | Notebook Operations Chained cell operations combining SQL, Python, and charts with one-prompt solutions for data workflows. source | |
| | WIP Features |  Copilot can summarize visuals and explain trends, but explanations are templated and don't expose query logic behind the scenes. source | 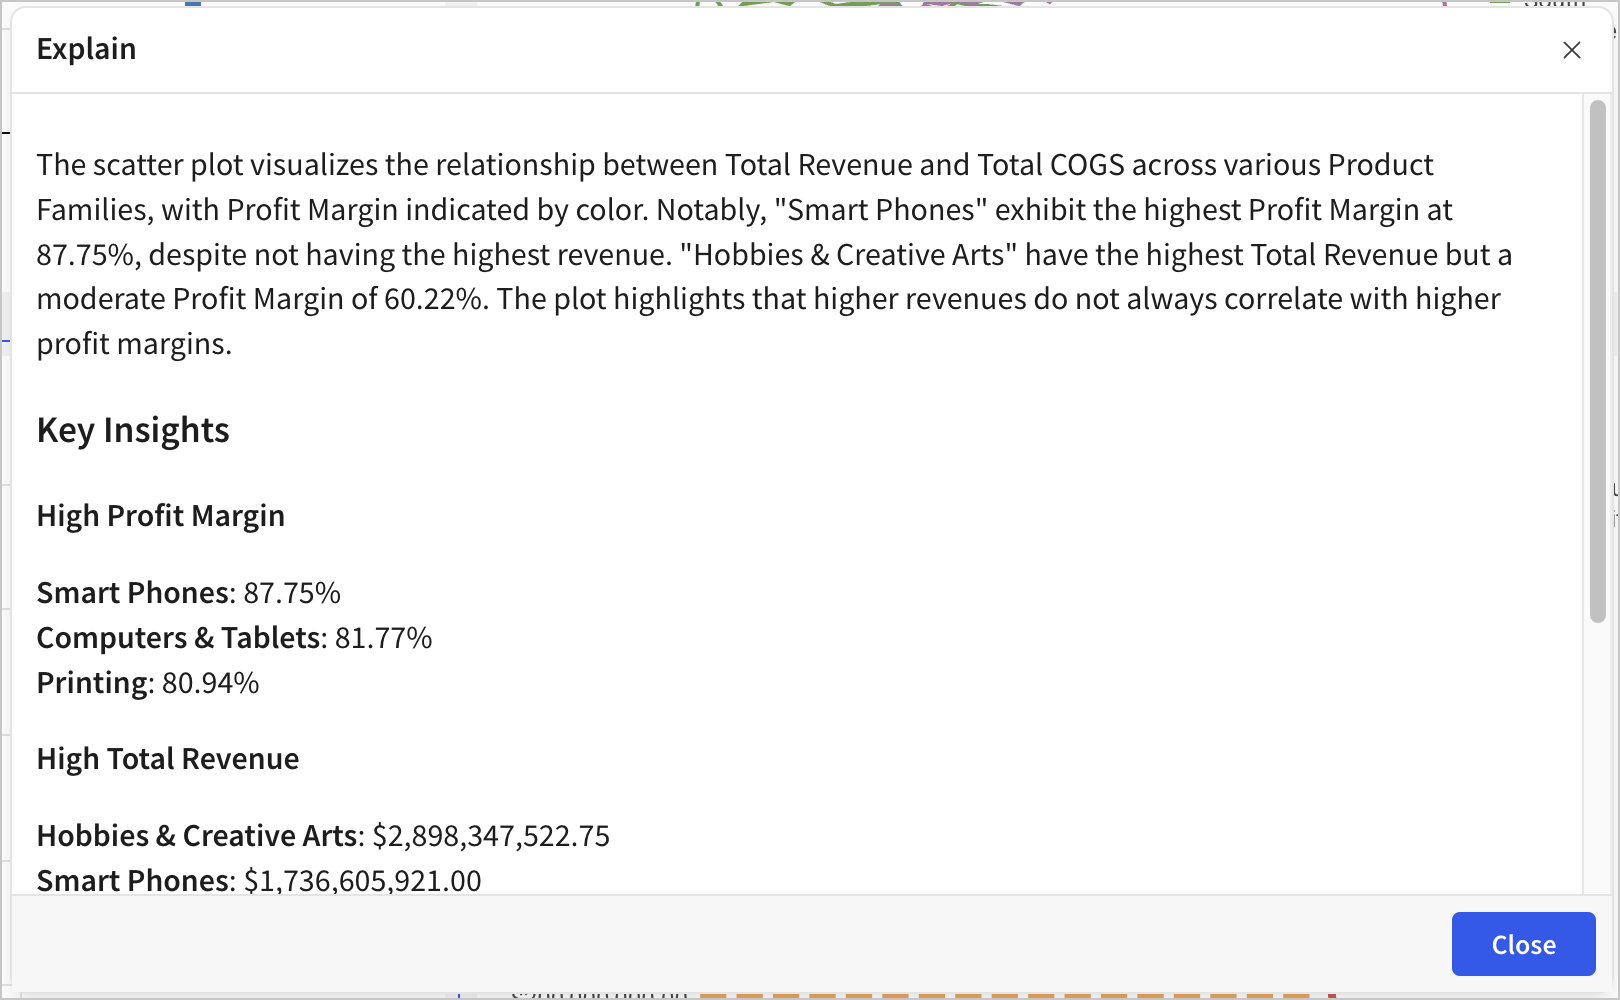 Sigma can describe charts and analysis results via Explain Charts with AI, generating insights, summaries, and contextual interpretations. source | Calculation Explanations + Dashboard Narratives Tableau Agent explains any calculated field (e.g., "Explain the 'Days to Ship' calculation"). Dashboard Narratives (Beta) generates summaries of dashboard content and chart insights for consumers. source | Visual + NL Summary Spotter can summarise results, show underlying logic, and surface key facts. source | Simple Summaries Turns long feedback and data into simple summaries for reports and automated writing tasks. source | Summaries with Citations ZOE builds text summaries and insightful visualizations from data. Inline citations provide data lineage — any numbers referenced in text summaries are cited with serially indexed elements linking back to the underlying query values. source | ||
| | WIP Features | ❌ | JSON Formatting Natural language prompts generate JSON formatting options for Looker visualization customization. source |  Users can edit any of the steps Ask Sigma took by browsing and selecting a different data source, applying a new formula, changing the filter, or altering the prompt. | Via UI Tableau Agent can create initial visuals, and users can manually customize them in the UI. | ❌ | Plot Configuration via NL Users can change chart type, fields, filters, sorts, and limits through the query drawer. ZOE supports plot configuration tips and tricks for customizing visualizations via natural language. source | Natural Language Charts Modify charts based on natural language requests through simple commands. source | |
| | Offers follow-up prompts and contextual suggestions mid-conversation. source | 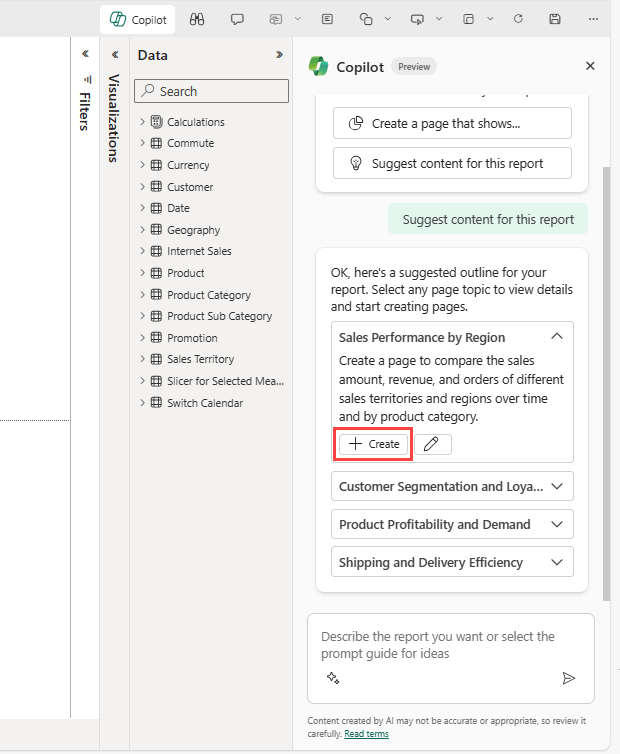 Copilot suggests possible report pages and summaries. source | Agent Collaboration Conversational Analytics (now GA) supports multi-turn conversations with reasoning transparency. Users can share built agents with colleagues for faster access to a single source of truth. Step-by-step reasoning is exposed in agent responses. source |  Show the answers to related questions, which users can explore further in a Sigma workbook. |  After creating a chart or calculation, Agent suggests additional analyses. source |  Spotter suggests follow-up questions based on context, ambiguity, or partial matches. source | Recommended Questions Suggests next steps and relevant questions to guide data exploration with recommended sections. source | Follow-up Questions Guides users through complex decision-making with contextual follow-up questions for clarification and refinement. source | |
| | Holistics AI auto-generates visualizations based on query context. Dashboard creation and auto-generated trends and analyses are WIP feature. source |  Copilot generates report pages with summary and charts from prompts source | Ask Sigma provides answers to natural language queries with basics charts. source | Tableau Agent support all chart types: bar, line, map, scatter, pie, tree map, etc, but only works on worksheets; not available in dashboards or stories. source | Auto-Chart Generation Ask questions in plain language and get instant answers with suggested visuals and charts. source | Generate charts and tables from natural language. Create new dashboards and add visualizations. source | |||
| | Built-in feature to query Holistics documentation within the UI. source | Standalone Copilot (Preview) Standalone Copilot experience (preview) can find and analyze any report, semantic model, and Fabric data agent the user has access to. Also answers from the LLM's general knowledge for non-data questions. source | ❌ No documentation search capability mentioned in Looker Gemini interface. | ❌ | ❌ | ❌ | ❌ No documentation search capability mentioned within Domo AI interface. | ❌ | ❌ |
| Core Semantic Layer Capabilities Underlying semantic-layer features that ensure consistent metrics, reusable logic, and governed definitions. | |||||||||
| | Generate Semantic Content (WIP) AI can generate model logic, relationships, and formulas grounded in the Holistics semantic modeling layer. source | ❌ Copilot does not generate data models or define relationships. All modeling must be done via Power BI Desktop using tools like Power Query or DAX. source | ❌ | ❌ | SpotterModel (New) SpotterModel is a new agent for automated semantic modeling. Available as an add-on. Enables automated creation of data models and relationships. source | ❌ No explicit automated semantic model generation or relationship creation mentioned for Domo AI. | ❌ | ❌ | |
| | Metadata Enrichment Holistics AI enriches metadata through automatic generation of labels and detailed descriptions, which helps increase reliability. source | 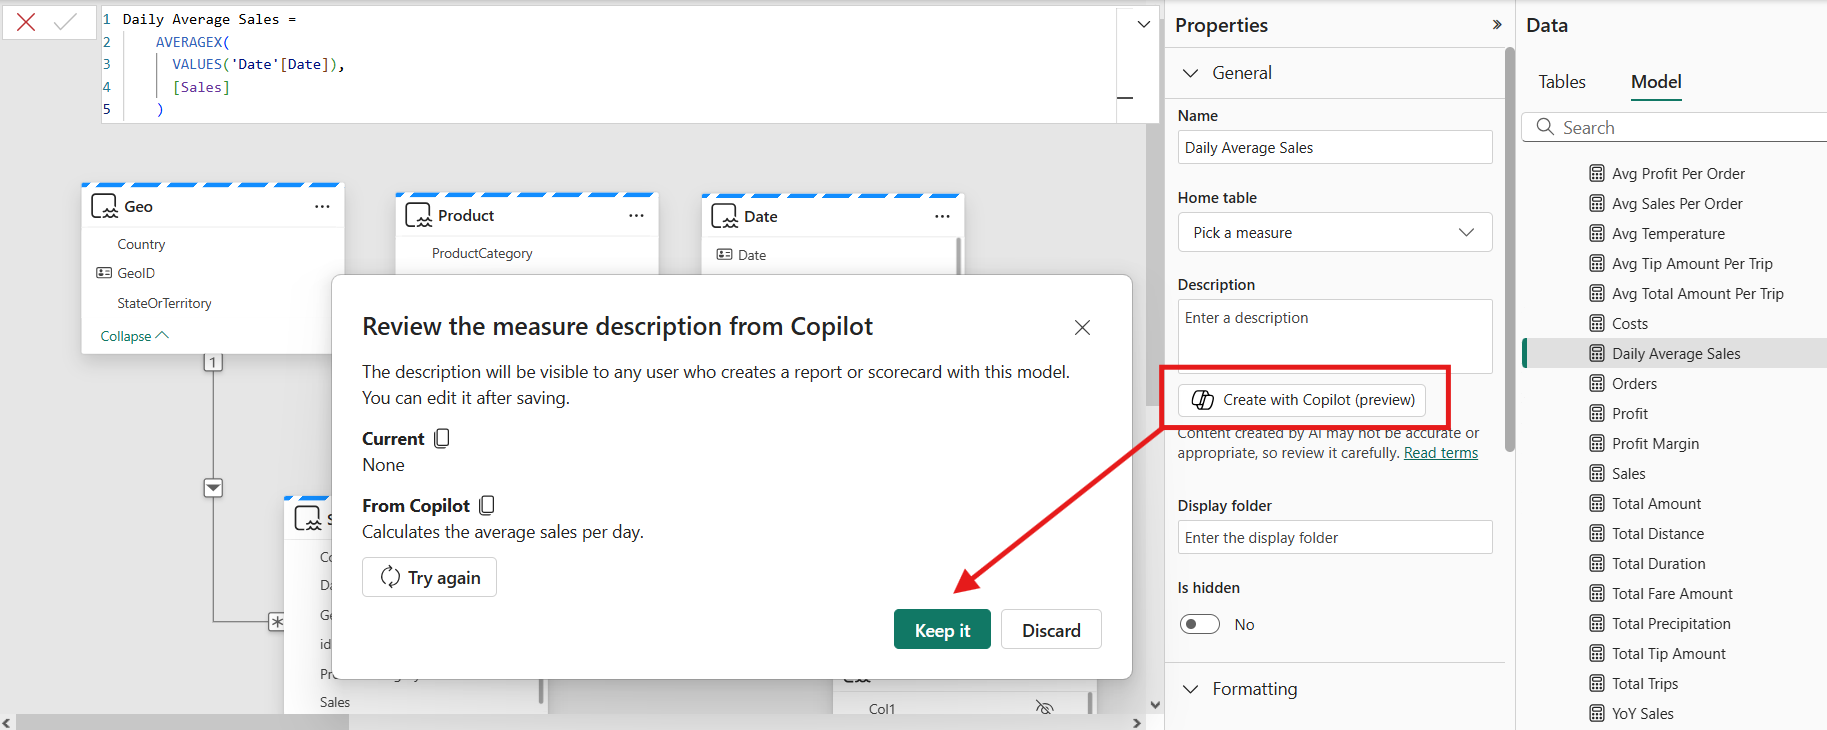 Copilot can add descriptions to your semantic model measures. source | Semantic Foundation LookML semantic layer provides LLM context and ensures centralized metric definitions preventing inconsistencies. source | ❌ | ❌ | ❌ | AI Readiness + FileSets Metadata optimization and contextualization for "AI readiness." FileSets turns images, documents, transcripts, and reviews into actionable intelligence for knowledge management. source | ❌ | |
| | AI-generated metrics can be refined in the GUI and promoted into the reusable semantic modeling layer. | Ad-hoc DAX Queries Copilot can generate DAX queries to answer questions that require ad hoc calculations. No reuse of ad-hoc calculations. | Centralized Metrics LookML provides centralized metric definitions. Future roadmap includes enhanced automated metric generation capabilities. source | Limited Support Metrics created by Ask Sigma are temporary expressions; cannot be promoted to a governed semantic layer. | Persistent Calculated Fields Tableau Agent creates calculated fields from natural language that are added to the Data pane and persist in the workbook. Includes naming, syntax generation, and post-calculation suggestions. However, these live in the workbook, not a centralized governed semantic layer. source | Limited Support Metrics created by Spotter are temporary expressions; cannot be promoted to governed semantic layer. | ❌ No explicit AI-generated reusable metrics or semantic layer metric creation mentioned in sources. | ❌ | ❌ |
| Data Context and Literacy Evaluate whether AI understand business context. | |||||||||
| | AML Semantic Modeling Layer Business metrics, dimensions, and relationships are defined in code-based semantic layer to provide comprehensive business context for AI. source | Strong Foundational Literacy Copilot interprets terms like “metrics”, “trends”, “drivers”, and “repeat visitors” correctly, applying standard analytical logic. source | Semantic Foundation LookML semantic layer aligns data and provides LLM context ensuring centralized metric definitions. source | Strong Foundational Literacy Ask Sigma interprets common analytical concepts correctly. | Strong Foundational Literacy Understands common analytical concepts such as: “break down”, “sum”, “growth”, “profit”. | Supported via Spotter Coach Spotter understands common analytical terms and operators and allows further enrichment. source | Platform-Driven Literacy End-to-end data platform supporting cleaning and loading provides foundation for AI analytical concepts. source | ||
| | Analysts can add common business contexts in the whole repo/organization, customize AI preferences and instructions, and add programmable logic based on dynamic conditions and user attributes. source | Via PowerBI Semantic Models Require updating semantic models with work with Copilot. source | LookML Alignment LookML semantic layer ensures AI outputs align with governed metrics and business definitions. source | Partial Support AI understands and reuses field names, measures, and models defined in Sigma. However, it doesn’t have deep semantic layer awareness or centralized business logic reuse. | Support with Data Index Tableau Agent indexes your data to understand the context, including field metadata (field captions, field descriptions (comments), data roles, and data types). source | Supported via Worksheets Built on governed Worksheets and enhanced with synonyms, user prompts, and SpotApps metadata. | Business Language Adaptation Understands business questions in organizational language, adapts to context and asks for clarity. source | ||
| | Strong Support Uses modeling schema and formulas, not raw data, to understand data structure. | Not Available | 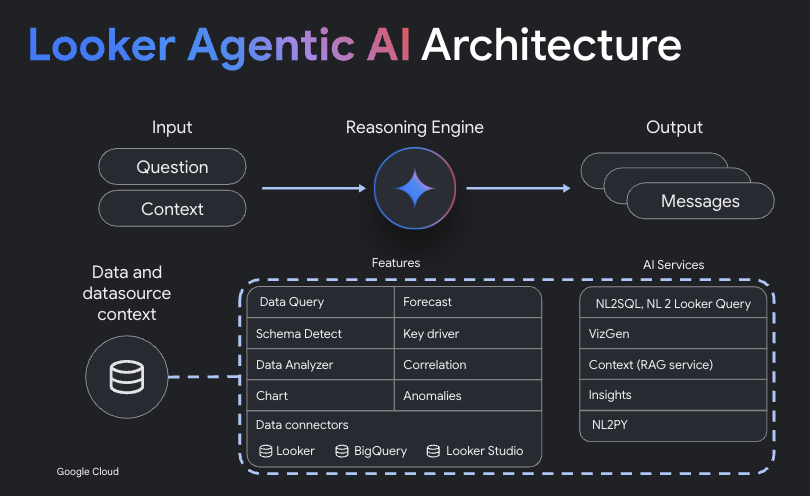 LookML provides database context. AI architecture utilizes dynamic knowledge graph for RAG. source | Not Available | Not Available | Not Available | 1000+ Connectors Connects to over 1000 sources and databases but no explicit AI schema understanding detailed. source | Schema Understanding Uses modeling schema and formulas rather than raw data to understand structure for trustworthy results. source | |
| Reliability Controls for inspecting, revising, and versioning NL-generated content. | |||||||||
| |  Displays AI “thinking steps” to explain how a result was generated. Follows multi-turn queries and allows clarifications mid-session. source | 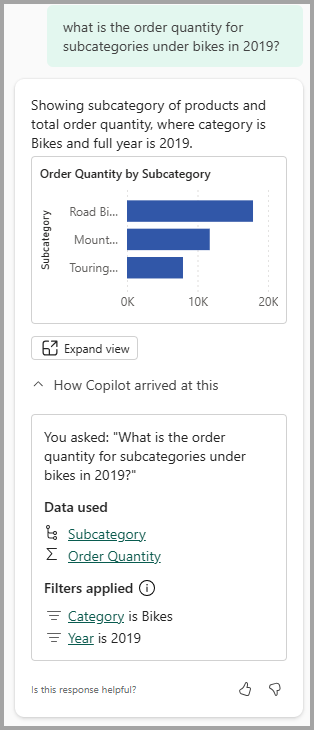 Copilot describes the visual it produced, including the fields it used to build or filter the visual. source |  Users can inspect and edit every exeuction step the AI takes during analysis. | Calculation Explanations Tableau Agent explains calculations when asked, showing syntax and logic. However, it does not expose step-by-step reasoning for chart generation like Sigma or Holistics. source | Matching Panel Shows how NL intent was mapped to data and which columns matched which tokens. | Basic Explanations Provides conversational interfaces with explanations but no detailed logic trees or query steps. source | Explainable AI Steps Clearly explains every step taken using traceable enterprise-grade logic, avoiding black-box answers. source | ||
| | Refine Metrics Every operation is visible and editable. Users have the option to tweak the step in the GUI without to start over. source | Undo/Accept After Copilot generates reports, then users have the option to start over by selecting the Undo button. source | Manual Updates Users manually update formatting options after Gemini generates JSON prompts and calculated formulas. source | Strong Support Support undo/redo/acceptand discard AI-generated content. | Recreate + Retry Recreate button returns to a previous viz without re-querying the LLM. Retry button regenerates the response. Not full undo/redo, but supports iterative refinement. source | Refine Queries Users can refine queries or change dimensions directly through follow-up. | ❌ No explicit undo/redo functionality for AI-generated steps mentioned in documentation. | Edit & Retry Users can edit prompts and retry responses mid-conversation. Dynamic Fields can be refined before promotion to the global model. source | |
| | Git Version Control Analytics definitions are stored as code with built-in versioning. | ❌ | Conversation History Users save conversations for future reference. No explicit version control for AI steps. source | Limited Support Changes are managed via Version Tagging. | ❌ | ❌ | ❌ No explicit version control or history tracking for AI-generated content mentioned. | ❌ | Modern Version Control Offers modern version control capabilities for efficient change management. source |
| Optimization Capabilities Features that improve business understanding and analytical accuracy. | |||||||||
| | Refine and Reuse Metrics AI-generated metrics and insights can be promoted back into the semantic layer to improve business understanding and self-service layer. | ❌ There’s no mechanism to promote Copilot-generated logic to a shared semantic layer or reuse generated metrics across models. | ❌ Future automated semantic model generation to democratize LookML creation with iterative business updates. source | ❌ | ❌ Users cannot refine and promote AI-generated outputs into reusable semantic assets. There’s no flywheel between exploration and modeling. | ❌ | ❌ No explicit mechanism to promote AI-generated insights back into semantic layer mentioned. | Metric Promotion AI-generated metrics can be promoted back into semantic layer to improve business understanding and self-service. source | |
| | Provides composable, declarative AQL metrics. AI can operate at the high-level language without worrying about lower-level details (like database-specific syntaxes, or specific SQL aerobics to achieve common analytic use cases). source |  Manually add context to data models and descriptions to DAX measures. Define dedicated schemas to help Copilot understand relevant tables, fields, and relationships. source | Data Governance LookML semantic layer enables governance integration maintaining compliance. Centralized metrics prevent inconsistencies. source | Via Input Tables (WIP) Users can Input Tables to correct the AI-generated outputs, and then securely write these corrections back to the warehouse, which trains the AI model continuously on live user. |  Manually hide unnecessary fields, add clear labels and field descriptions, and specify data types. source |  Spotter Coach help improves accuracy over time via curated synonyms, prompts, and feedback interactions. source | ❌ No explicit AI accuracy improvement features or composable metrics mentioned in documentation. | Personal Fields Create user-specific measures and dimensions that can be promoted into global data model via UI. source | |
| Security and Control Security frameworks and fine-grained access controls for embedded BI. | |||||||||
| | Query Execution Control AI queries are compiled from AQL (Analytics Query Language) using defined, strict access-controlled models. source | Power BI Security Power BI enforces RLS, CLS, and dataset-level access rules during Copilot interactions. Admins can control where Copilot is enabled. | Supported Sigma respects user permissions inherited from the data warehouse. | Einstein Trust Layer Tableau Agents operate on governed content and respect data access rules defined in Tableau Cloud or Server. | Adhere to Thoughtspot Security Sage respects governed Worksheets and adheres to user roles and permissions. | Trusted Governance Built-in governance with user-level control and trusted security framework for AI deployment. source | SSO + Access Grants Supports SSO via Microsoft Entra, Okta, and Google Workload Identity Federation. Includes IP whitelisting, access grants in data modeling, user attributes, user roles, and workspace groups with permissions. source | ||
| | Metadata Only AI only accesses modeling metadata, not raw data. source | Information Not Available | Via Warehouse Roles Admins control data access via warehouse roles; LLMs are only exposed to queried results—not raw datasets. | Einstein Trust Layer RLS and CLS respected via workbook permissions. source | Strong Support Admins control what data is sent to the GPT layer, including metadata and sample values. | FGAC Support Fine-Grained Access Control to content-based security using Domo PDP with flexible security features. source | ❌ | ❌ | |
| | OpenAI Keys Organizations can use their own OpenAI keys for governance and cost control. | ❌ Copilot runs on Microsoft-hosted Azure OpenAI infrastructure. Customers cannot plug in their own models or keys. | ❌ No documentation for custom OpenAI keys or models support mentioned in sources. | Use Your Own Agentic AI Write a simple SQL function in Sigma to call an AI model from your cloud data warehouse and run it on data columns. | ❌ | Flexible LLM Selection Pro and Enterprise plans support flexible LLM selection, allowing organizations to choose their LLM provider. Previously limited to Azure OpenAI only. source | External Models Connect to any model safely including OpenAI and Anthropic. Bring external models to work. source | ❌ | ❌ |
| | Code-based Change Management Changes and model definitions are versioned as code and governed with Git, supporting traceability. | Via PowerBI Service Activity is logged in the Power BI service for auditing purposes. | ❌ No explicit documentation for AI interaction logging or auditability features found. | Logging and Auditing Sigma’s enterprise controls include logging via warehouse and platform audit trails. | Salesforce Admin Tools Supported via Salesforce Admin tools | Sage Logging ThoughtSpot logs Sage interactions and disables prompt persistence and model retraining. | Usage Analytics Built-in governance and usage analytics with platform stats for responsible AI deployment monitoring. source | ❌ | ❌ |

How To Evaluate AI-Powered BI Tools
How does AI work in BI tools?
AI in business intelligence operates through three distinct architectural patterns, each with different reliability characteristics:
Pattern 1: Text-to-SQL. The AI translates a natural language question directly into a SQL query against the database. Tools like Julius AI and early implementations of Power BI Copilot use this approach. Text-to-SQL is fast to implement but fragile — the AI has no understanding of business definitions, so "revenue" might mean gross revenue in one query and net revenue in the next. Without a semantic foundation, the AI is guessing which tables and columns to join.
Pattern 2: Semantic-layer-aware AI. The AI queries a governed semantic layer — a centralized definition of metrics, dimensions, and business logic — rather than raw database tables. Looker Gemini queries LookML definitions. ThoughtSpot Spotter queries configured Worksheets. Zenlytics ZOE queries its Cognitive Layer. This approach improves consistency because the AI works within defined business rules, but the reliability depends on how rich and complete the semantic layer is.
Pattern 3: AI-native architecture. The semantic layer is designed from the ground up to be machine-readable. Holistics AI generates AQL (Analytics Query Language) — a composable, analytics-specific query language — rather than SQL. Because AQL encodes analytical intent (period comparisons, nested aggregations, percent-of-total) as first-class operations, the AI can reason about analytical patterns instead of translating intent into low-level database instructions. Every analytics artifact is code, version-controlled in Git, making AI outputs inspectable and auditable.
The pattern matters because AI amplifies the quality of whatever foundation it sits on. If the semantic layer is shallow — only answering first-order questions like "show me revenue by region" — the AI will hit a ceiling on the same questions. This is the "semantic ceiling" problem: AI cannot answer questions the underlying data model was never designed to support. An AI-ready semantic foundation means the layer is rich enough in metric definitions, relationships, and composable logic that AI can handle multi-step analytical reasoning.
What is the role of a semantic layer in AI-powered BI?
A semantic layer is a centralized definition of business metrics, dimensions, and logic that sits between the data warehouse and the user-facing BI interface. In AI-powered BI, the semantic layer serves as the AI's understanding of the business — it determines what the AI can reliably answer.
Without a semantic layer, AI-powered BI tools produce inconsistent results. "Revenue" might be calculated differently depending on which table the AI selects. Two users asking the same question get different numbers. Trust erodes, and the organization reverts to manual analysis.
The depth of the semantic layer directly determines the ceiling of AI capabilities:
| Semantic layer depth | What AI can answer | Example tools |
|---|---|---|
| No semantic layer | Simple queries against raw tables; high hallucination risk | Julius AI |
| Basic semantic layer | First-order questions (metrics by dimensions); breaks on follow-ups | Power BI Copilot (DAX-based), Tableau Einstein |
| Rich semantic layer | Multi-step analytical reasoning, composable metrics, period comparisons | Holistics AI (AQL), Looker Gemini (LookML), ThoughtSpot Spotter |
| AI-native semantic layer | Full analytical workflows; AI generates governed, inspectable code | Holistics AI (analytics-as-code + AQL) |
Among the tools compared here, Holistics AI and Looker Gemini have the deepest semantic modeling. ThoughtSpot Spotter works against configured Worksheets that function as a lightweight semantic layer. Sigma Computing queries the warehouse directly but adds formula-level AI assistance. Power BI Copilot works through DAX, which provides some abstraction but is not a full semantic layer in the traditional sense.
The evaluation framework below reflects a specific point of view: AI in BI is only as reliable as the foundation it operates on. Each dimension is designed to test whether an AI-powered BI tool can produce trustworthy, governed results at scale — not just impressive demos.
What core capabilities should an AI-powered BI tool have?
An AI-powered BI tool should support the full analytics workflow: querying data, enriching the data model, and generating visual outputs. The core capabilities fall into three areas:
Data exploration. The AI should handle filters, aggregations, period-over-period comparisons, percent-of-total calculations, and rankings. It should support multi-step analytical questions — not just "show me revenue" but "show me revenue by region, compare to last quarter, and highlight the top 5 by growth rate." Holistics AI handles these through AQL's composable metric logic. ThoughtSpot Spotter uses natural language search against governed Worksheets. Power BI Copilot generates DAX queries and narrative visuals.
Semantic layer enrichment. The AI should help data teams build and improve the semantic model — auto-generating data models, suggesting metric definitions, adding descriptions and annotations. This is where tools diverge sharply. Holistics AI can generate AQL-based metric definitions that data teams review and promote into the governed model. Looker Gemini generates LookML parameters. Most other tools treat the semantic layer as read-only for AI purposes.
Analytical content generation. The AI should generate charts, dashboards, and narrative insights from natural language prompts. Sigma Computing's Ask Sigma triggers agentic workflows that locate data sources and build multi-step analyses. Tableau Einstein uses predictive models and automated discovery. Julius AI generates Python code and statistical analyses. The key question is whether generated content is governed (traceable, editable, version-controlled) or ephemeral.
How does data context affect AI reliability in BI tools?
AI in BI only works if the system understands business context, not just language syntax. This dimension separates tools that produce reliable answers from tools that produce plausible guesses.
Five levels of data context matter:
- Base data literacy. Can the AI parse analytical concepts like "growth," "breakdown," "top 10 by revenue"? All ten tools handle basic analytical terms, though accuracy varies.
- Business context. Does the AI interpret questions using the semantic model — dataset relationships, field descriptions, naming conventions — or does it guess from column names? Holistics AI, Looker Gemini, ThoughtSpot Spotter, and Zenlytics ZOE all leverage semantic definitions for business-aligned query generation.
- Database context. Does the AI understand schema structure, data types, join paths, and granularity? Tools with deep semantic layers (Holistics, Looker) handle this natively. Text-to-SQL tools (Julius AI) rely on schema inference, which is less reliable.
- Result context. Can the AI explain what a chart means — not just display it? Sigma Computing, Holistics AI, and ThoughtSpot Spotter offer AI-generated explanations of query results.
- Conversational context. Does the AI handle multi-turn questions and mid-query corrections? Holistics AI, ThoughtSpot Spotter, and Zenlytics ZOE support multi-turn conversational analytics. Power BI Copilot and Tableau Einstein are primarily single-turn.
How should AI-powered BI tools be optimized over time?
A useful AI-powered BI tool should not be static. It should allow teams to improve the AI's understanding of the business by feeding corrections and new definitions back into the semantic model.
Key optimization capabilities:
- Semantic enrichment loop. Users define new logic and promote it into the governed layer. Holistics AI supports this through AQL — analysts can refine AI-generated metrics and promote them into the shared semantic model. Zenlytics ZOE allows "Personal Fields" that can be promoted to the global model.
- Composable metric logic. The AI should support reusable analytical patterns — "top 5 customers by revenue growth" should be a composable query, not a one-off SQL statement. Holistics AI's AQL and Looker's LookML both support composable metrics, though through different mechanisms.
- Guided learning. The system surfaces working examples that help users build complex queries. ThoughtSpot Spotter suggests searches. Holistics AI provides programmable context — analysts can define organization-level instructions, business logic, and workflow guidance that shape how the AI generates queries.
An optimizable AI system improves with institutional knowledge. Future users benefit from past corrections, making the AI faster and more accurate over time.
How reliable are AI-generated analytics?
AI-powered BI tools that generate metrics, dashboards, or models must meet the same reliability standards as human-built analytics. Three capabilities determine reliability:
- Inspectability. Every AI output should show which metrics were used, how filters were applied, and how results were calculated. Holistics AI makes every step visible and editable — no black boxes. Looker Gemini shows the generated LookML. ThoughtSpot Spotter displays matched search tokens for verification.
- Modifiability. Users should be able to accept, reject, or modify individual elements of AI output without starting over. Sigma Computing and Holistics AI both support fine-grained human-in-the-loop refinement.
- Version control. Changes to AI-generated content should be tracked: who modified what, when, and why. Holistics and Looker both support Git-based version control for analytics definitions. This is critical for audit trails, rollback capability, and regulatory compliance.
How should AI-powered BI tools handle scalability?
An AI BI tool must scale operationally — helping teams grow analytical output without multiplying manual work or creating inconsistent logic.
Evaluate three scalability dimensions:
- Contextual scaling. The AI uses semantic metadata to consistently interpret new queries across datasets. As the data model grows, AI accuracy should improve, not degrade. Tools with rich semantic layers (Holistics AI, Looker Gemini) handle this better than text-to-SQL approaches.
- Metric generation at scale. The AI recommends standardized metric logic (year-over-year growth, percent-of-total) across data domains and enforces consistency at query time. Holistics AI's AQL enables composable metrics that prevent metric fragmentation.
- Cross-team workflows. The system supports workflows where business users define new metrics and data teams validate or promote them. Zenlytics ZOE and Holistics AI both support this explorer-to-modeler promotion pattern.
What security controls matter for AI-powered BI?
AI in BI introduces new security considerations beyond traditional access controls. The AI must respect existing permissions and not escalate privileges.
Critical security capabilities:
- Query execution control. The AI enforces dataset-level, row-level (RLS), and column-level (CLS) security. It must not generate queries that access data the requesting user is not authorized to see. Holistics, Looker, and ThoughtSpot enforce permission-aware query generation.
- Input control. Administrators control which metadata, sample data, or query results are visible to the AI. This prevents unintentional exposure of sensitive context. Holistics AI provides fine-grained controls over what data the AI can access.
- Custom AI credentials. Organizations can use their own AI API keys (OpenAI, Anthropic) for cost tracking, privacy control, and data residency. Holistics AI and Sigma Computing support bring-your-own-key configurations.
- Logging and auditing. All AI actions — what was suggested, accepted, rejected, edited — are tracked for compliance and debugging.
Community Discussions
Discover what other practitioners are discussing about this topic.

r/analytics
Posted on April 2025 View source
What is the future of Business Intelligence? What should I expect in the next 5 years?
Whats the future of Business Intelligence gonna look like in the next 5 years im kinda curious but also confused like will BI tools get smarter or just more complicated how much will AI and automation actually change the game can we expect Business Intelligence to predict trends before they happen or is that just hype and what about data privacy with all these new techs coming up should we be worried also will small businesses finally get access to pro-level Business Intelligence without needing a PhD to understand it or is it gonna stay expensive and elite im really wondering if anyone else feels both excited and a bit nervous about where BI is headed.
2top comments
r/BusinessIntelligence
Posted on June 2025 View source
Anyone using AI in Business Intelligence?
1top comment
Yes, mostly I use it for refining my SQL queries or to see what are the different ways in which I can solve the same problem. It's quite helpful in that sense.
I also use it to review queries of my juinor team members. To see if I may have missed out on anything. It helps with that extra set of eyes at times.
And to create documentation for dashboards/reports.
I also use it to ask questions which I can use in stakeholder meetings for requirement gathering. For eg, I explain the context of the meeting and then ask the AI to roleplay with regards to what questions I should be asking in that specific meeting. Helps me prepare and also helps understand perspectives from different POVs.
r/BusinessIntelligence
Posted on March 2025 View source
So has your company actually embraced AI for BI and analytics, or naw?
The C-suite constantly goes on and on about how we're AI-first, etc., but the rubber doesn't seem to meet the road. We have some AI resources like CoPilot on top of MS Office, Salesforce Agent Force, and some people are using their own personal AI accounts -- just curious -- how has it been where you work?
2top comments
My guess is that the bulk of the companies are just bull$#!7ing with the buzzword. To successfully introduce AI into your BI, you need clean orderly data.
Go ahead and tell me the last time everyone cheered when the data governance team came through the door.
People mostly rool their eyes and crawl into a ball.
So - C suite seems to think AI can “answer all their questions”.
So I respond with “what are the questions you are wondering? I can pull data, schedule reports, to your inbox, or build live dashboards with graphs in any color of the rainbow!” - which is usually met with blank stares.
That’s why I know AI isn’t worth the trouble. It’s a solution to a problem we don’t have.
r/BusinessIntelligence
Posted on July 2024 View source
Has anyone used any AI-powered BI tools? What was the experience like?
Not going to post them here but there has been a lot of 'chat with your data' apps recently.
I am not a professional analyst but I have use ChatGPT in the past to help me write SQL queries, so I can see some appeals with them, although I also can't imagine how these tools can deal with the messy nature of badly maintained tables with duplicated names and nonsensical field names etc.
I also see some of these tools advocate for dynamically generated dashboards (since you can just ask questions to drill down etc.) though in my experience I don't usually need to adjust the dashboard often.
I am curious if anyone here has used these tools? What was the experience like?
2top comments
Some of the tools are getting better, but I can't help but think they still aren't really solving a problem.
If you're technically minded with some experience in data, then none of them are doing anything better/faster than what you can do with SQL or a BI tool.
If you're on the business side, they still aren't good enough because as the other poster said, you are reliant on a semantic layer so it's not that much better/faster than asking someone for a new dashboard.
The only way these tools can be halfway effective is if they sit on top of a well manicured semantic layer. I also think that the real winner will be the platform that figures out how to invoke an action from the insight. I.e. the analysis picks up on repeat customers and be able to recommend an action to take for those customers and then kick off the process with a simple push of a button …or if the action is low risk enough to do it automatically.
r/BusinessIntelligence
Posted on Feb 2025 View source
Who is actually using AI + BI tools like Thoughtspot, Zenlytic, etc. ?
Bombarded nonstop with talk of AI everything, and a couple of case studies here and there with small companies that I've never heard of. Even Databricks, one of the big guys, keeps mentioning the same customer (Sega) whenever they talk about their BI genie.
So my question is - who is actually using this stuff? Is anyone?
Second question - if you or your company use any of these tools - when did you start using them? How has the experience been so far?
So my question is - who is actually using this stuff? Is anyone?
Second question - if you or your company use any of these tools - when did you start using them? How has the experience been so far?
1top comment
I seriously think that at the end of the day maybe 1% or less of companies at any given point are at a data maturity stage where they could truly leverage cookie-cutter BI-AI solutions. The rest of us are still cleaning up messy data and figuring out what the proper business logic is.
AI-Powered BI Tools: Detailed Profiles
The ten platforms profiled below represent distinct approaches to integrating AI into business intelligence. They are grouped by architectural pattern, not ranked by preference. Each profile covers the AI architecture, key differentiators, limitations, and the buyer context where the tool fits best.
1. Holistics AI
Holistics AI is an AI-native analytics platform built on three foundational pillars: a rich semantic modeling layer, AQL (Analytics Query Language) for composable metric logic, and analytics-as-code for full version control and governance.
AI architecture: Holistics AI generates AQL — a composable, analytics-specific query language — rather than SQL. AQL encodes analytical intent (period comparisons, nested aggregations, percent-of-total) as first-class operations, so the AI reasons about analytical patterns instead of guessing SQL joins. Every analytics artifact (models, datasets, metrics, dashboards) is text-based code, version-controlled in Git, making AI outputs inspectable and auditable.
Key differentiators:
- Semantic-layer-first AI. The AI queries a rich semantic model where metrics, dimensions, and business logic are defined once and reused consistently. This eliminates the "different numbers in different dashboards" problem that plagues text-to-SQL approaches.
- AQL composability. Running totals, percent-of-total, nested aggregations, and period-over-period comparisons are native AQL operations. The AI can compose complex analytical logic without falling back to raw SQL.
- Programmable AI context. Analysts define organization-level instructions, business logic, and workflow guidance that shape how the AI generates queries — customizing tone, language, and analytical patterns at the repo or org level.
- Metric promotion loop. AI-generated metrics can be reviewed, refined, and promoted into the governed semantic model. Future users and future AI queries benefit from past corrections.
- Analytics-as-code. Models, datasets, and dashboards live in Git with review, testing, and CI/CD workflows — extending software engineering practices across the full BI lifecycle.
Limitations: Holistics' modeling layer has a learning curve for teams accustomed to GUI-only BI tools. Visualization design is functional rather than flashy — reliable charts and tables, but not Tableau-level visual polish. Some advanced patterns (role-playing dimensions, cross-model calculations) require extra modeling work. Capterra rating: 4.6/5 based on ~89 reviews.
Best fit: Data teams that want AI-powered analytics grounded in a governed semantic layer. Organizations that value inspectability and version control over AI outputs. Teams at 50-500 person companies that want Looker-grade governance without Looker-grade cost and overhead.
2. Power BI Copilot
Power BI Copilot is Microsoft's generative AI integration for Power BI, using Azure OpenAI to provide natural language querying, report summarization, and DAX generation within the Microsoft ecosystem.
AI architecture: Copilot works primarily through DAX (Data Analysis Expressions) — it generates DAX queries and narrative visuals based on natural language prompts. It leverages the Power BI semantic model for context, but its AI capabilities are oriented toward report consumption and summarization rather than exploratory analysis.
Key differentiators:
- Microsoft ecosystem integration. Native access to Excel, Teams, SharePoint, and Azure data sources. For organizations already committed to Microsoft 365, Copilot is the lowest-friction AI analytics option.
- Report summarization. Copilot generates summaries of report pages, visual data, and the underlying semantic model — useful for executives who consume dashboards but do not build them.
- DAX assistance. Copilot generates DAX queries from natural language, reducing the learning curve for a notoriously complex formula language.
Limitations: Copilot's AI is strongest at summarization and single-turn queries. Multi-step analytical reasoning — "show me revenue by region, then drill into the top 3 by growth rate" — is less reliable than dedicated analytical AI tools. DAX provides some abstraction, but is not a full semantic layer. Complex cross-table calculations can produce inconsistent results if the data model is not tightly governed. Requires Power BI Pro or Premium licensing plus Microsoft 365 Copilot.
Best fit: Organizations deep in the Microsoft ecosystem that want AI-assisted report consumption. Teams where the primary AI use case is summarization and DAX generation rather than exploratory analysis.
3. Tableau Einstein / GPT
Tableau's AI capabilities combine Einstein Discovery (predictive analytics) with GPT-powered natural language features, reflecting Salesforce's broader vision of embedded AI across its cloud ecosystem.
AI architecture: Tableau uses Einstein for automated insights and predictive modeling, with GPT integration for natural language querying and content generation. The AI works against Tableau's data model, but Tableau's strength has historically been visualization rather than semantic modeling.
Key differentiators:
- Predictive analytics. Einstein Discovery provides out-of-the-box forecasting, anomaly detection, and driver analysis. This is a genuine differentiator — few other tools on this list offer built-in ML-powered predictions.
- Explainable AI (XAI). Einstein shows how predictions are generated — which variables matter, confidence levels, and recommended actions.
- Salesforce ecosystem. Native CRM data integration for sales, marketing, and customer analytics use cases.
- Visualization depth. Tableau remains the industry benchmark for visualization richness and design flexibility.
Limitations: Tableau's semantic layer is thinner than Looker's or Holistics'. AI-generated queries can be less consistent when business logic lives in calculated fields scattered across workbooks rather than in a centralized model. Einstein Discovery is powerful but requires structured data preparation. The natural language querying (Ask Data, now Tableau GPT) has historically underperformed ThoughtSpot's search-driven approach. Salesforce/Tableau licensing is enterprise-priced.
Best fit: Organizations already in the Salesforce ecosystem. Teams where predictive analytics and visualization quality are the primary AI use cases. Enterprises with dedicated Tableau developers who can maintain consistent data models.
4. Looker Gemini
Looker's Gemini integration brings Google's AI directly into the LookML-governed analytics experience, targeting both business users (conversational analytics) and developers (LookML generation).
AI architecture: Gemini queries Looker's LookML semantic layer — the most mature semantic modeling language in the market. This means AI-generated queries are constrained by governed metric definitions, reducing hallucination risk. Gemini also assists developers by generating LookML parameters and visualization configurations from natural language prompts.
Key differentiators:
- LookML-governed AI. Every AI query runs against the LookML model, ensuring metric consistency. This is the same governance model that made Looker the enterprise standard for semantic-layer BI.
- Developer productivity. Gemini generates LookML parameters, reducing the time to build and maintain complex data models.
- Google Cloud ecosystem. Native BigQuery integration, Looker Studio connectivity, and Google Cloud compliance certifications.
Limitations: Looker requires a dedicated data team to build and maintain LookML models — it is not a plug-and-play tool. Gemini's conversational analytics are still maturing compared to ThoughtSpot's search experience. Cost is significant: enterprise contracts average ~$150,000/year (per Vendr analysis). LookML projects can become file-heavy and specialist-driven as complexity grows. Some teams report that AI follow-up questions break when complex metrics require derived tables or table calculations outside the governed layer.
Best fit: Large enterprises (500+ employees) with existing Looker deployments and LookML expertise. Organizations in the Google Cloud ecosystem. Teams that prioritize semantic governance over ease of onboarding.
5. ThoughtSpot Spotter (formerly Sage)
ThoughtSpot Spotter is an AI-native analytics experience built entirely around natural language search. Users type business questions and get instant visual answers, powered by GPT models (GPT-3.5T, GPT-4T, GPT-4o via Azure OpenAI).
AI architecture: Spotter translates natural language queries into relational searches against configured Worksheets — ThoughtSpot's lightweight semantic layer. The AI uses GPT to understand intent and generate SQL, with search tokens visible for verification. ThoughtSpot acquired Mode Analytics in 2023, adding SQL-based analyst workflows alongside the search interface.
Key differentiators:
- Strongest natural language search. ThoughtSpot's search interface is the fastest path from question to answer for non-technical users. The experience is closer to Google Search than to a traditional BI tool.
- SpotIQ automated insights. Proactively surfaces anomalies, trends, and correlations users might not think to ask about.
- AI-suggested searches. GPT-powered search suggestions help users formulate better questions against available data sources.
- Enterprise adoption. ThoughtSpot has strong enterprise traction with search-driven analytics, particularly in organizations with many non-technical users.
Limitations: ThoughtSpot's Worksheet model is a lighter semantic layer than LookML or Holistics' AQL — complex multi-step analyses can be harder than in code-native tools. The AI relies on well-structured data schemas underneath; messy data models produce unreliable search results. Enterprise pricing is a barrier for smaller teams. G2/Capterra rating: ~4.4/5.
Best fit: Organizations with many non-technical users who need ad-hoc answers fast. Enterprise teams willing to invest in data modeling upfront to enable search-driven self-service. Companies where the primary AI use case is "answer quick questions" rather than "build complex analytical workflows."
6. Sigma Computing
Sigma takes a distinctive approach by embedding AI directly into the cloud data warehouse layer. Rather than building a separate semantic layer, Sigma lets users call warehouse-native LLMs and build spreadsheet-like analyses with AI assistance.
AI architecture: Sigma's AI operates at the warehouse level — users can call LLMs (from Snowflake, Databricks, BigQuery, Redshift) directly from Sigma using SQL functions. Ask Sigma (beta) acts as an agentic AI that locates data sources and builds multi-step analyses, showing each step of its decision logic.
Key differentiators:
- Warehouse-native AI. By calling LLMs through the warehouse, Sigma avoids data movement and leverages existing warehouse security and governance.
- Agentic workflows. Ask Sigma triggers AI agents that autonomously find data, build analyses, and explain their reasoning.
- Spreadsheet-familiar interface. Business users work in an Excel-like environment with AI formula assistance, reducing the learning curve.
- AI chart explanations. Automatically generates natural language descriptions of any visualization.
Limitations: Sigma's AI capabilities depend on the warehouse's LLM offerings — features vary by warehouse vendor. Without a traditional semantic layer, metric consistency relies on careful worksheet management. Ask Sigma is still in beta. The spreadsheet paradigm works well for individual analysis but can create governance challenges at scale.
Best fit: Organizations with strong warehouse investments (Snowflake, Databricks) that want AI capabilities without adding a separate semantic layer. Teams with spreadsheet-comfortable users who need AI-assisted analysis.
7. Qlik AutoML
Qlik AutoML brings automated machine learning into the self-service analytics workflow. It is less focused on natural language querying and more on enabling business users to build, deploy, and interpret ML models without writing code.
AI architecture: Qlik AutoML walks users through the full ML lifecycle — data connection, target selection, model generation, prediction, and driver exploration — integrated with Qlik's Associative Engine for scenario planning.
Key differentiators:
- No-code ML. Provides a code-free interface for model generation, prediction, and what-if scenario planning.
- Explainable AI (XAI). Shows prediction-influencer data at the record level, making model outputs interpretable for business users.
- MLOps capabilities. Supports scaling and governing ML operations within the Qlik Cloud platform.
- Associative Engine integration. Real-time what-if scenario exploration using Qlik's signature associative data model.
Limitations: Qlik AutoML is primarily a machine learning tool, not a natural language BI tool. It does not offer conversational analytics or NL-to-chart generation. The Qlik platform has a steeper learning curve than newer tools. Pricing follows enterprise SaaS models.
Best fit: Organizations that need embedded ML capabilities within their BI platform. Teams focused on predictive analytics and scenario planning rather than natural language data exploration.
8. Zenlytics ZOE
ZOE is an AI assistant built on a governed Cognitive Layer — a centralized model of metrics and dimensions. Unlike text-to-SQL tools, ZOE queries this governed layer to deliver consistent results, with a Python sandbox for complex analyses.
AI architecture: ZOE queries governed measures and dimensions within the Zenlytic Cognitive Layer rather than translating text directly to SQL. This architecture ensures metric consistency. ZOE also has access to a sandboxed Python environment for complex analyses that go beyond standard BI queries.
Key differentiators:
- Cognitive Layer querying. Like Holistics AI and Looker Gemini, ZOE queries a governed semantic model — not raw tables. This produces more consistent results than text-to-SQL.
- Python sandbox. ZOE can run Python code on governed query results for statistical analysis, custom calculations, and data manipulation.
- Personal Field creation. Users can create personal metrics and dimensions that can be promoted to the global model through a review process.
- Slack and Teams integration. Users ask questions and receive answers directly in their communication platforms.
Limitations: Zenlytics is a smaller vendor with a narrower feature set than enterprise tools like Looker or Power BI. The Cognitive Layer requires setup and maintenance. Community and ecosystem support are limited compared to larger platforms.
Best fit: Mid-market teams that want governed AI analytics with a Python-powered analytical backend. Organizations that value the explorer-to-modeler promotion workflow for building institutional knowledge.
9. Luzmo IQ
Luzmo IQ is designed specifically for embedding AI-powered analytics into software products. Rather than standalone BI dashboards, Luzmo equips SaaS vendors with AI chatbots, search interfaces, and executive summaries built directly into their applications.
AI architecture: Luzmo IQ uses OpenAI for natural language processing, built on Luzmo's Query Engine, Access Control Layer, and Warp data acceleration service. It provides pre-built UI components (chat, answer) and API endpoints for custom integrations.
Key differentiators:
- Embedded-first AI. Purpose-built for SaaS companies embedding analytics into their products, not for internal BI teams.
- Pre-built AI components. Ready-to-go chat interfaces, executive summaries, and search widgets that can be dropped into any application.
- Multi-format responses. Delivers answers as text, interactive charts, or both — adapting to the embedding context.
Limitations: Luzmo IQ is optimized for embedded use cases; it is not a general-purpose internal BI tool. The semantic modeling capabilities are thinner than dedicated BI platforms. AI accuracy depends on how well the data model is configured in Luzmo's system.
Best fit: SaaS companies building customer-facing analytics with AI-powered data exploration. Product teams that need embeddable AI analytics components rather than a standalone BI platform.
10. Julius AI
Julius AI is not a traditional BI tool. It is a multimodal data assistant that combines natural language, code generation (Python, R), and statistical analysis into a single conversational interface.
AI architecture: Julius uses multiple LLMs (GPT-4, Claude) and generates Python or R code to analyze data. It operates without a semantic layer — users upload files or connect databases, and the AI works directly against the raw data.
Key differentiators:
- Statistical analysis depth. Performs t-tests, chi-square, ANOVA, PCA, and forecasting — capabilities that most BI tools do not offer natively.
- Multi-LLM approach. Uses different LLMs for different tasks, selecting the best model for each analytical operation.
- Document parsing. Summarizes PDFs, generates literature reviews, and parses unstructured data alongside structured analysis.
- Lowest barrier to entry. Upload a CSV, ask a question, get an answer — no data modeling, no configuration.
Limitations: Julius AI has no semantic layer, no metric governance, and no multi-user consistency controls. Two users asking the same question might get different answers if they phrase it differently. It is an individual analyst tool, not a platform for organizational analytics. There is no version control, no row-level security, and no dashboard management.
Best fit: Individual analysts and researchers who need quick statistical analysis and data exploration. Academic use cases, ad-hoc data investigation, and prototype analytics. Not suitable for governed organizational BI.
Frequently Asked Questions
How do I compare usage-based pricing for the top ai-driven bi platforms that suit a mid-sized analytics team?
For a mid-sized analytics team (say 5–25 builders + 50–500 consumers) prioritizing AI-driven capabilities, usage-based pricing can be flexible, especially for lots of viewers, but you’ll want to model who pays by seat vs what’s metered (sessions/queries/credits/compute) to avoid surprise bills. Top platforms to compare include Holistics, ThoughtSpot, Sigma Computing, Tableau (Einstein), and Amazon QuickSight.
Two AI-specific pricing questions to add to every comparison
1. Holistics (Best for AI-first Self-Service Analytics)
Holistics uses a feature-tiered platform with user-based add-ons, so you can keep costs predictable and scale seats only where needed.
ThoughtSpot centers on natural language search and automated insights, and commonly pushes consumption-style pricing.
3. Amazon QuickSight (Best for AWS Ecosystem)
QuickSight is one of the clearest “usage-shaped” options, especially for large reader populations.
Two AI-specific pricing questions to add to every comparison
- Are AI features included, or metered separately (credits, add-on, premium edition)?
- Can you restrict AI usage to certain roles (e.g., builders only vs all viewers)?
1. Holistics (Best for AI-first Self-Service Analytics)
Holistics uses a feature-tiered platform with user-based add-ons, so you can keep costs predictable and scale seats only where needed.
- Pricing structure: Platform tiers + user-based add-ons (to control cost by role/need).
- Usage options: Custom query-based plans are available for high-usage teams.
- Best for: Teams that want tighter cost control than pure consumption pricing, with an upgrade path when query volume gets large.
ThoughtSpot centers on natural language search and automated insights, and commonly pushes consumption-style pricing.
- Pricing structure: Mix of user-based + usage credits
- Usage factors: Query volume, complexity, and peak usage drive credit burn.
- Best for: Teams wanting fast, search-based answers with heavy self-serve exploration.
3. Amazon QuickSight (Best for AWS Ecosystem)
QuickSight is one of the clearest “usage-shaped” options, especially for large reader populations.
- Pricing structure: Authors by license; Readers can be pay-per-session (with a monthly cap).
- Usage factors: Active session counts + SPICE usage (if you use it).
- Best for: AWS-first teams with fluctuating consumption and lots of occasional viewers.
Which ai-enabled BI tools offer collaborative commenting and version history out of the box?
Tools with built-in commenting:
- Power BI offers native, in-context commenting on dashboards, reports, and individual visuals.
- Tableau supports annotations and comments on dashboards and reports via Tableau Server or Tableau Cloud.
- Holistics provides Git-native version control for models and dashboards, enabling full change history and collaboration through standard Git workflows.
- Tableau includes proprietary workbook revision history within Tableau Server and Tableau Cloud.
Which AI-powered BI platforms integrate smoothly with Snowflake and let business teams (ops, marketing, finance) build drag-and-drop dashboards?
All of the AI-powered BI tools in this guide integrate well with Snowflake. Among them, the ones that offer drag-and-drop dashboard building (well-suited for ops/marketing teams) include Holistics, Looker, and Lightdash.
Generative AI has gotten pretty good at descriptive analytics. i recently tried Gemini in Looker and as long as the tables had descriptive column names, it did a great job answering business questions that my stakeholders usually will go to a dashboard for.
I've been in analytics for 16 years, I have used most top models for interacting with data on the analytics maturity spectrum by now. Any job where the core KRA is building dashboards/ reports is already at risk as long as there's an appetite in your company to use AI.
It's garbage in garbage out process. If the underlying table has false/no data description or column names or misleading column names, it's set to come up with incorrect insights. No surprises there and it's more of a data problem than a Gen AI problem.
Reg: first layer, that's what I meant with the descriptive analytics. I've had a bit of success having AI explain what contributed to a spike or drop in a kpi but then I made sure proactively that it had access to data needed to derive that.
It's not able to do exploratory analysis...yet but we've barely crossed 2 years and the capabilities multiplied rapidly. It's just a matter of time it does a decent job on exploratory analysis and once that is accomplished, predictive analytics wouldn't be a far-fetched dream.
Having said this, it's a lot dependent on human governance (prompting, supplying credible data etc.) but those wouldn't be limited to just analysts. Anyone would be able to use natural language to interact with data.