Dashboard Period Comparison
Introduction
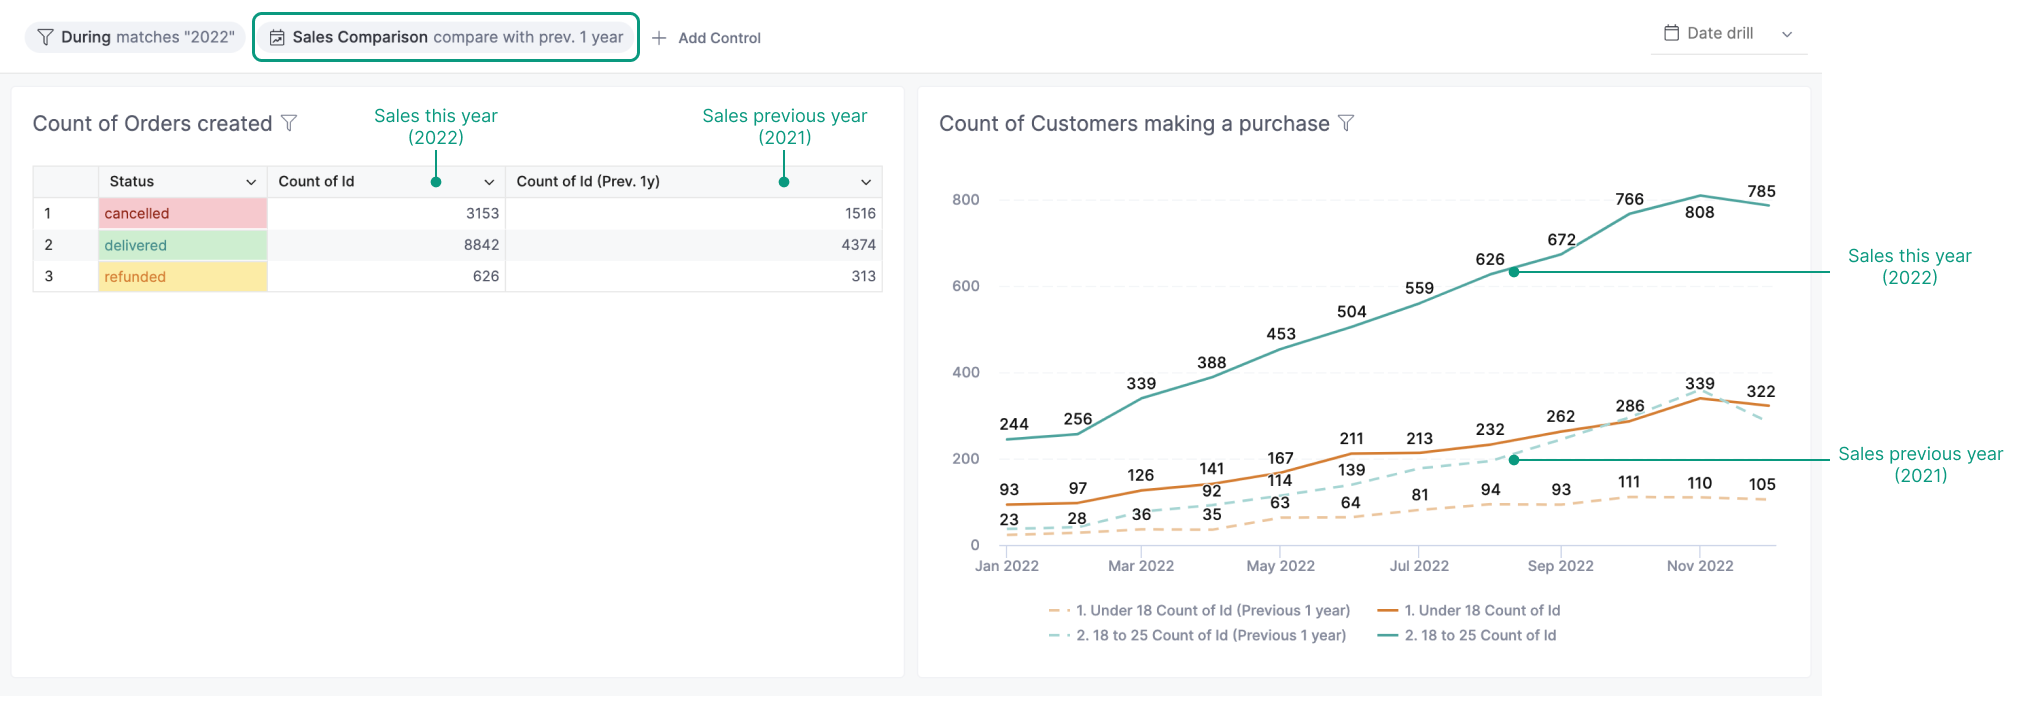
Holistics’s Period Comparison capability enables non-technical users to visually compare data from different time periods, e.g: comparing revenue data this quarter with same quarter last year.
In Holistics, you can set up Period Comparison at two different levels: Dashboard level, and Widget level.
This article explains how to work with Dashboard-level Period Comparison (or Dashboard Period Comparison). For Widget-level Period Comparison, please refer to this document: Period Comparison.
When does Dashboard Period Comparison get useful?
As Dashboard Period Comparison operates on the dashboard level, it offers certain flexibilities of a dashboard interactive feature, similar to Dashboard Filter. These include:
- Creators can selectively map several widgets to the same comparison at once
- Dashboard viewers can change the comparison period
High-level Mechanism
Comparison mechanism: Previous period & Custom period
Dashboard Period Comparison supports two types of comparison:
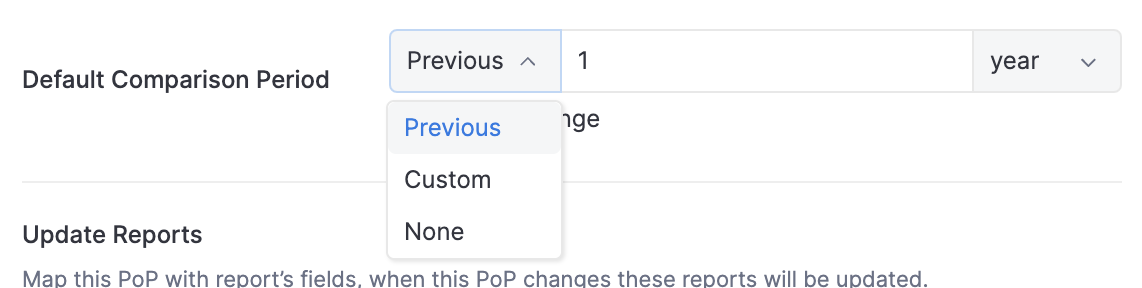
- Previous period: a relative time shift from the original timeframe (Example: compare with 2 months ago)
- Custom period (Beta): an absolute timeframe chosen by you (Example: compare with range 2022-05-24 to 2022-08-11)
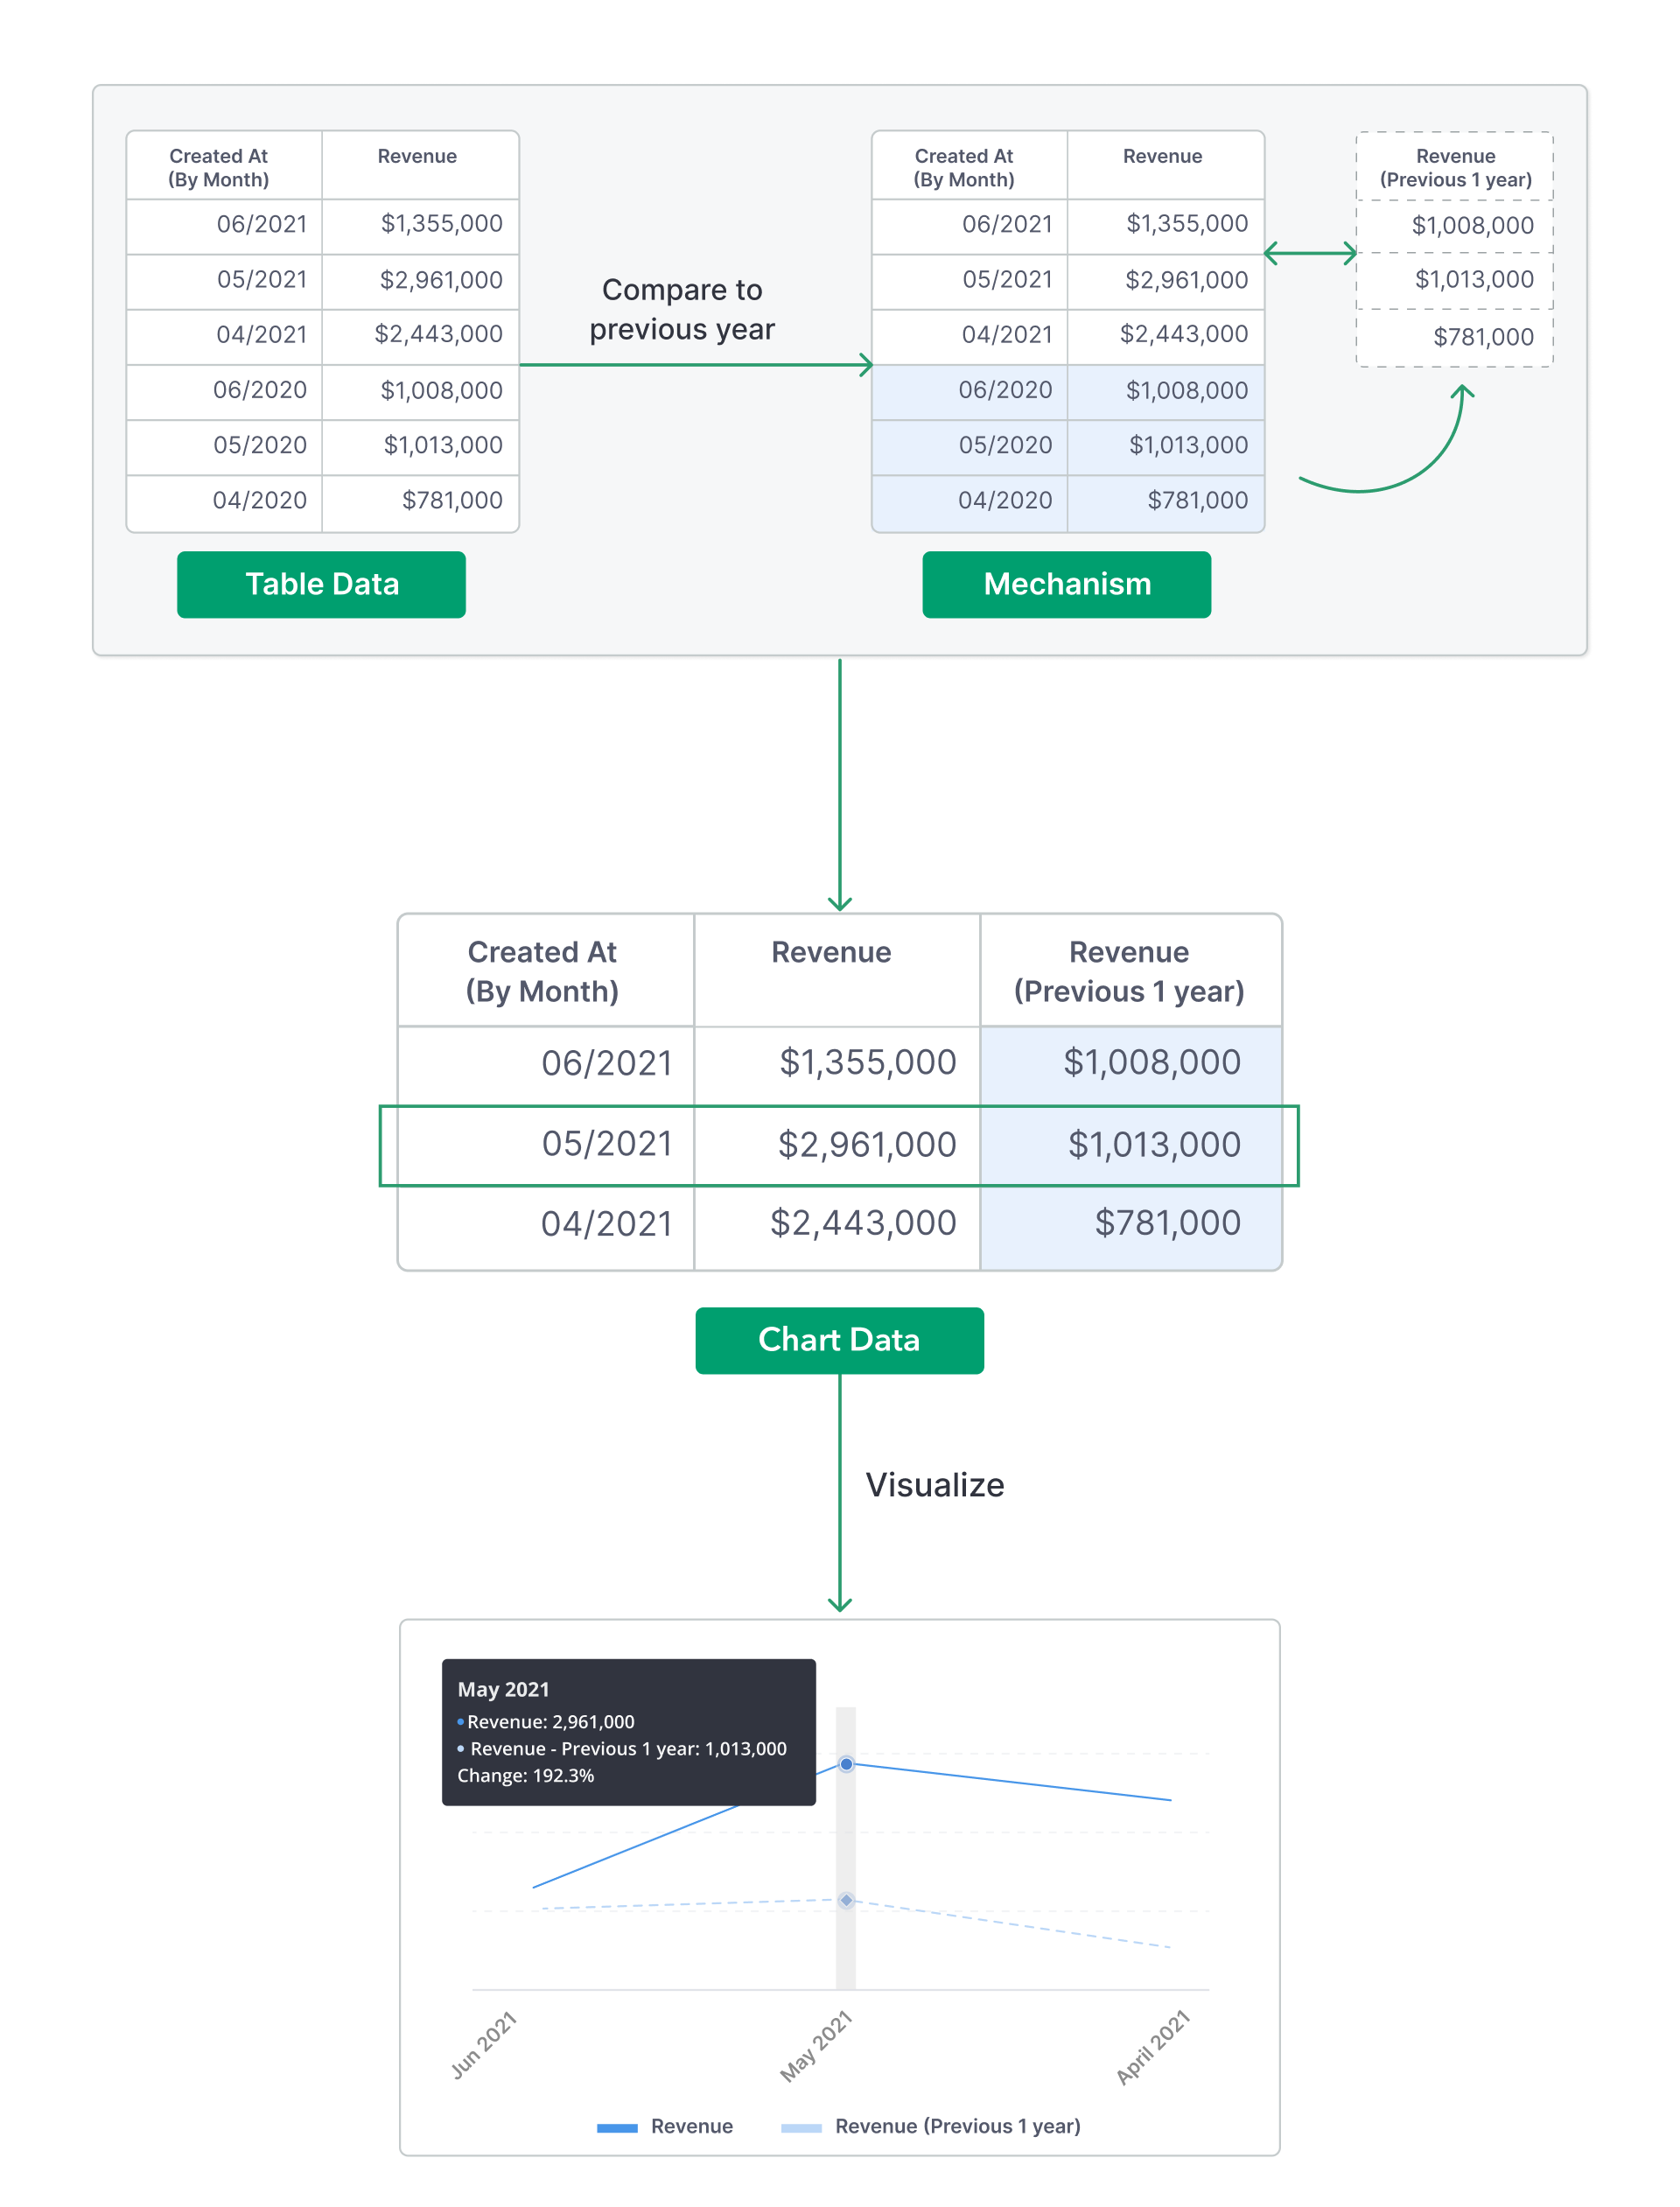
1. Previous period Comparison
Similar to Widget-level Period Comparison’s mechanism, Dashboard Period Comparison will generate an additional data series, which is similar to the original one but shifted back by the chosen period. These two series will then be overlaid on top of each other in the chart.
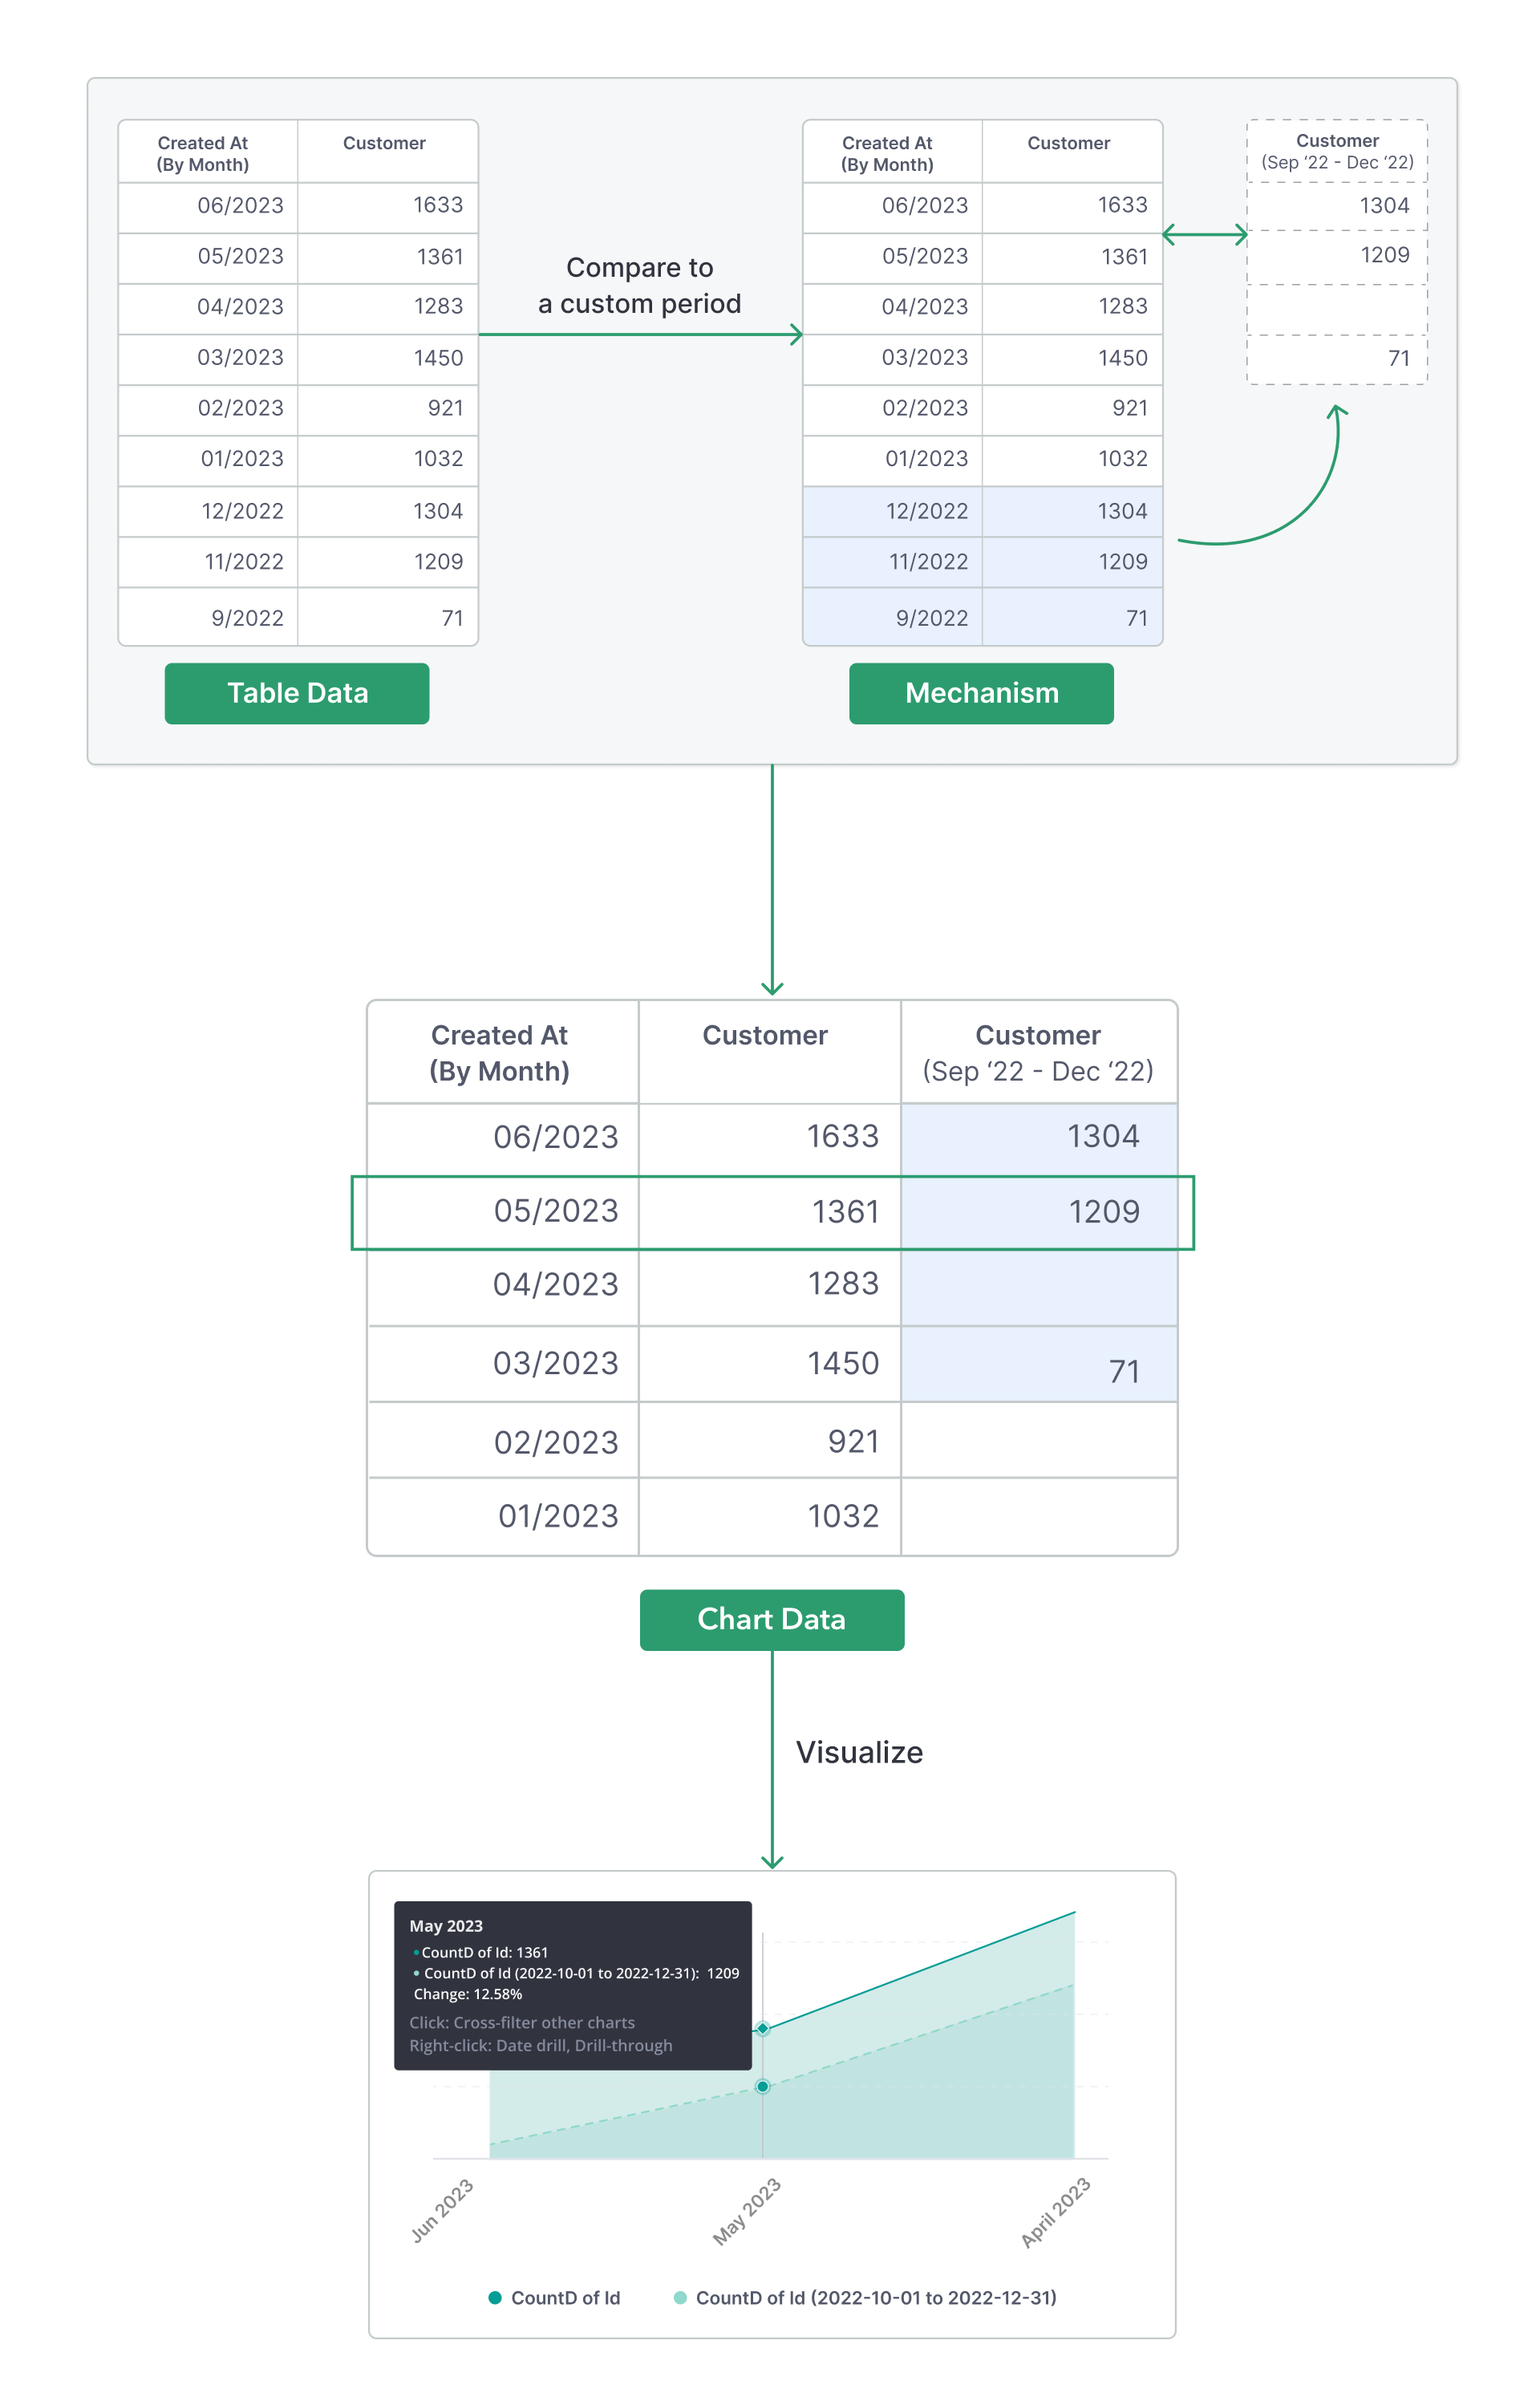
2. Custom period Comparison (Beta)
The Custom period comparison type is currently in Beta.
Dashboard Period Comparison will generate another data series from the chosen arbitrary timeframe, and put it next to the original series. These two series will then be overlaid on top of each other in the chart.
Mapping to a widget(s)
Once enabled for a widget(s), Dashboard Period Comparison will apply its comparison mechanism to any Date fields it is mapped to. Thus, it will update the comparison period according to the original period in each widget.
Example:
- You map a Previous period Comparison of
2 months agoto two widgets - A and B. Widget A's original period is filtered to08/2023, while widget B's period is filtered to05/2023 - After applying the Period Comparison, the comparison period will be
06/2023for widget A, and03/2023for widget B.
Tutorial
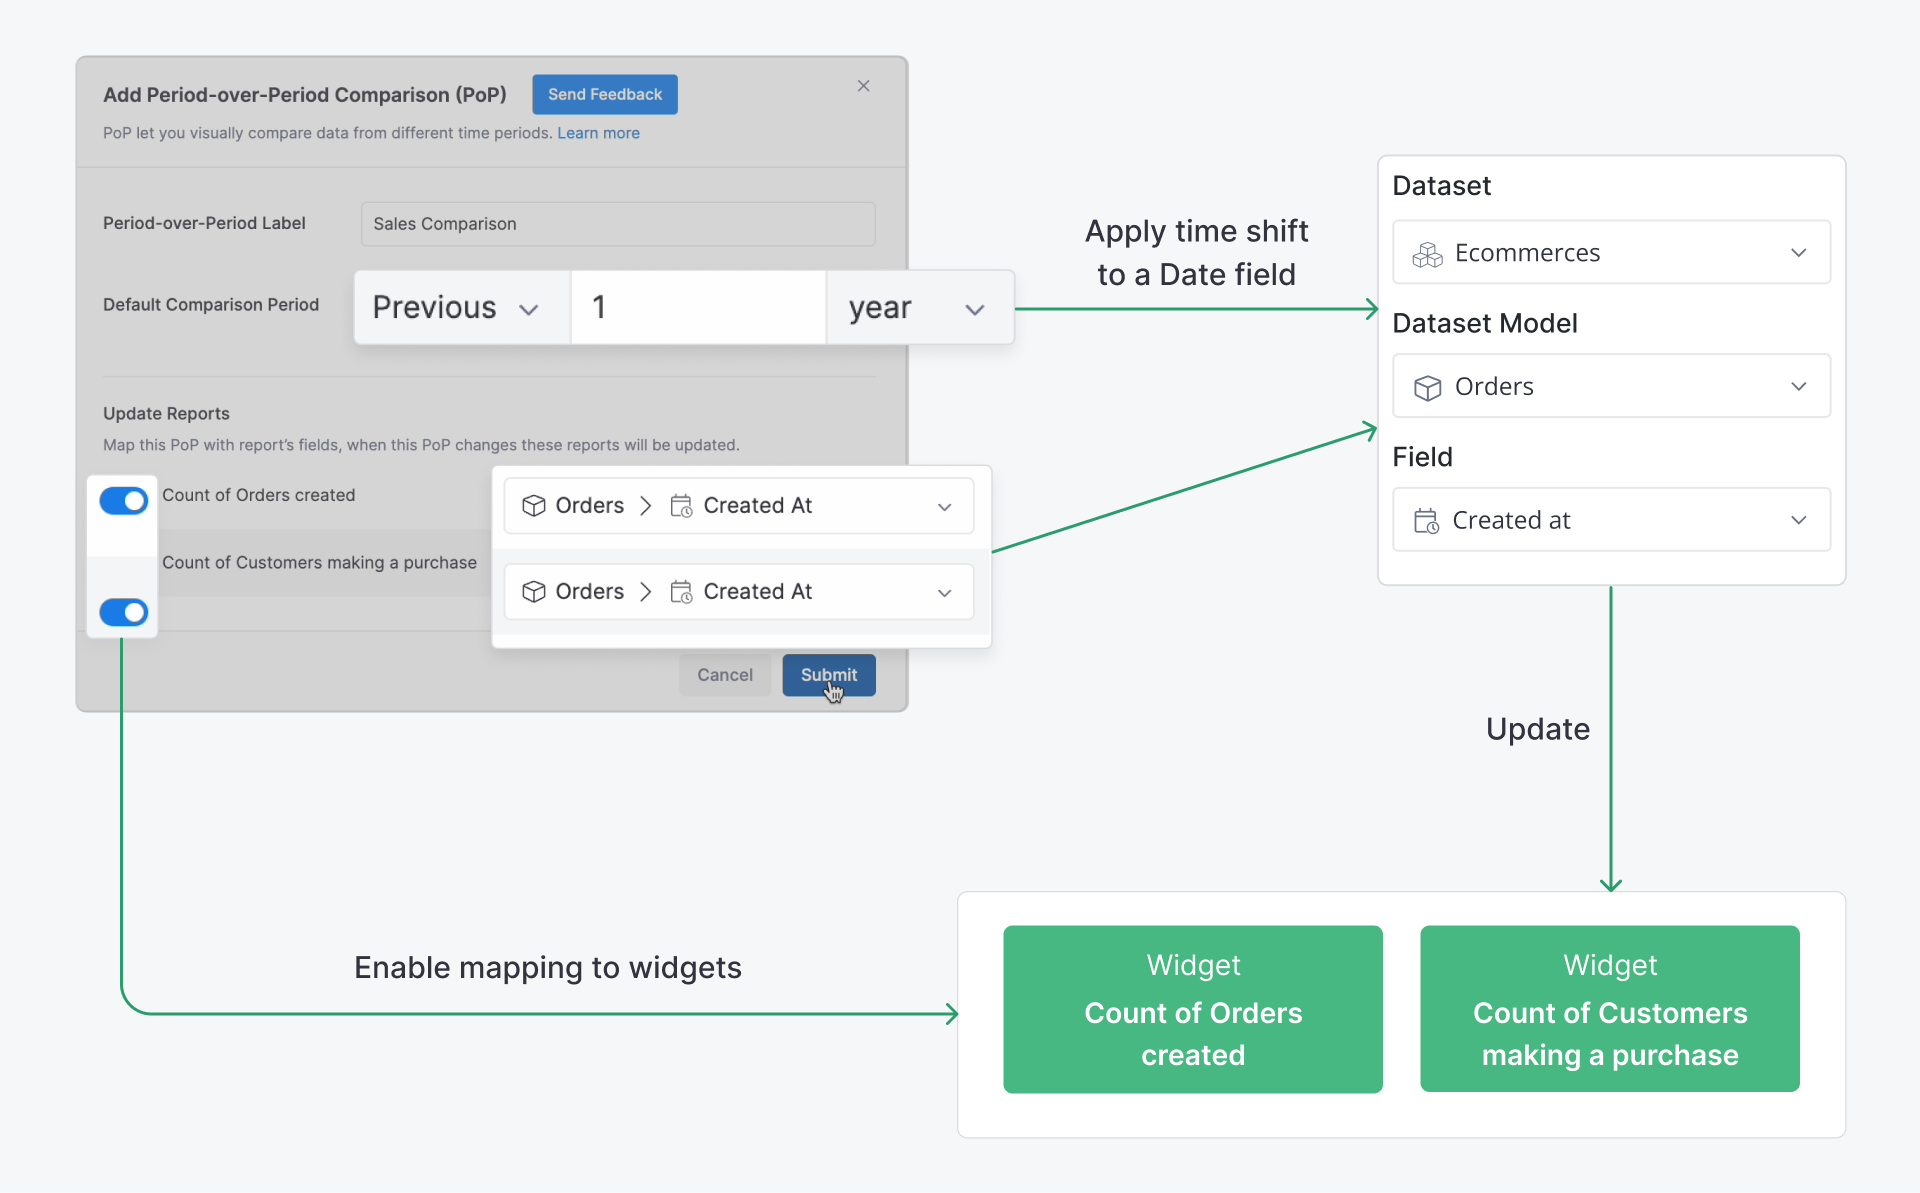
You can set up a Dashboard Period Comparison following these steps:
- On Widget’s Settings: Select at least one aggregated field (or measure) from the dataset
- On Dashboard: Click on the “Add Control” button, and choose “Period Comparison” from the drop-down menu
- On the “Add Period Comparison” modal:
- Select the Comparison type & Period to compare
- Enable the widgets you want to map to
- Choose a date field for comparison in each enabled widget
Acknowledgments
- Map & Override Behavior:
- Each widget can be mapped to only one Dashboard Period Comparison at the same time
- If a widget already has Period Comparison in its settings, Dashboard Period Comparison will override it
- Databases & Visualization types that Dashboard Period Comparison is supported for:
- More information in Period Comparison
- When you save an exploration as a dashboard widget, any Dashboard Period Comparison at the moment will be retained as Widget Period Comparison. See more in Save your Data Exploration.
FAQ
Dashboard Period Comparison for non-time-series (categorical) chart
- Previous period Comparison
- For non-time-series charts, you need to set a filter on the Period Comparison's Date Field to narrow down the range. Without a filtering condition, two periods will return the same result.
- More information in: Period | Applying date filter for non-time-series charts.
- Custom period Comparison
- You can perform Period Comparison Custom period on non-time-series charts, since Holistics already requests you to determine a comparison period beforehand.
On the roadmap
- Custom period Comparison for more databases: MySQL, Microsoft SQL Server, Clickhouse.