What's new in Heatmap?

From 26th March 2021, Holistics has released a new version of the Heatmap (previously "Geo Heat map"), with the updates listed in this post. Any Heatmap created before 26th March 2021 will be referred to as "legacy Heatmap".
Recent changes to our Geo Heatmap
1. Change of fields in Viz Settings
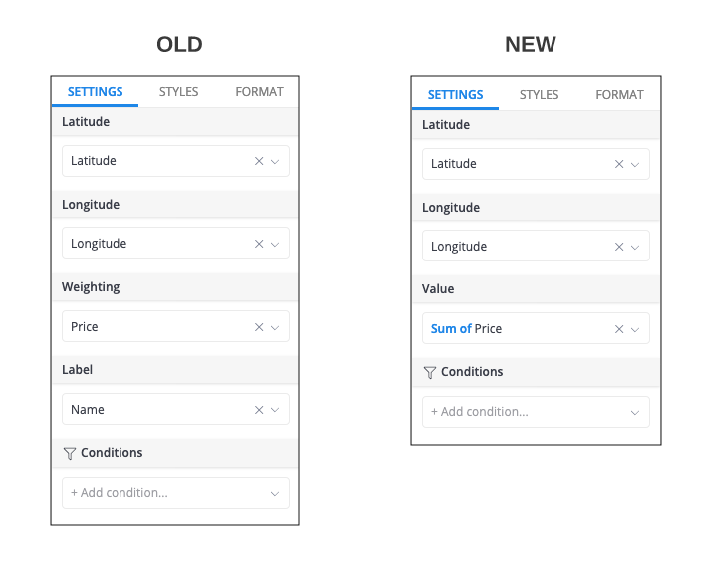
In the new version of Geo Heatmap, we removed Weighting and Label fields, and add Value field to the Viz settings.
The new Value field is equal to the Weighting field in the legacy heatmap. This field is used to calibrate the color intensity on the map.
- If this field is empty, the color of an area will be determined only with the density of points in that area.
- If this field has value, Holistics will take a point's value into account when calculating the intensity of color.
2. Switch color palette from Jet to Viridis
We've switched the default color palette from Jet to Viridis. Here are the reasons why we moved away from Jet:
- Not perceptually uniform: in Jet color palette, values close to each other have very different colors. This does a poor job at showing the gradual change in density. Moreover, the strong contrast between color steps may cause the misconception of a sudden change in density between regions.
- Not colorblind-friendly: People with certain color blindness may find it difficult to pick up all colors in the palette and perceive the color change between regions.
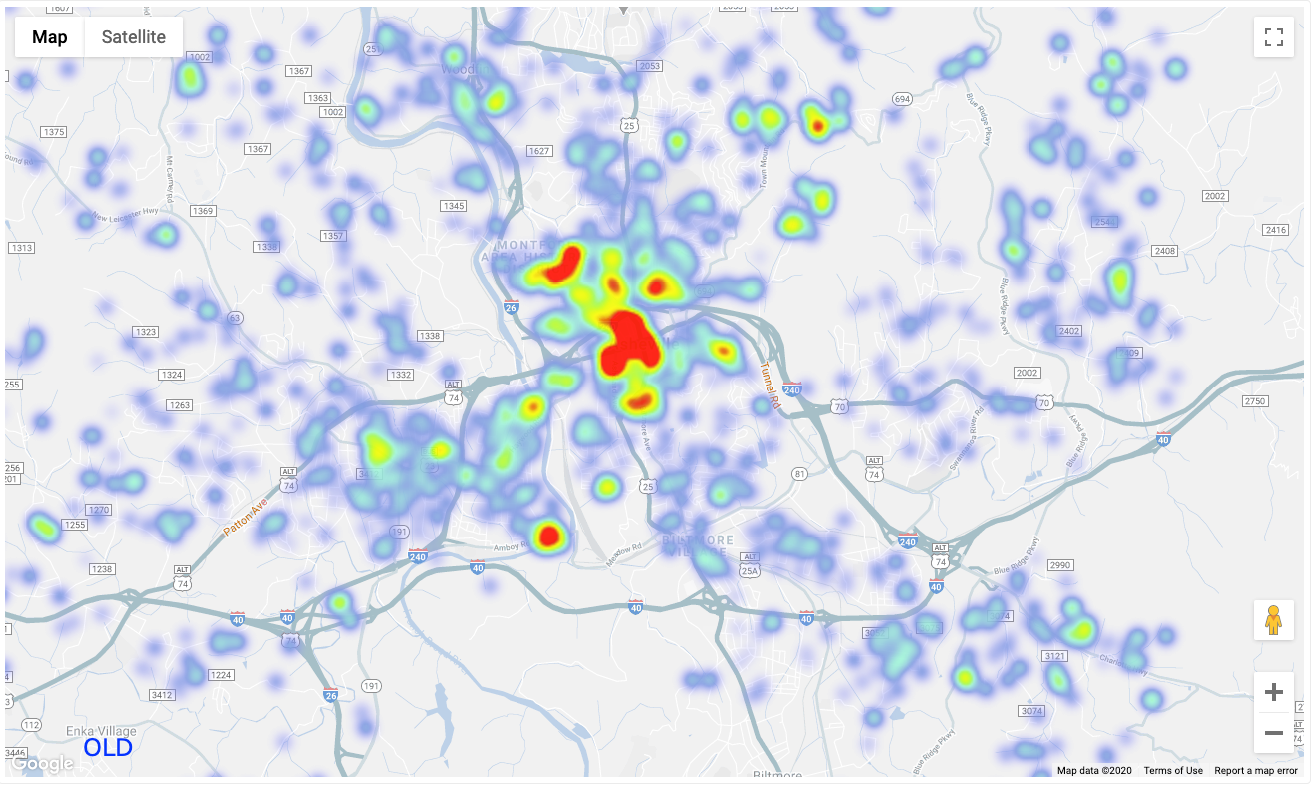
The upsides of Viridis color scale:
- Perceptually uniform: values close to each other have similar-looking colors, while values far away from each other have different colors. This means the gradual change of density is conveyed more accurately.
- Colorblind-friendly: Viridis palette performs better when it comes to the color blind tests. It is more eye-pleasing and offers more contrast between high and low values.
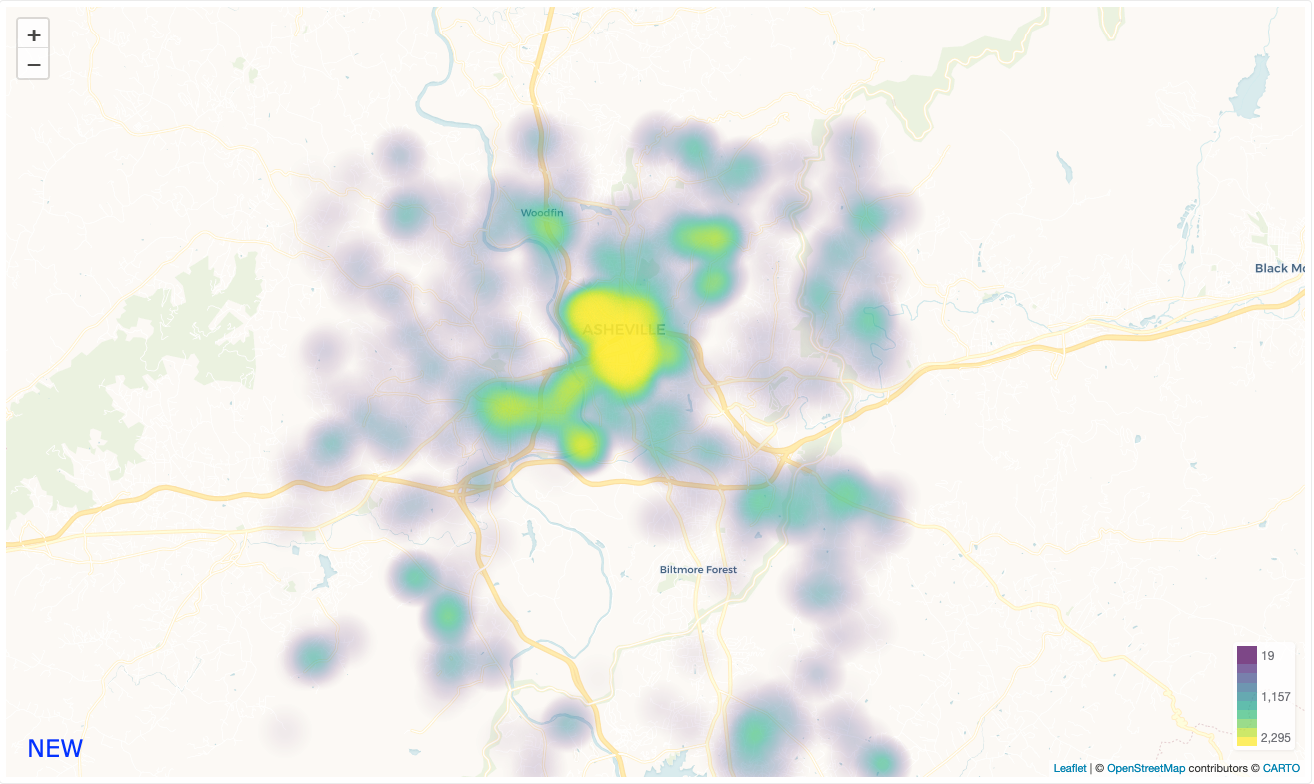
3. Replace Google Map with Openstreetmap
As you have already noticed from the above images, we have switched from Google Map to Openstreetmap as our main map service provider. This is because Openstreetmap integrates better with JavaScript libraries like LeafletJS, which allows us to add more customization options for our end users. For example
- Customize heatmap colors based on min and max values
- Change background styles, opacity, and intensity.
For example, we can customize a dark style for the heatmap:
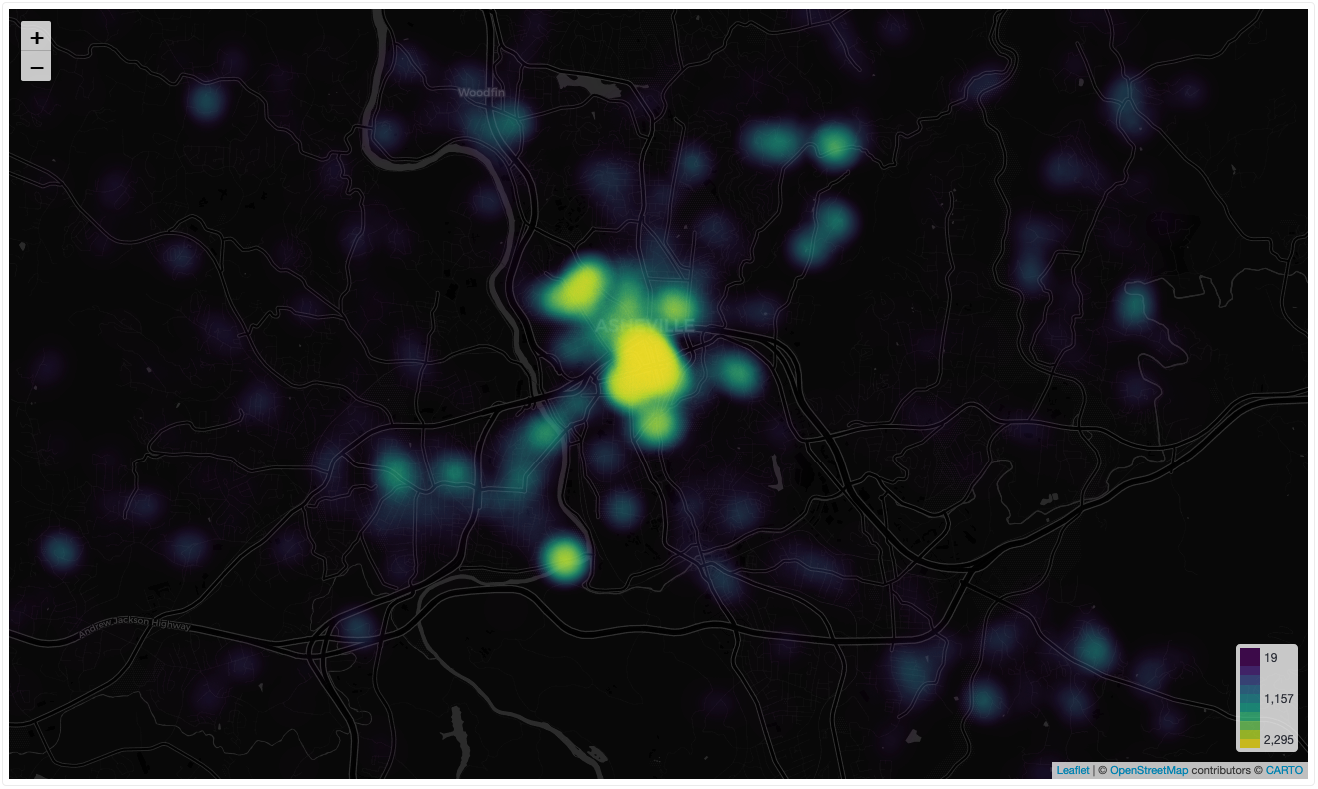
or change color scale to blue-pink and reduce the opacity for a clearer street view:
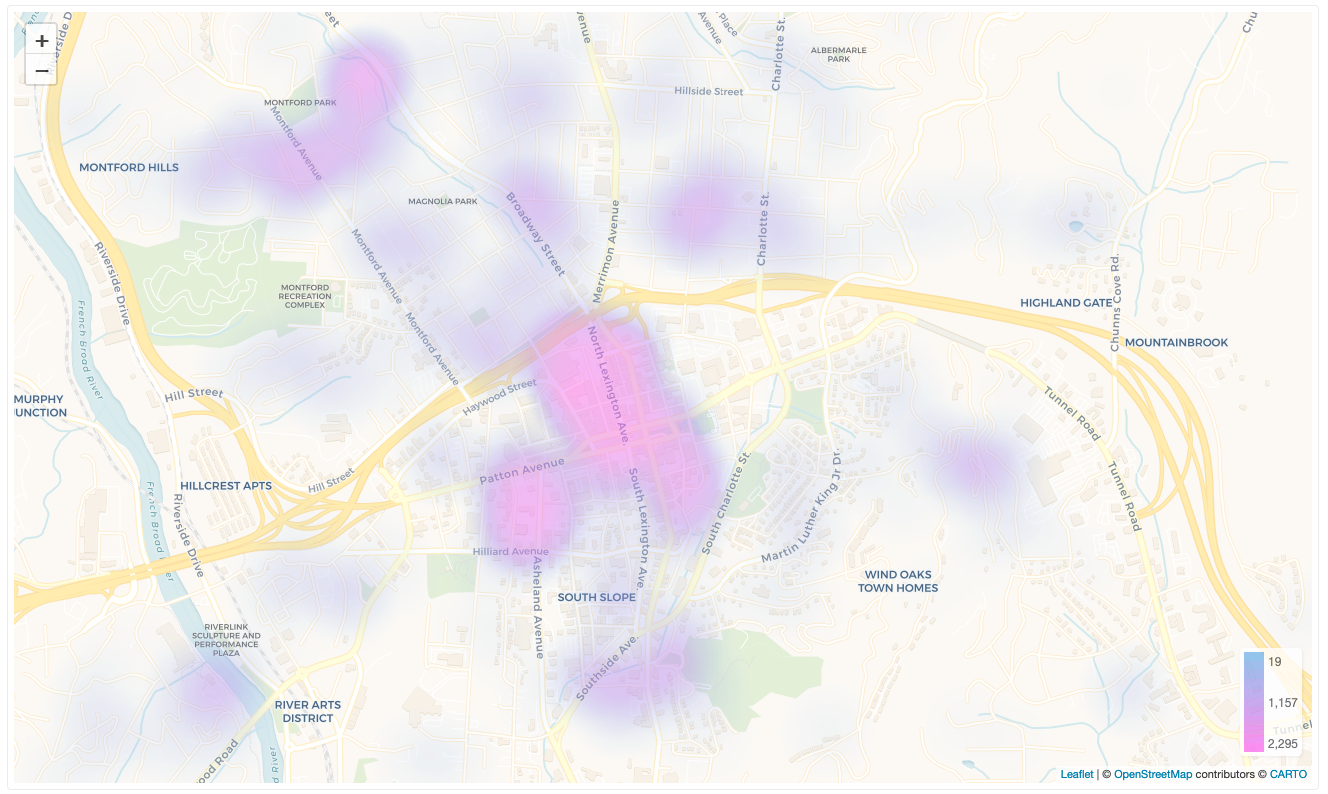
4. "Show Marker" feature is disabled
In the legacy heatmap, it is possible to show a marker on top of a coordinate on the map. This feature is currently unavailable in the new heatmap, but we are working to bring it back.
How will this update impact your current Heatmaps?
By default, we have updated all the legacy Heatmap to the new version. All your data and settings are kept intact, and you will not need to do anything else.
Please note that the Show Marker feature is not yet available in the new heatmap, therefore it will not display the marker and the label data of the legacy heatmap.
Here is a comparison table for you:
| Legacy Heatmap | New Heatmap |
|---|---|
| Default map color = Red-green (Jet system) | Default map color = yellow-blue (Viridis system) |
| Label | Removed |
| Auto center | Removed |
| Show marker | Not available yet |
| Max intensity | Opacity |
| Weight | Value |
| Circle radius | Intensity |
—
Have a feature request? Or have any problem with the new Heatmap? Let us know at [email protected] and we'll support you asap!
What's happening in the BI world?
Join 30k+ people to get insights from BI practitioners around the globe. In your inbox. Every week. Learn more
No spam, ever. We respect your email privacy. Unsubscribe anytime.
